Bitcoin (BTC) Price Prediction: BTC Closes in on the $72,000 Mark
Estimated Reading Time: 3 minutes
Don’t invest unless you’re prepared to lose all the money you invest. This is a high-risk investment and you are unlikely to be protected if something goes wrong. Take 2 minutes to learn more

Bitcoin (BTC) Price Prediction: May 22
Price activity in the Bitcoin daily market has stayed above the $65,000 threshold ever since it broke the resistance at that price mark eight sessions ago. The upside move received a significant boost two sessions ago when prices surged considerably in a single session.
BTC/USDT Long-term Trend: Bearish (Daily Chart)
Resistance Levels: $75,000, $80,000, and $85,000
Support Levels: $65,000, $60,000, and $55,000
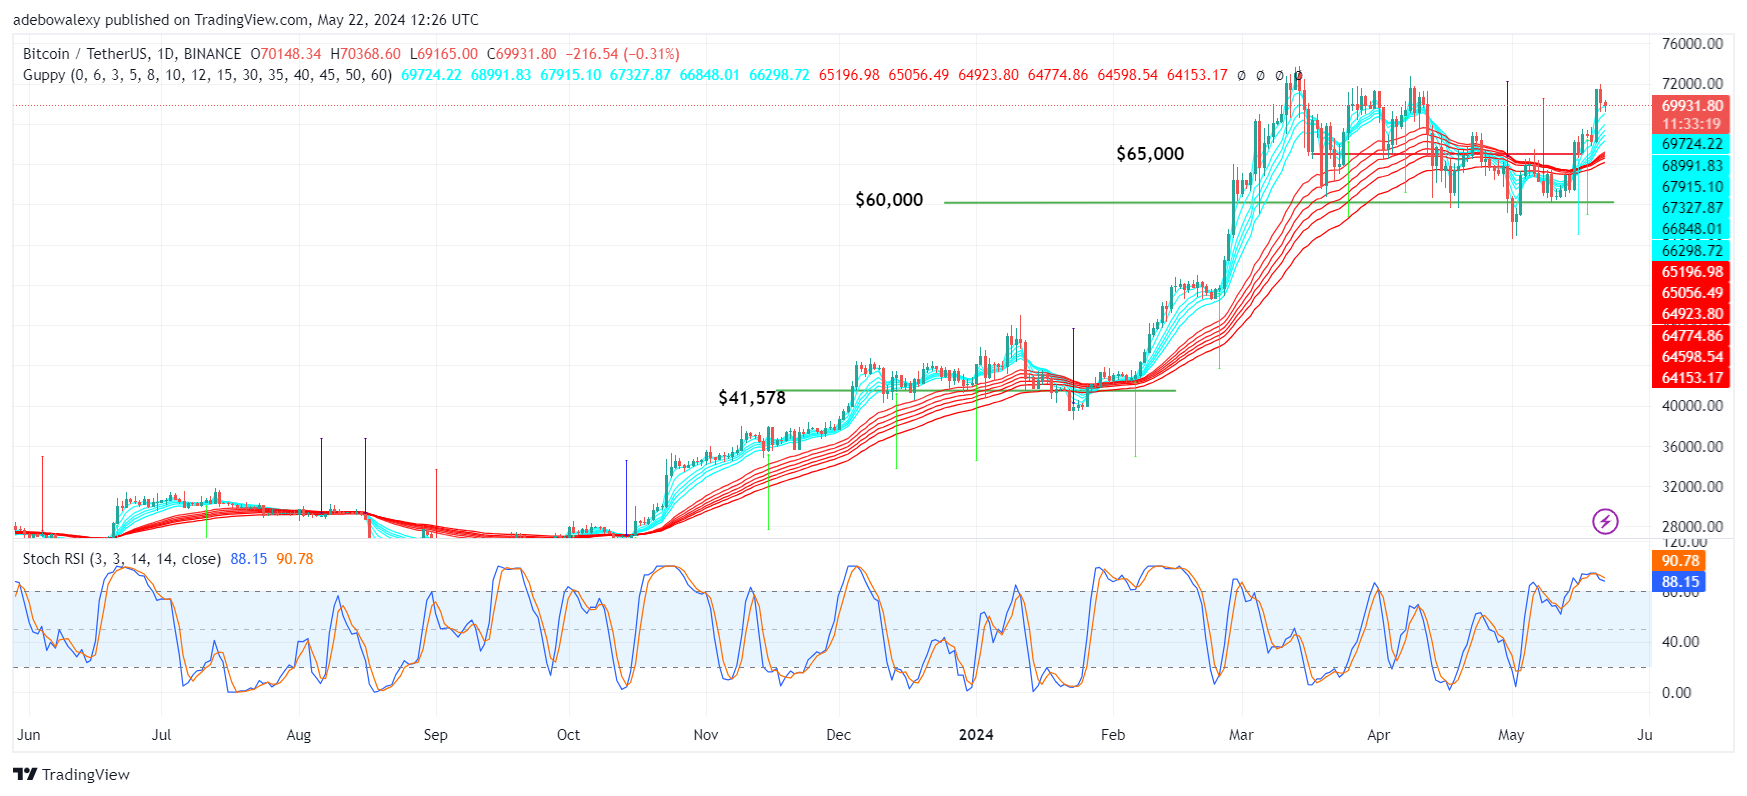
Afterwards headwinds caused a minor downward correction in the previous session. The current session has seen further downward corrections. However, the token continues to trade above the Guppy Multiple Moving Average (GMMA) lines. Likewise, the Stochastic Relative Strength Index (SRSI) indicator lines have seen a downward deflection in response to the price correction. Nevertheless, these indicator lines remain in the overbought region and seem to have a somewhat sideways trajectory.
Bitcoin Price Prediction: Will the Downward Correction Continue?
Based on the signs from technical indicators in the Bitcoin daily market, it appears that the downward correction may not persist. The market continues to trade at a significant distance above the broken resistance level at the $65,000 mark. The profits printed in the past three sessions continue to overwhelm bearish activity.
In addition, most of the GMMA indicator lines remain below the price action, suggesting that upside forces have a greater chance of regaining control. Meanwhile, the characteristic of the last price candle suggests that upside forces are already acting positively, causing the market to contract upwards. This suggests that prices may still advance toward higher marks.
BTC/USDT Medium-term Trend: Bulls Are Resuming Activity (4H Chart)
In the Bitcoin 4-hour market, it can be seen that upside market forces are already taking charge. The cause of the earlier noted upside contraction has been revealed. The last price candle on this chart appears considerably larger than the previous one. Also, through it, BTC has resumed trading above the GMMA indicator lines. The Moving Average Convergence Divergence (MACD) indicator can be spotted above the equilibrium level, and it has delivered a bearish crossover that seems somewhat sideways at this point.
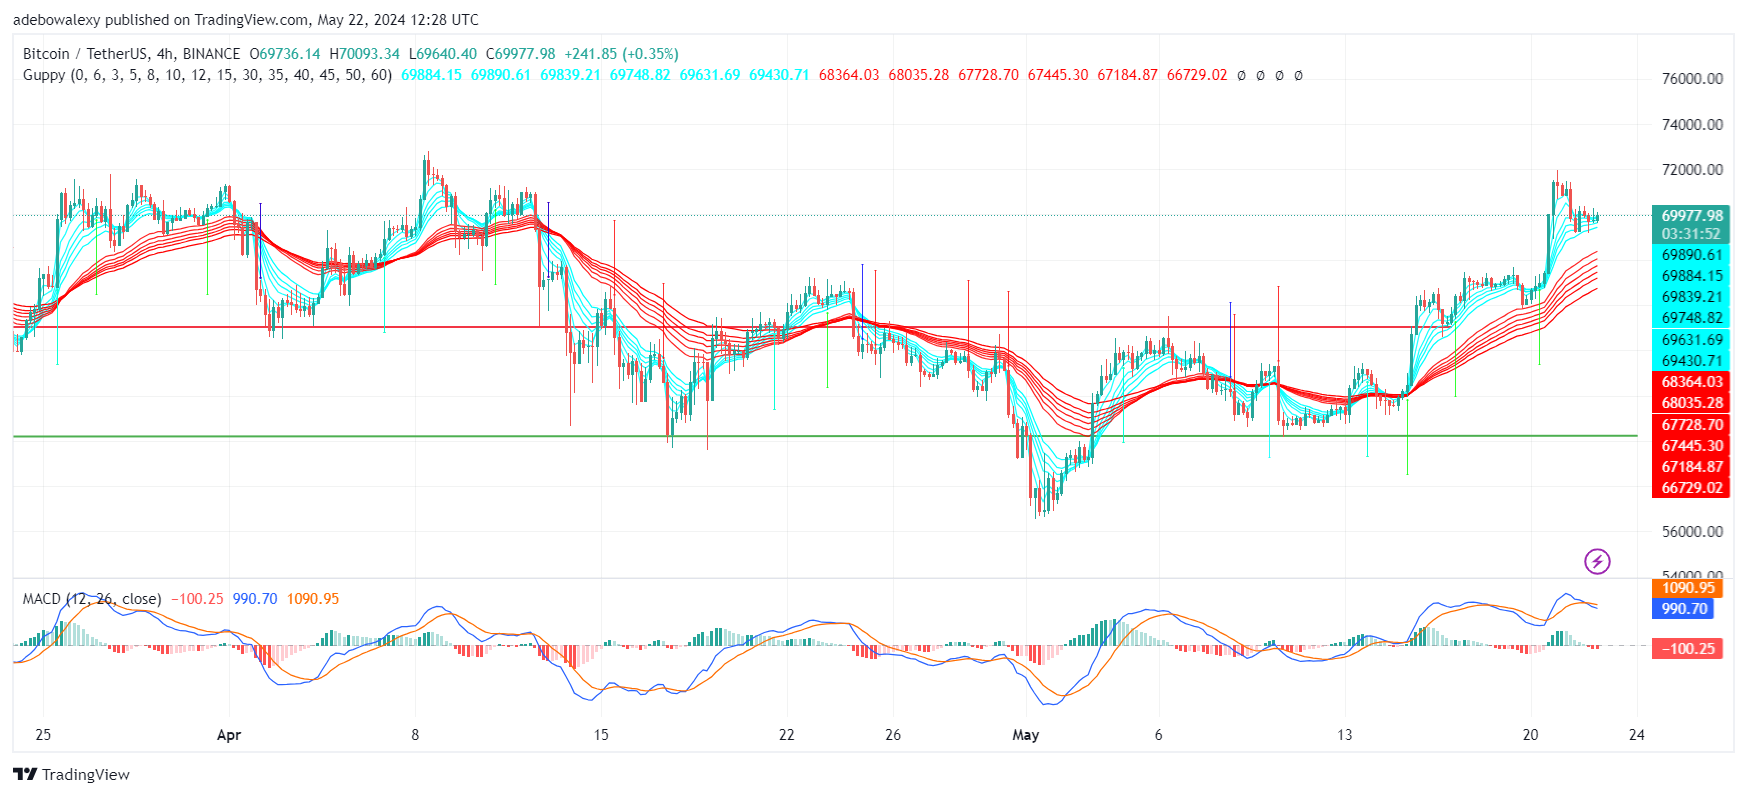
Combining the fact that price activity is now above the equilibrium level with the appearance of the MACD lines above the equilibrium level, it seems likely that upside momentum may increase. This will further propel the market towards higher marks. Additionally, a crossover on the MACD indicator at this point will be advantageous to bull traders as it may cause the market to rise through the $72,000 mark.