Bitcoin (BTC) Price Prediction: BTC/USDT Has an Upside Focus
Estimated Reading Time: 2 minutes
Don’t invest unless you’re prepared to lose all the money you invest. This is a high-risk investment and you are unlikely to be protected if something goes wrong. Take 2 minutes to learn more

Date: July 22, 2025
The Bitcoin market remains trapped below the $120,000 price level, a situation that has persisted for several days. Nevertheless, the market appears to remain focused on higher price levels.
Bitcoin (BTC) Price Prediction: BTC/USDT Long-Term Trend — Bullish (Daily Chart)
Key Price Levels:
Resistance: $120,000, $125,000, $130,000
Support: $115,000, $110,000, $105,000
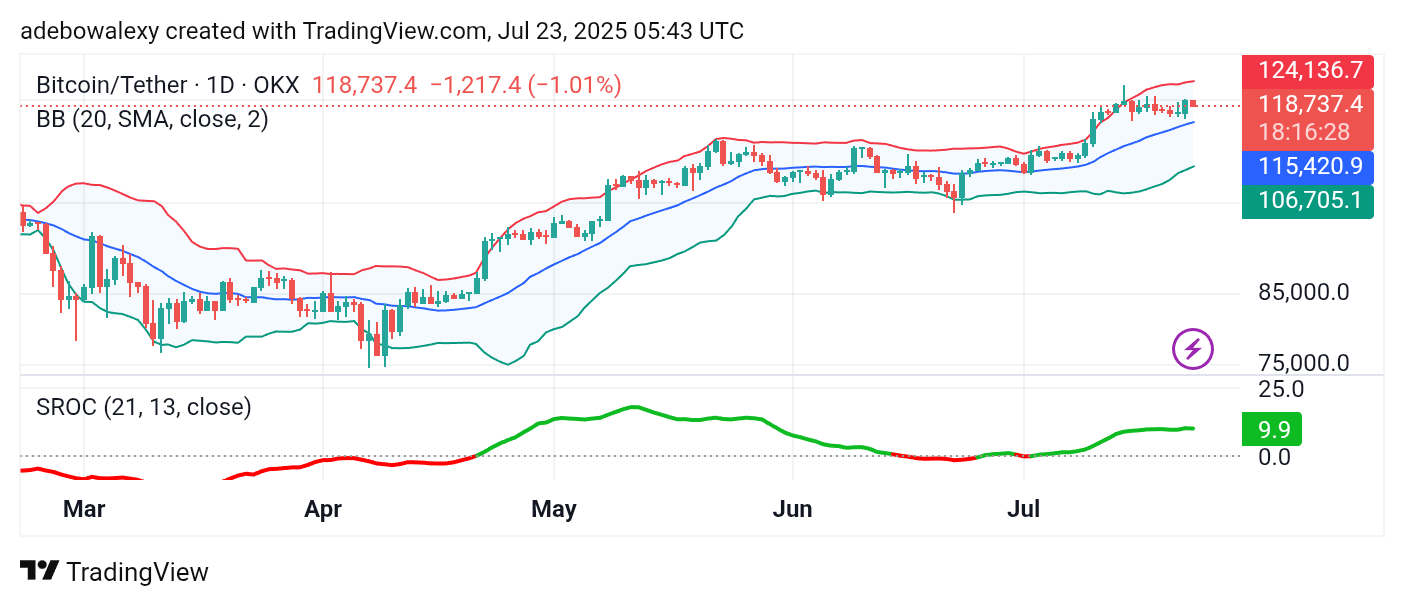
The current session in the Bitcoin market has produced a slight price dip, as indicated by the red candle on the daily chart. However, price action remains above the middle band of the Bollinger Bands (BB) indicator. Moreover, the BB indicator itself is maintaining a general upward trajectory. The Smoothed Rate of Change (SROC) indicator has also moved above the equilibrium level and has risen significantly.
Bitcoin (BTC) Price Prediction: BTC/USDT Appears Predisposed to Move Higher
Bitcoin has been trading below the $120,000 level for some time. Nonetheless, price activity continues to hold above the midline of the BB indicator.
The most recent candle on the chart reflects only a modest downward retracement, maintaining its position above the middle band. The BB indicator is angled slightly upward, suggesting that the market may be preparing for further gains. Similarly, the SROC indicator remains above the equilibrium line, supporting the view that bullish momentum is still present.
Bitcoin (BTC) Price Prediction: BTC/USDT Holds Critical Support (4-Hour Chart)
On the Bitcoin 4-hour chart, price action remains confined between the upper and middle bands of the BB indicator. The previous session saw a sharp downward move, but the current session has established support against further bearish pressure.
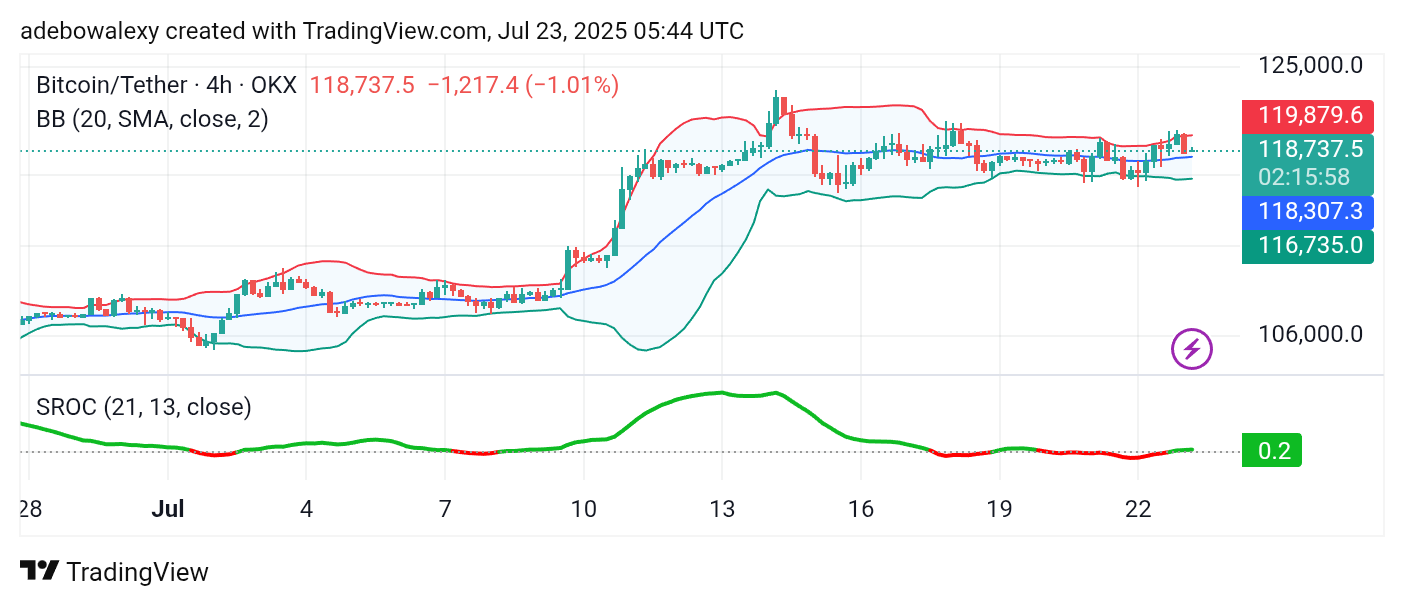
Meanwhile, the BB indicator is taking a sideways path, aligning with the trajectory of the SROC indicator. This suggests that buyers may be waiting on the sidelines for a breakout above $120,000. Should this occur, renewed buying pressure could push prices toward the $125,000 resistance level.