Bitcoin (BTC/USD) Price Undulates at $35,000
Estimated Reading Time: 3 minutes
Don’t invest unless you’re prepared to lose all the money you invest. This is a high-risk investment and you are unlikely to be protected if something goes wrong. Take 2 minutes to learn more
Bitcoin Price Prediction – July 4
Over a couple of days’ sessions, the BTC/USD price undulates around the market’s value of $35,000 until the present. The crypto’s worth now trades around the level of $35,397 at about a percentage increase rate of 2.19.
BTC/USD Market
Key Levels:
Resistance levels: $37,500, $42,500, $47,500,
Support levels: $30,000, $25,000, $20,000
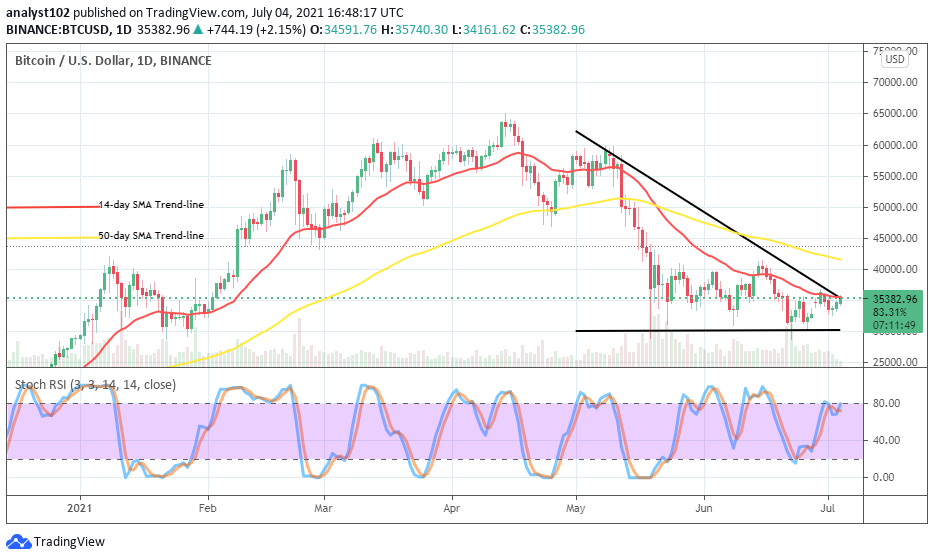
BTC/USD – Daily Chart
it shows On the BTC/USD daily chart that the crypto’s price undulates at the trading zone of $35,000. In about three days’ sessions back, there has been a formation of smaller bullish candlesticks in succession against the smaller SMA and the bearish trend line. The 50-day SMA indicator is above the 14-day SMA trend line to showcase that the crypto isn’t far from being under selling pressure. The Stochastic Oscillators are around the range of 80, trying to cross the lines further to the northbound. That signifies that an upward force is somewhat ongoing in the crypto business operations.
Could there be a breakout at the point of $35,000 now that price undulates?
A strengthening of the BTC/USD present market’s behavioral response to price forces is much needed to allow bulls to capitalize on their positions in the crypto trade now that price undulates around the level of $35,000. That said, entering more buying orders at that may not run into profit in the near time. But, in the long-term, the expectation is high that it is also one of the good zones to leave a position open to run in the longing trading situation.
On the downside, the same market’s trading level of $35,000 appears to be a crucial point, around which that bears are on a higher note of regaining the trade’s control for a bearish trend resurfacing if the current downward cycle is valid. A slight fake breakout of the point is needed to spot the reversal that could easily give a sell sign a bit over the level in question. Traders going short on this market are wary of their positions to avoid getting trapped in no time.
BTC/USD 4-hour Chart
It is being displayed on the BTC/USD medium-term chart that the main resistance level of the market lies at around the level of $36,000. The bearish trend-line drew downward to place a mark on it. The 50-day SMA indicator has joined by the 14-day SMA trend-line from underneath. The Stochastic Oscillators are in the overbought region, suggesting that the market’s catalyst to the upside has reached its peak stage. Therefore, the valuation of Bitcoin may have to go undervaluing pairing with the US Dollar at a later session.
Note: new.cryptosignals.org is not a financial advisor. Do your research before investing your funds in any financial asset or presented product or event. We are not responsible for your investing results.
You can purchase crypto coins here. Buy Tokens