Polkadot Bulls Stall Decline as It Holds above $5.98 Low
Estimated Reading Time: 2 minutes
Don’t invest unless you’re prepared to lose all the money you invest. This is a high-risk investment and you are unlikely to be protected if something goes wrong. Take 2 minutes to learn more

Free Crypto Signals Channel
Polkadot (DOT) Long-Term Analysis: Bearish
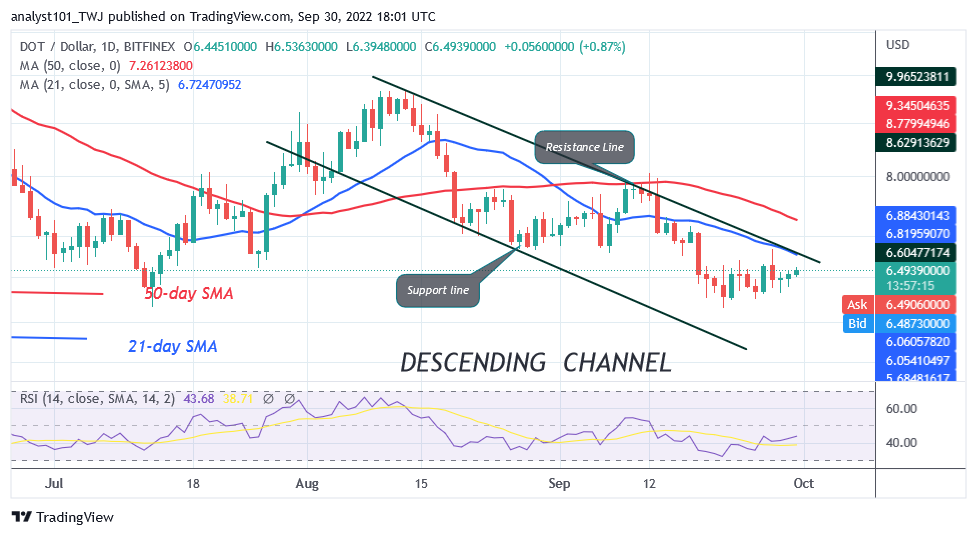
Polkadot’s (DOT) price has been in a downward move as it holds above $5.98 low. For the past week, Polkadot has been trading above the $5.98 support. It is unclear if the selling pressure will persist. Since July 13, sellers have been unable to break below the $5.98 support. Nonetheless, Polkadot will regain bullish momentum each time, it reaches the crucial support level. A break below the current support will push the altcoin to the low of $4.00. In the same vein, buyers have failed to keep the price above the moving average lines since August 19. DOT/USD has been range bound between $6.00 and $8.00 price levels.
Polkadot (DOT) Indicator Analysis
Polkadot is approaching the oversold region as it reaches level 38 of the Relative Strength Index for period 14. There is a tendency for the altcoin to further decline. The cryptocurrency is also below the 20% range of the daily stochastic. The price indicator has confirmed Polkadot as being oversold. The current selling pressure has reached bearish exhaustion.
Technical indicators:
Major Resistance Levels – $10, $12, $14
Major Support Levels – $8, $6, $4
What Is the Next Direction for Polkadot (DOT)?
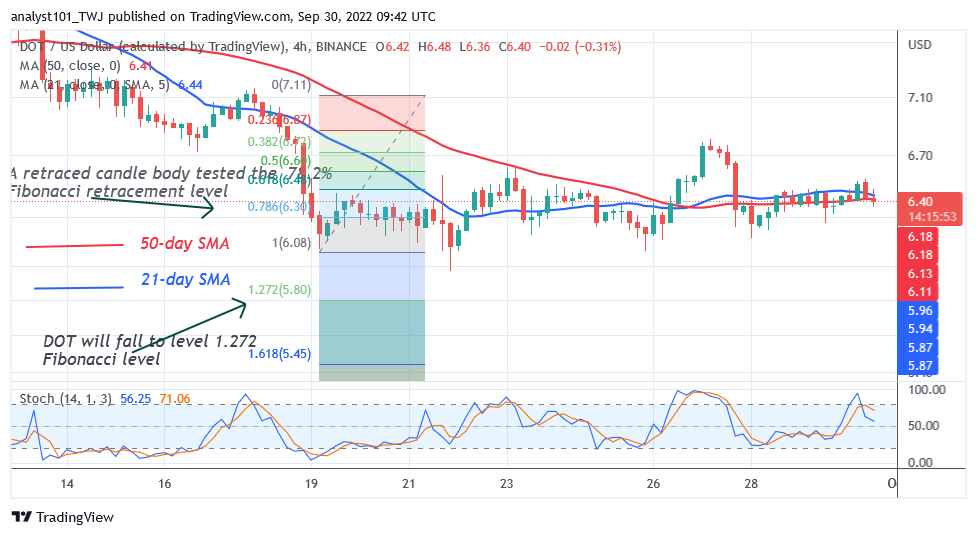
Polkadot has resumed a sideways move as it holds above $5.98 low. The price action is characterized by small body indecisive candlesticks called Doji. On the September 27 downtrend; a retraced candle body tested the 61.8% Fibonacci retracement level. The retracement suggests that DOT will fall to level 1.618 Fibonacci extension or $6.04.
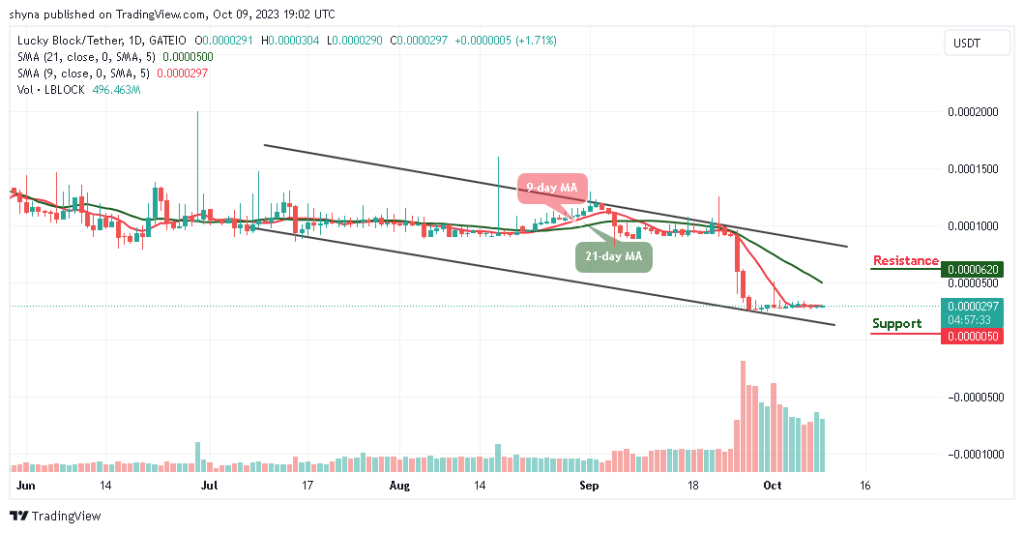
You can purchase crypto coins here. Buy LBLOCK
Note: Cryptosignals.org is not a 1a financial advisor. Do your research before investing your funds in any financial asset or presented product or event. We are not responsible for your investing result