Bitcoin Price Prediction: BTC/USD Sticks in a Tight Range Below $30k
Don’t invest unless you’re prepared to lose all the money you invest. This is a high-risk investment and you are unlikely to be protected if something goes wrong. Take 2 minutes to learn more
Bitcoin Price Prediction – August 10
The Bitcoin price prediction shows that BTC is still in a tight range as the market sentiment declines from optimistic to bearish.
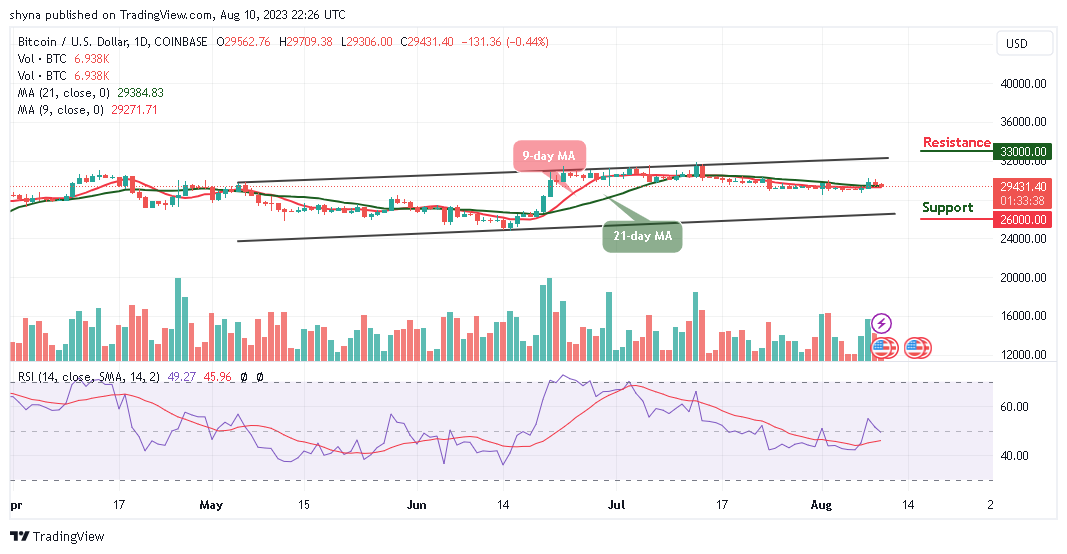
BTC/USD Long-term Trend: Ranging (Daily Chart)
Key levels:
Resistance Levels: $33,000, $34,000 $35,000
Support Levels: $26,000, $25,000, $24,000
BTC/USD is likely to face a setback if the king coin moves to cross below the 9-day and 21-day moving averages. The Bitcoin price is likely to have a bearish run in the short term as the technical indicators confirmed. Currently, Bitcoin (BTC) is trading around the $29,431 level after a free fall from $29,709 during the European session today.
Bitcoin Price Prediction: Bitcoin (BTC) May Head to the Downside
Looking at the daily chart, the Bitcoin price is moving sideways as the sellers brace for a possible impact within the market. However, if the price slumps below the support level of $29,000, the king coin is likely to gain more downtrends, any further bearish movement could locate the supports at $26,000, $25,000, and $24,000, which could cause the Bitcoin (BTC) to fall even further.
On that note, the technical indicator Relative Strength Index (14) is likely to cross below the 50-level while the trading volume could be in support of the bears. However, if the bulls decide to push the price above the 9-day moving average, BTC/USD may likely head toward the upper boundary of the channel to locate the resistance levels at $33,000, $34,000, and $35,000 respectively.
BTC/USD Medium-term Trend: Ranging (4H Chart)
On the 4-Hour chart, the Bitcoin price may cross above the 9-day and 21-day moving averages while the immediate support lies at the $29,000 level. Meanwhile, the price may cross below the lower boundary of the channel if the bears stepped back into the market.
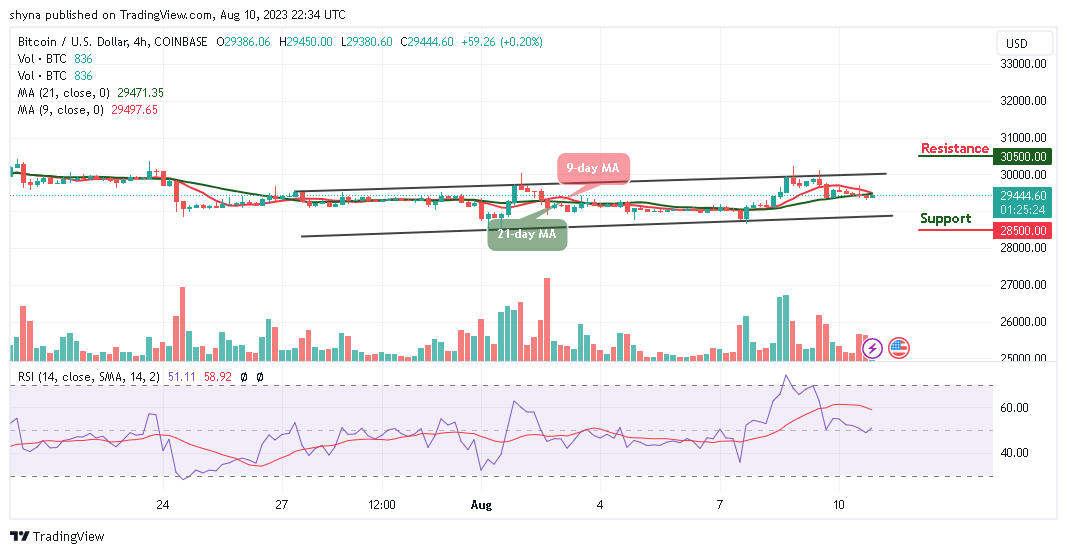
Nonetheless, any further bearish movement could test the critical support at the $28,300 level and below, while the resistance could be located above the upper boundary of the channel at the resistance level of $30,500 and above. Meanwhile, the Bitcoin price is currently moving sideways as the technical indicator Relative Strength Index (14) remains above the 50-level.
You can purchase Bitcoin here. Buy BTC