Celestia (TIA/USD) Faces Uphill Battle Past $6.00 Resistance
Estimated Reading Time: 3 minutes
Don’t invest unless you’re prepared to lose all the money you invest. This is a high-risk investment and you are unlikely to be protected if something goes wrong. Take 2 minutes to learn more

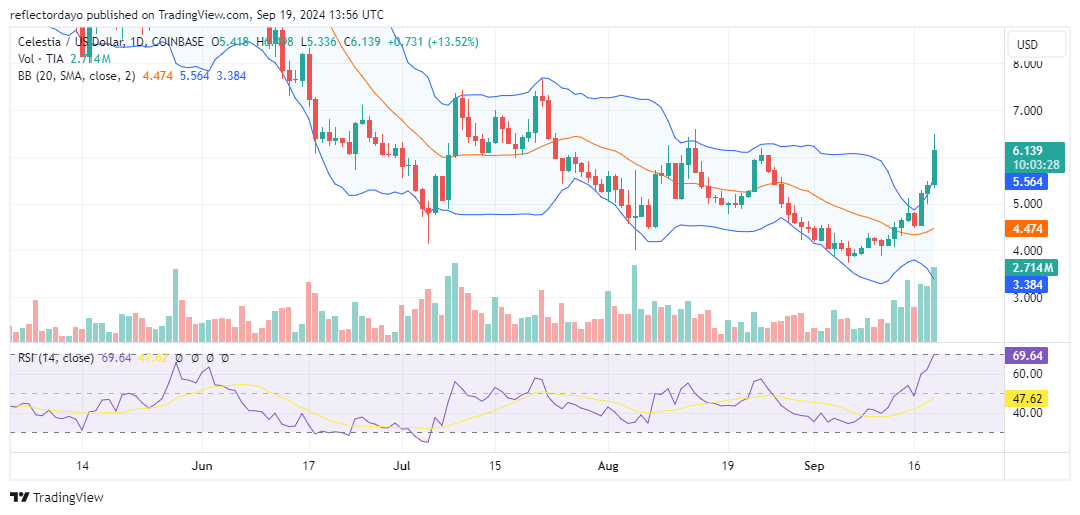
The Celestia market experienced a significant price surge today, decisively breaking through the crucial $6.00 resistance level that had been in place since late July. This long-standing resistance had consistently rejected price attempts, but the bullish candlestick formations following today’s breakthrough are highly encouraging.
Despite this major accomplishment, the market faces an uphill battle to sustain momentum above the $6.00 level. The price briefly reached $6.50 but subsequently retreated, suggesting potential challenges ahead. Further analysis of technical indicators will be essential to gauge the Celestia market’s overall direction and strength.
Celestia Market Data
- TIA/USD Price Now: $6.122
- TIA/USD Market Cap: $ 1.3 billion
- TIA/USD Circulating Supply: 212 million
- TIA/USD Total Supply: 1.1 million
- TIA/USD CoinMarketCap Ranking: #55
Key Levels
- Resistance: $6.50, $7.00, and $7.50
- Support: $4.50, $4.00, and $3.50.
Celestia Market Through the Lens of Indicators
Today’s candlestick chart features a substantial upper shadow, indicating a significant bearish correction from the intraday high of $6.50. While this may crypto signal initially raise concerns, the volume indicator provides a glimmer of hope for continued bullish momentum. The substantial volume histogram suggests strong investor interest, supporting the ongoing uptrend.
Regarding the Bollinger Bands, their divergence signals increased volatility, which could explain the sharp pullback from the $6.50 peak. If the market can successfully defend the current support level, it would likely trigger a renewed burst of bullish sentiment and optimism, as the resistance has been in place for an extended period.
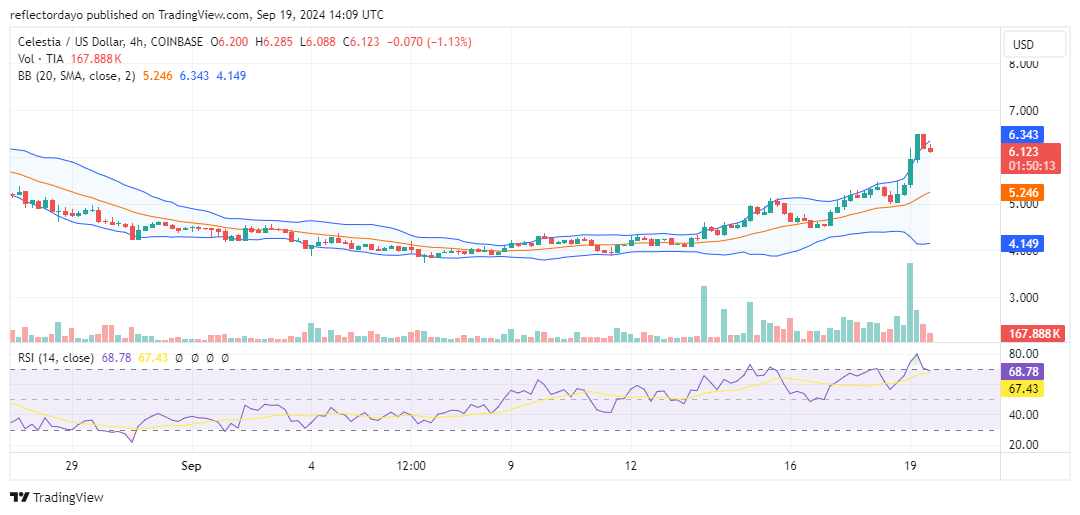
TIA/USD Price Prediction: 4-Hour Chart Analysis
The overall market trend remains upward, characterized by higher highs and higher lows until the recent breakthrough of the $6.00 resistance level. Following a peak at $6.50, the market has entered a corrective phase.
The current 4-hour chart shows a shooting star candlestick formation, suggesting potential bearish pressure. However, as the market approaches the $6.00 support level, its downward momentum appears to be slowing. While some investors may be taking profits after the recent peak, the strong volume indicator suggests that others may be preparing to enter long positions.
The market’s ability to hold above the $6.00 level will be crucial in determining whether the overall uptrend remains intact.