Dogecoin (DOGE/USD) Begins Building Bullish Momentum
Estimated Reading Time: 3 minutes
Don’t invest unless you’re prepared to lose all the money you invest. This is a high-risk investment and you are unlikely to be protected if something goes wrong. Take 2 minutes to learn more

Dogecoin has stabilized around the $0.22 price level, a range it has maintained since August. The market has been consolidating within this horizontal zone, with demand and supply pressures appearing evenly matched as the price continues to swing within the range.
Notably, recent trading sessions have shown a decline in volatility, with price action settling more firmly around the $0.22 level. This consolidation suggests that the market may be preparing for its next significant move, potentially setting the stage for renewed bullish momentum.
Dogecoin (DOGE/USD) Market Data
DOGE/USD Price Now: $0.238
DOGE/USD Market Cap: $36 billion
DOGE/USD Circulating Supply: 151 billion DOGE
DOGE/USD Total Supply: 151 billion DOGE
DOGE/USD CoinMarketCap Ranking: #8
Key Levels
Resistance: $0.30, $0.35, and $0.40
Support: $0.20, $0.15, and $0.10
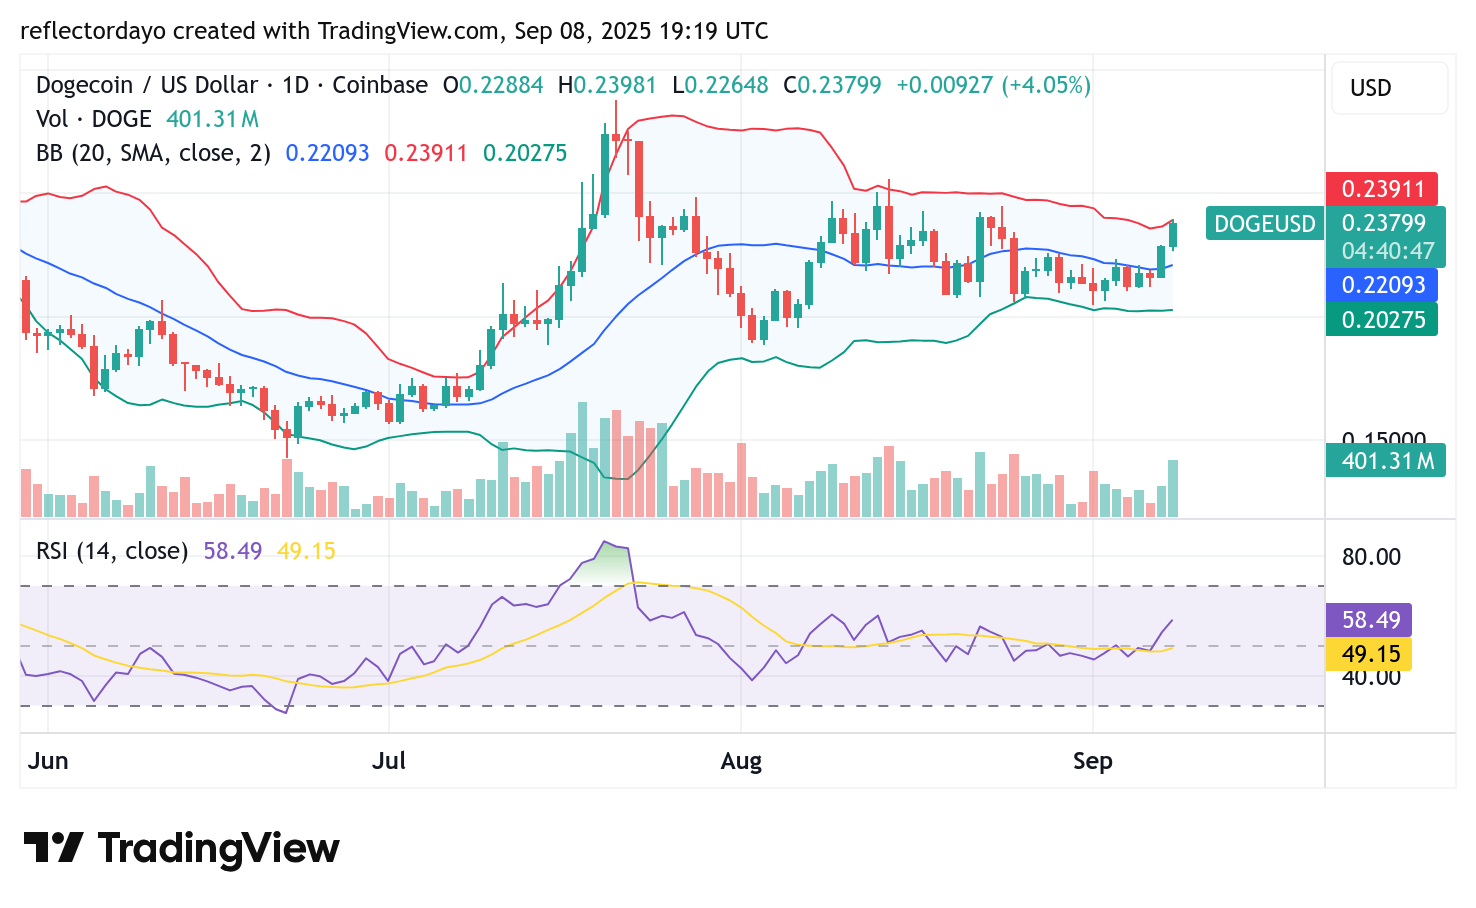
Dogecoin (DOGE/USD) Daily Chart Outlook
Today’s trading activity has been notably bullish, reflected in a strong candlestick that highlights the dominance of Dogecoin buyers in the session. The momentum is further reinforced by a substantial histogram reading, signaling robust bullish strength.
However, the Bollinger Bands show limited expansion despite the rally, suggesting that traders may be cautious as the price approaches a key resistance level near $0.24. This zone could act as a potential barrier to further gains.
Market participants are likely monitoring the next trading session closely, as it may determine whether bullish momentum continues and if Dogecoin can sustain a breakout above resistance.
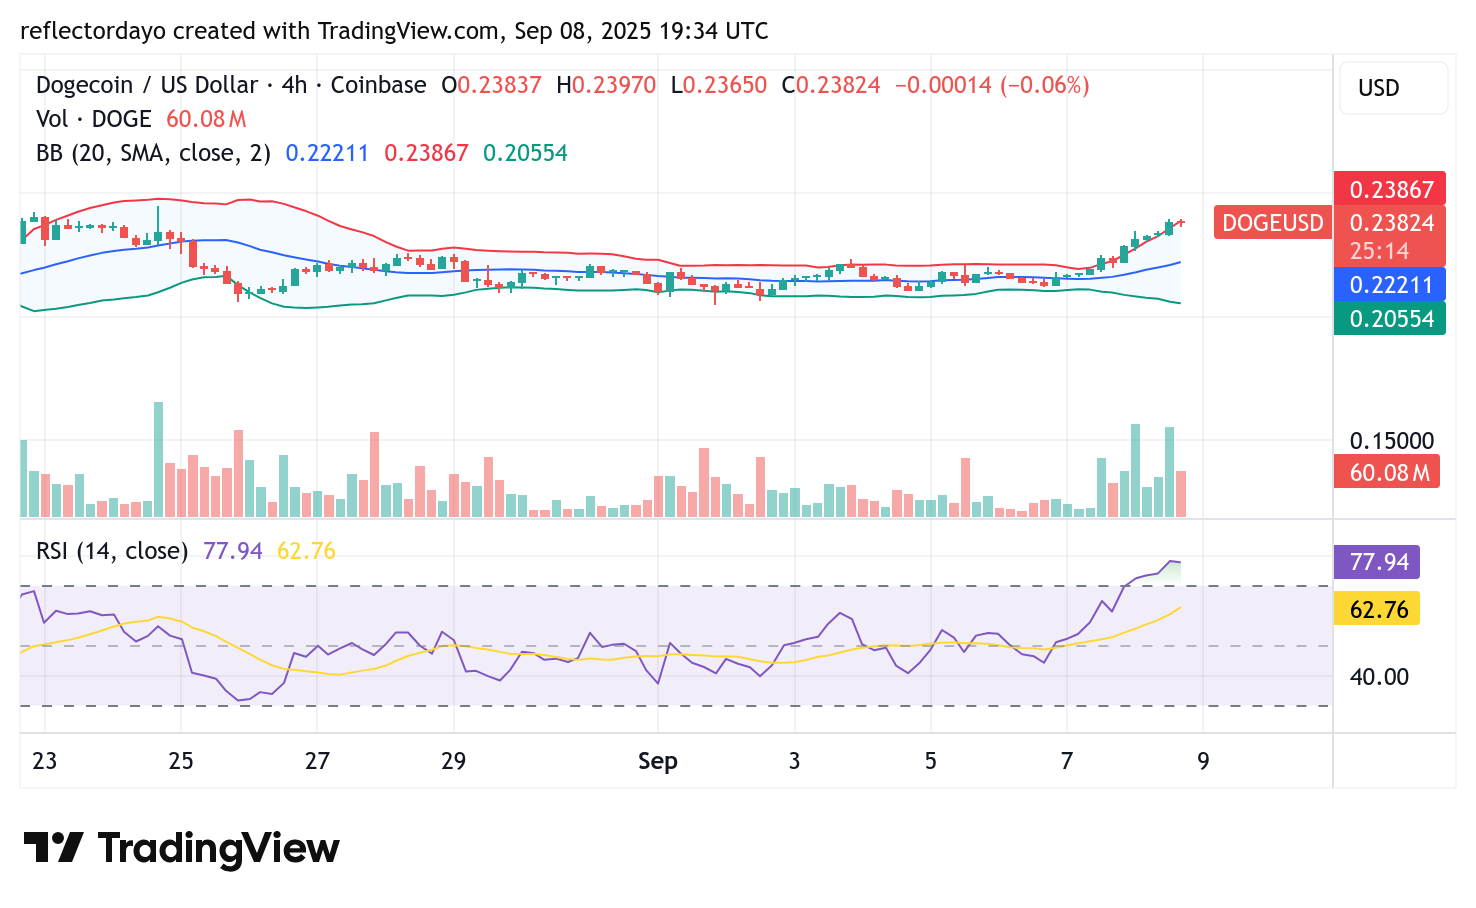
DOGE/USD 4-Hour Chart Analysis
From the 4-hour chart perspective, Dogecoin has continued its upward movement, aligning with the bullish sentiment observed in the daily chart outlook. The price action reflects a consistent uptrend, supported by rising trading volume, which reinforces market confidence.
However, caution is warranted as the Relative Strength Index (RSI) now signals overbought conditions. The appearance of a doji candlestick at the peak of the current rally further suggests potential indecision, indicating that the market may be preparing for a correction.
In the event of a pullback, the $0.22 price level could serve as a key support zone and may provide an opportunity for traders to re-enter bullish positions.