dogwifhat (WIF/USD) Finds Strong Support, Signaling a Potential Trend Reversal
Estimated Reading Time: 3 minutes
Don’t invest unless you’re prepared to lose all the money you invest. This is a high-risk investment and you are unlikely to be protected if something goes wrong. Take 2 minutes to learn more

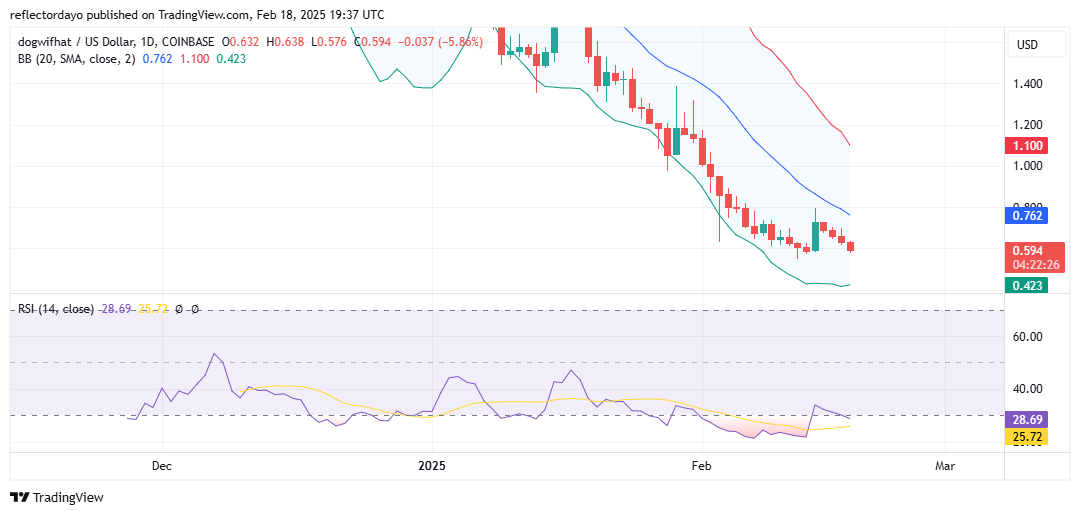
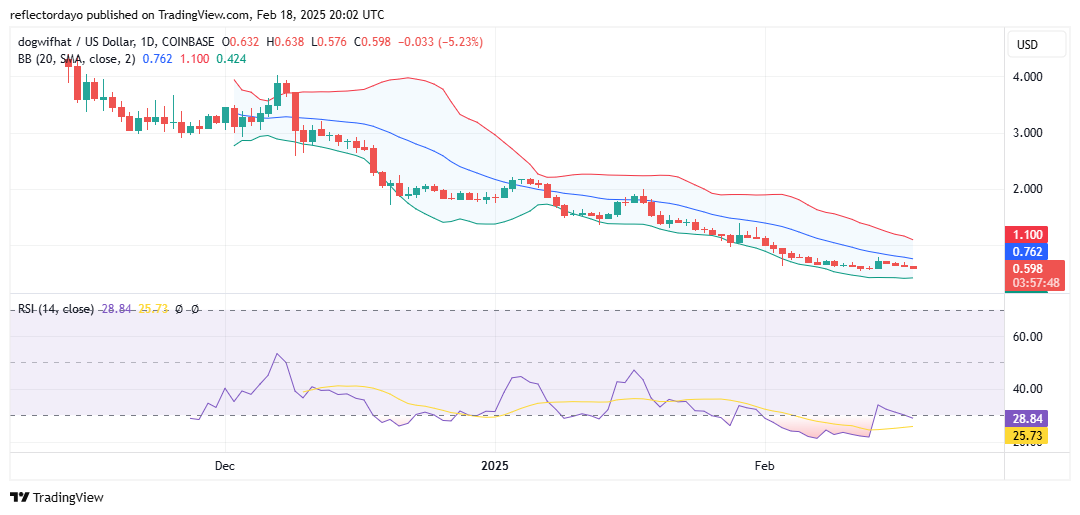
Since December of last year, the dogwifhat (WIF) market has been under persistent bearish pressure following a period of strong bullish momentum. According to technical indicators, the downtrend began around the $4.40 price level, with consistent lower highs and lower lows forming since then.
Initially, it was anticipated that bulls would defend the $1.00 support level and trigger a reversal. However, bearish dominance remained strong, leading to a continuous sell-off that easily pushed the price below this key level. Despite this, buying interest appears to be emerging around the $0.60 price level, suggesting that bulls may be attempting to regain control.
Dogwifhat experienced a phase of explosive upward volatility upon its launch, but the current trend indicates that many traders are now offloading their positions, contributing to the ongoing decline.
dogwifhat Market Data
- WIF/USD Price Now: $0.59
- WIF/USD Market Cap: $ 594 million
- WIF/USD Circulating Supply: 998.8 WIF
- WIF/USD Total Supply: 998.8 WIF
- WIF/USD CoinMarketCap Ranking: #104
Key Levels
- Resistance: $0.70, $0.80, and $0.90
- Support: $0.55, $0.50, and $0.45.
The dogwifhat Market Through the Lens of Indicators
The ongoing bearish trend in the Dogwifhat (WIF/USD) market has been significant, driving substantial downward volatility. If bulls can establish a strong support level, the market could see a sharp upward correction.
However, despite earlier expectations of continued selling pressure, the bearish momentum appears to be weakening after the price dropped below the $0.80 level. With selling pressure diminishing and repeated rejections of lower prices around the $0.60 support level, there is a possibility that the market may consolidate around this zone before attempting a rebound.
If this consolidation phase in the crypto signal extends, market volatility could decline, potentially leading to a volatility squeeze—a pattern that often precedes a significant price move. Additionally, the Relative Strength Index (RSI) is currently in the oversold region, reinforcing the likelihood of a bullish reversal as traders begin to anticipate a rebound.
WIF/USD Price Prediction: 4-Hour Chart Analysis
A closer look at the 4-hour chart reveals that the $0.60 support level has been holding for some time. Bulls are actively defending this key level, though bearish pressure remains present, creating indecision among traders and causing minimal price fluctuations.
This period of price consolidation could strengthen the $0.60 support level, potentially establishing it as a solid base for a bullish rebound. If a breakout occurs, the next bullish run may target the $1.00 level as a key resistance point.