Liverpeer (LPT/USD) Resumes the Bullish Run After a Strong Pullback
Estimated Reading Time: 3 minutes
Don’t invest unless you’re prepared to lose all the money you invest. This is a high-risk investment and you are unlikely to be protected if something goes wrong. Take 2 minutes to learn more
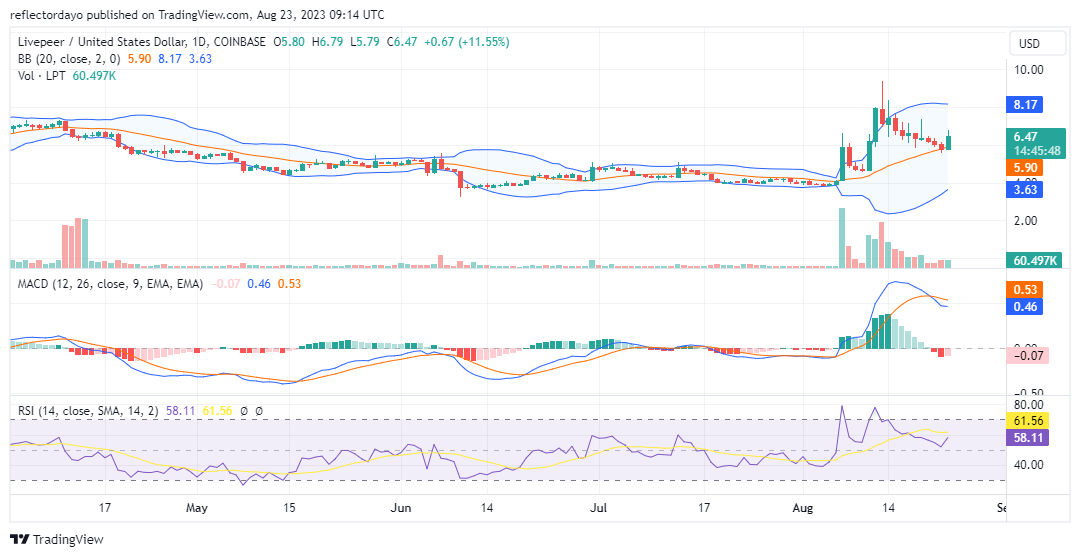
From August 11 to August 13, the Livepeer market experienced a robust bull market, leading to a remarkable surge in price from $4.64 to $9.44. There was a notable apprehension that this intense bullish momentum might elicit a substantial bearish reaction, potentially initiating a new bear cycle. As anticipated, the retracement proved significant; however, at the $5.80 demand level, the market appears to be undergoing a turnaround and may soon resume the upward movement, setting its sights back on the $9.44 target.
Livepeer Market Data
- LPT/USD Price Now: $6.47
- LPT/USD Market Cap: $185,942,108
- LPT/USD Circulating Supply: 28,786,698 LPT
- LPT/USD Total Supply: 28,786,698 LPT
- LPT/USD CoinMarketCap Ranking: #131
Key Levels
- Resistance: $8.00, $8.50, and $9.00
- Support: $5.00, $4.50, and $4.00.
Price Prediction for Livepeer: The Market to Resume Movement in Upward Direction
The potent yet brief bullish surge witnessed from August 11 to August 13 has markedly heightened market volatility, rendering both the demand and supply facets notably formidable. This heightened volatility has been visually depicted by the expansiveness of the Bollinger Bands indicator. Nonetheless, as the Livepeer market established a pivotal juncture at the $5.80 support level with which it will resume its upward movement, the reduced standard deviation curve sought to narrow the gap between itself and the upper standard deviation. This shift implies that liquidity within the bull market is now outweighing that within the bear market.
With the waning of volatility coinciding with the ascendancy of the bulls, there exists a window of opportunity for the bulls to rally the market towards the $9.44 mark. However, a principal concern arises from the volume of trade, as indicated by the volume of trade indicator on the chart. This indicator did not display a height sufficient to align with the candlestick representing today’s trading activities. This raises the alternate possibility that the market might consolidate around the current level.
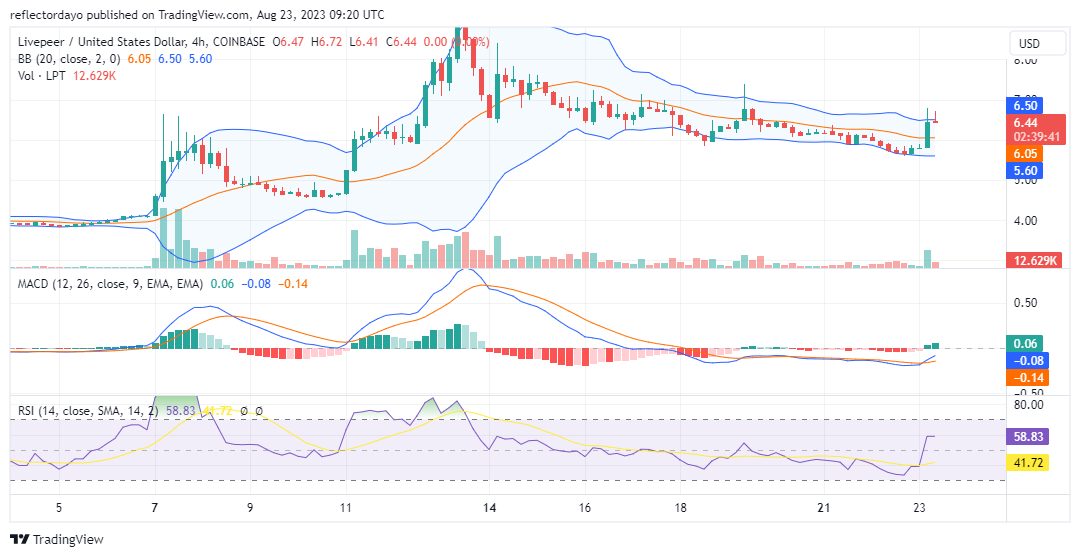
LPT/USD 4-Hour Chart Outlook
Examining the 4-hour chart perspective, we could identify a potential explanation for the divergence observed on the daily chart. This divergence might stem from the simultaneous downward shift of supply levels by bears and the upward shift of demand levels by bulls. This dual movement could potentially lead to a consolidation phase as the equilibrium between demand and supply is achieved thereby impede the bullish price from resuming.
The presence of the gravestone doji implies a congregation of sellers around the $6.52 price level, aiming to establish a resistance barrier against the ongoing bullish momentum. If the bull market manages to breach this resistance, it could potentially pave the way for a brief pause around the $7.00 price level.