$SPONGE (SPONGE/USD) Gears Up for Potential Upside Breakout
Estimated Reading Time: 3 minutes
Don’t invest unless you’re prepared to lose all the money you invest. This is a high-risk investment and you are unlikely to be protected if something goes wrong. Take 2 minutes to learn more

The SPONGE/USD market continues to consolidate just above the $0.000101 level, following a recent rebound from the psychological support at $0.000100. This steady price behavior signals a temporary pause in momentum, but not without the potential for renewed upward movement.
Despite the current sideways action, the market structure suggests that bulls are quietly positioning for a possible bounce. If buying pressure intensifies, the next logical target for SPONGE/USD could be the $0.000115 resistance zone.
Traders should keep a close watch on volume and breakout signals, as a decisive move above the current range could pave the way for a fresh bullish push.
Key Technical Levels in Focus
- Resistance Levels: $0.000115, $0.000120, $0.000130
- Support Levels: $0.000100, $0.000090, $0.000085
SPONGE/USD Daily Chart Outlook: Signs of Accumulation as Market Cools
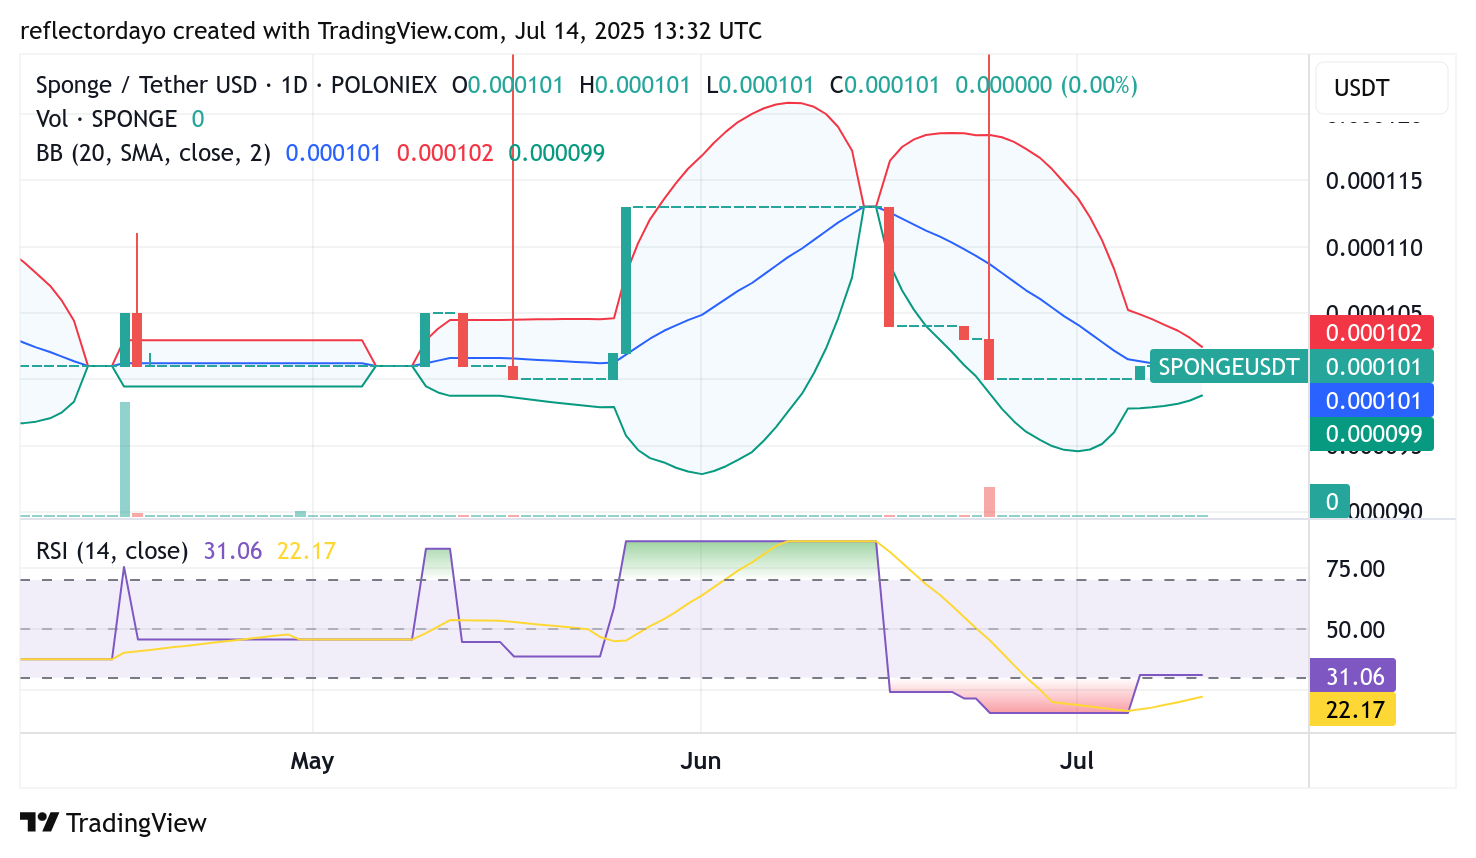
The SPONGE/USD market has experienced heightened volatility in recent sessions, but price action has now stabilized around the key $0.0001 level. Since reaching this threshold, the market appears to be cooling off, with early signs of accumulation beginning to surface.
The narrowing of the Bollinger Bands suggests a decline in volatility, often a precursor to a significant price move. Additionally, the Relative Strength Index (RSI) is hovering near the oversold region, further indicating that the market may be poised for a bullish reversal.
One notable observation is the market’s consistent behavior between established support and resistance zones. This steady price range strengthens the likelihood of an upward bounce, potentially targeting higher resistance levels in the near term.
$SPONGE 4-Hour Chart Snapshot: Decision Point Near
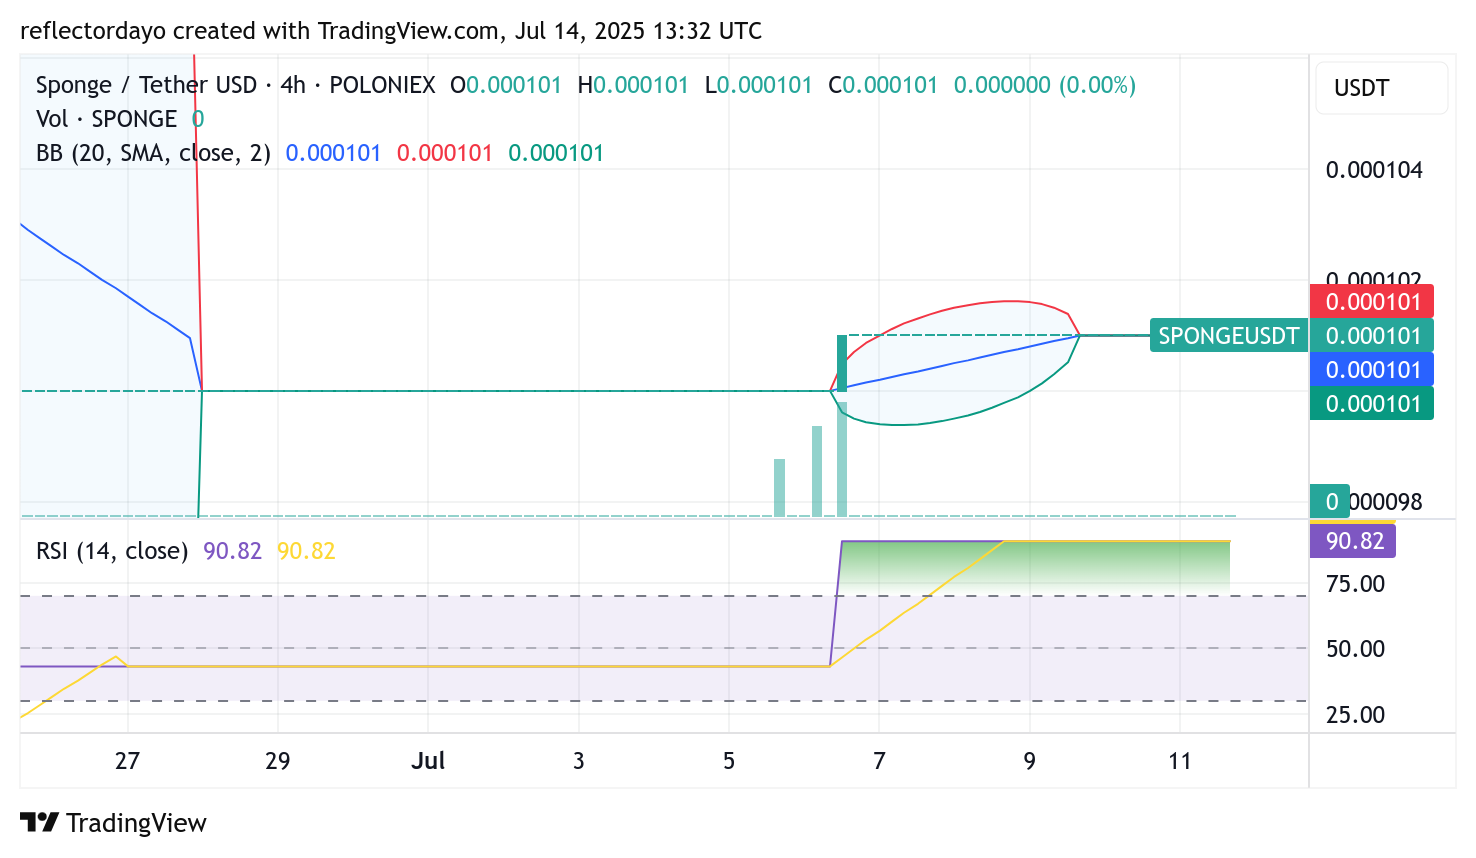
On the 1-hour chart, price action remains tightly compressed around the $0.000101 level, forming a narrow trading range that reflects growing tension in the market. Occasional surges in trading volume point to increased activity and interest from market participants. This kind of price consolidation often precedes a breakout.
If bullish momentum holds above this key level, an upward push toward nearby resistance zones could unfold rapidly. However, if buyers lose grip, the market may retreat toward the $0.000090 support area, where the next test of demand could emerge.
The coming sessions could be crucial, as volume and price action are expected to offer clues on the next directional move.
Buy $SPONGE!
That one friend who still believes alt season is coming pic.twitter.com/AWBUMnYwPb
— $SPONGE (@spongeoneth) July 8, 2025
Join the SPONGE community and get in on the next big crypto opportunity! Buy Sponge ($SPONGE) today