$SPONGE (SPONGE/USD) Holds Above the 0.000065 Price Level
Estimated Reading Time: 2 minutes
Don’t invest unless you’re prepared to lose all the money you invest. This is a high-risk investment and you are unlikely to be protected if something goes wrong. Take 2 minutes to learn more

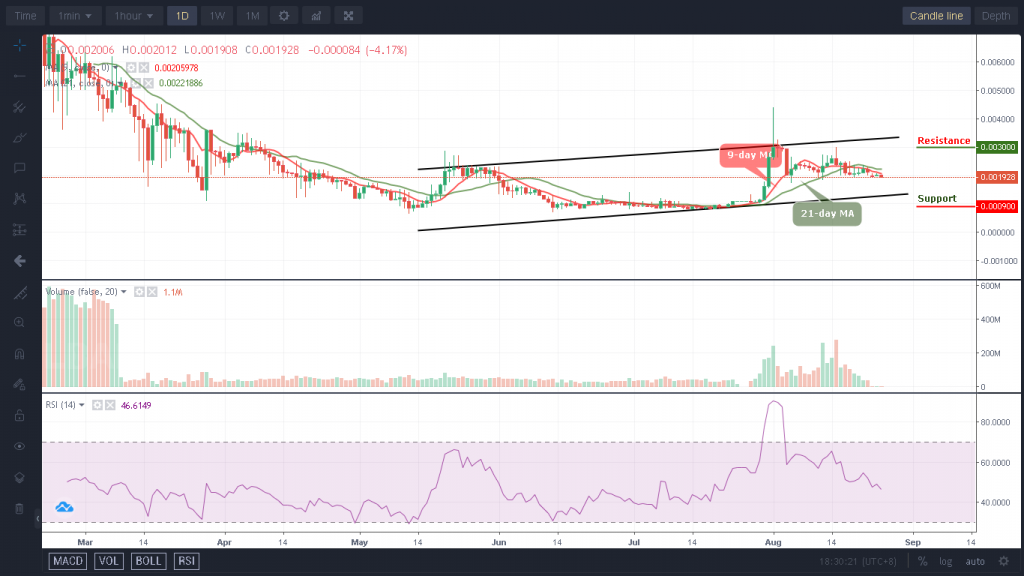
Our previous $SPONGE analysis highlighted the gradual climb from $0.00006 to $0.000065. Currently, the price holds steady above this level, which has transitioned from resistance to support. While bulls face some continued bearish pressure at this level, a sustained hold could weaken bearish sentiment.
Key Market Dynamics:
- Resistance Levels: $0.0010, $0.0011, and $0.0012.
- Support Levels: $0.000035, $0.000030, and $0.000025.

In-Depth Technical Analysis for $SPONGE (SPONGE/USD)
The Relative Strength Index (RSI) reflects some volatility, oscillating around the 50 level with a bias towards upside swings. This crypto signal suggests potential $SPONGE bullish dominance. However, the current RSI reading of 59.5 indicates neither bulls nor bears are in complete control. A breakout from the consolidation around $0.000065 will likely determine the market’s future direction.

Insights from the 1-Hour Perspective
A 1-hour chart reveals a heated battle between buyers and sellers. Currently, buyers are defending the $0.000065 support level, preventing a price drop. Maintaining this level and the 20-day moving average would indicate continued bullish dominance. As previously mentioned, a breakout from this consolidation phase will likely determine the market’s future direction, with a potential upside bias.
The SPONGE/USD market is hot; buy the market and absolve the damp.
🧽 $SPONGE to the top🔝🪙#SpongeV2 #AltSeason #BullMarket pic.twitter.com/nTzGV1yYNx
— $SPONGE (@spongeoneth) March 10, 2024
Invest in the hottest and best meme coin. Buy Sponge ($SPONGE) today!