Sponge (SPONGE/USD) May Rally From $0.0002619; Buy the Dip!
Estimated Reading Time: 2 minutes
Don’t invest unless you’re prepared to lose all the money you invest. This is a high-risk investment and you are unlikely to be protected if something goes wrong. Take 2 minutes to learn more
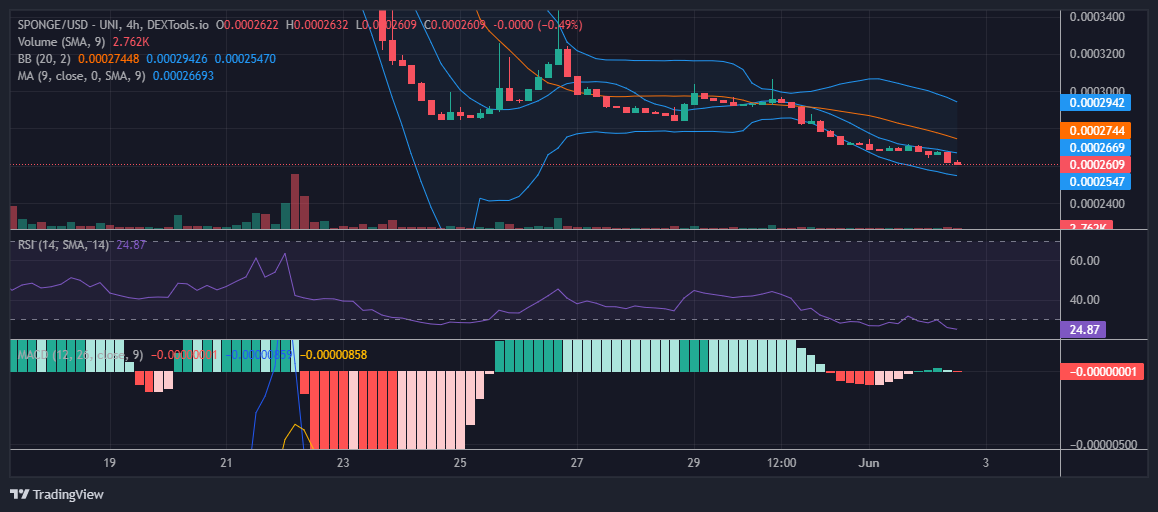
The SPONGE/USD market has endured strong bearish pressure at the $0.0002684 support price level. Buyers were trying to contain the effect of the bearish price breakout that issued from the $0.0002942 price level on May 30, at the $0.0002684 support price level. The market had gone flat around this level for the past 2 days as the faceoff intensified. The demand line finally succumbs to the bearish motion in the third session.
Key Levels
- Resistance: $0.00035, $0.00040, and $0.00045
- Support: $0.00025, $0.00020, and $0.00019
SPONGE/USD ($SPONGE) Price Analysis: The Indicators’ Point of View
The SPONGE/USD bulls were able to hinder the bearish motion at a very slightly lower price level, which is $0.0002611. The market at this level has a higher likelihood of a reversal because, according to the Relative Strength Index (RSI), it is moving in the oversold region. This is the point at which traders usually place long trades. The market is expected to rally from this level.
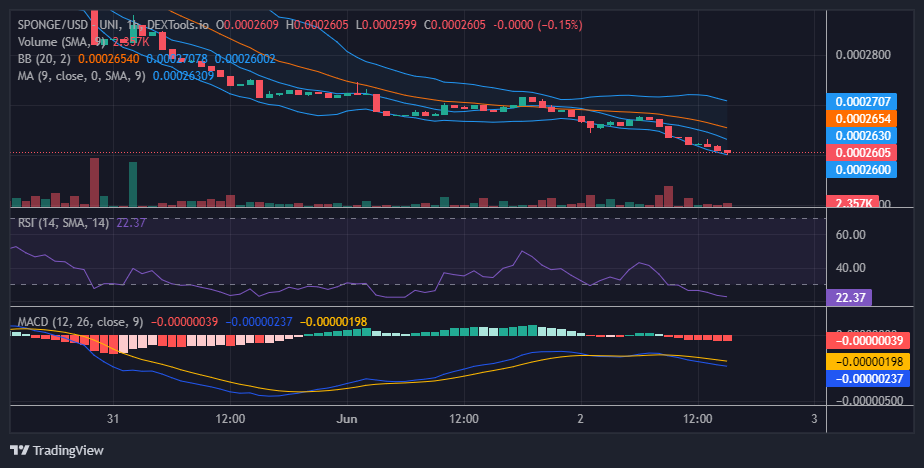
Sponge Short-Term Outlook: 1-Hour Chart
Since May 30, according to the Relative Strength Index (RSI), the market has continued to range sideways along with the oversold threshold level. The bearish trend was not strong due to the presence of bulls in the market. The Sponge bull market is, however, gaining strength at the $0.0002618 price level to turn the tide of the market.
Sponge Coin is hot; grab yours now!
$SPONGE taking over the #MemeCoin world! 🧽🌎🚀 pic.twitter.com/aZg7dVKhrZ
— $SPONGE (@spongeoneth) June 2, 2023
Invest in the hottest and best meme coin. Buy SpongeBob ($SPONGE) today!