$SPONGE (SPONGE/USD) Still Stalled at $0.00005: Can Bulls Muster Uplift?
Estimated Reading Time: 2 minutes
Don’t invest unless you’re prepared to lose all the money you invest. This is a high-risk investment and you are unlikely to be protected if something goes wrong. Take 2 minutes to learn more

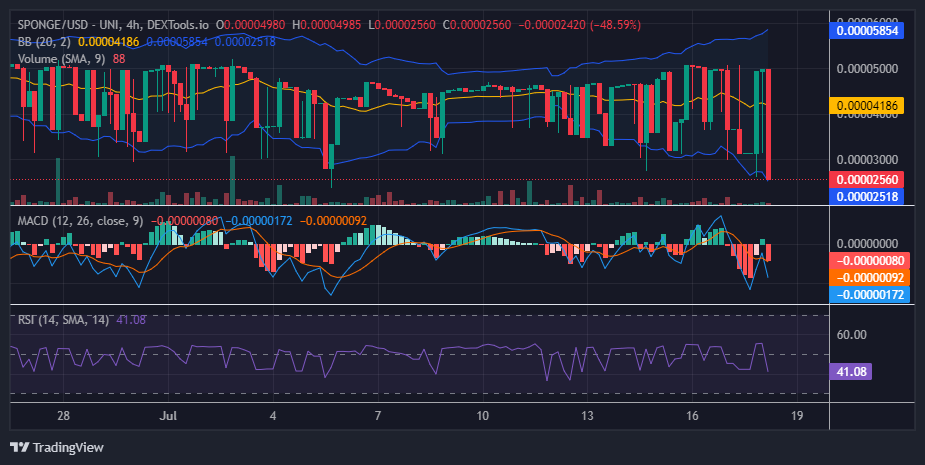
The SPONGE/USD market is embroiled in a persistent battle within the price channel of $0.00005 to $0.000025. After struggling at the $0.00005 level for a while, the price action was rejected and fell below $0.00003. This rejection caused the bulls to lose their grip on the crucial $0.00004 level, which was essential for breaking above $0.000045. Currently, the bulls are regrouping around the $0.000025 level.
Key Market Dynamics:
- Resistance Levels: $0.0010, $0.0011, and $0.0012
- Support Levels: $0.000035, $0.000030, and $0.000025
$SPONGE (SPONGE/USD) Technical Outlook
Historically, the $0.00004 level has been a turning point. It was like a launching pad for bulls to conquer the $0.000045 resistance. However, things have gotten a bit more chaotic lately. The Bollinger Bands are widening, indicating increased volatility. This turbulence is hurting the bulls more than the bears. While the bears are holding their ground at $0.00005, the bulls are struggling to find their footing at $0.00004.
Despite the setbacks, there’s a flicker of bullish defiance. This significant price drop might tempt some traders to “buy the dip,” potentially sparking a rebound.
$SPONGE 1-Hour Chart Insights
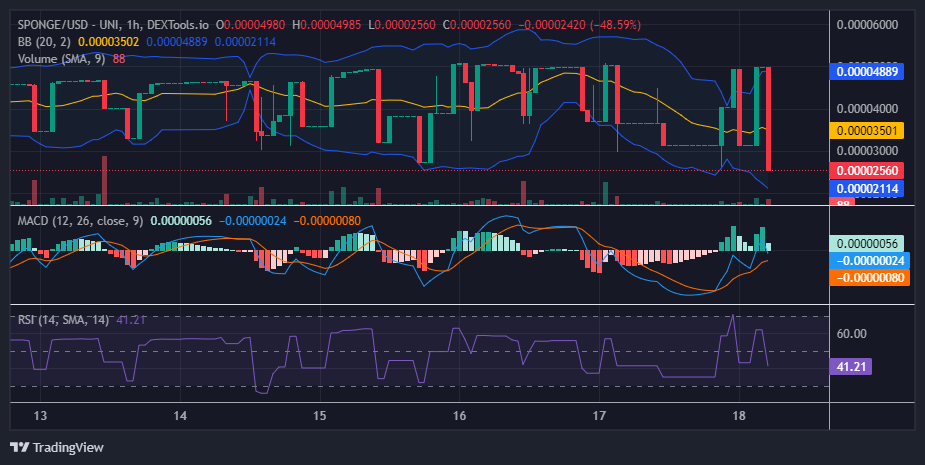
The 1-hour chart reflects the volatility mirrored by the Bollinger Bands. Take a peek at that prominent bearish marubozu candlestick and the fading green histogram on the MACD indicator. Notice the inconsistencies of the crypto signal – smaller green bars next to taller, healthier ones? That’s volatility personified.
Entering this market might feel like navigating a storm. But here’s a ray of hope: historically, SPONGE/USD tends to bounce back in this price range. While the current volatility might cause some wild swings, there’s a chance for a rally.
Buy $SPONGE!
Real recognises real 💦 $SPONGE pic.twitter.com/Ru8zdE0QfD
— $SPONGE (@spongeoneth) July 18, 2024