SPONGE/USD ($SPONGE) Bounces Back at June 15’s Demand Level
Estimated Reading Time: 2 minutes
Don’t invest unless you’re prepared to lose all the money you invest. This is a high-risk investment and you are unlikely to be protected if something goes wrong. Take 2 minutes to learn more
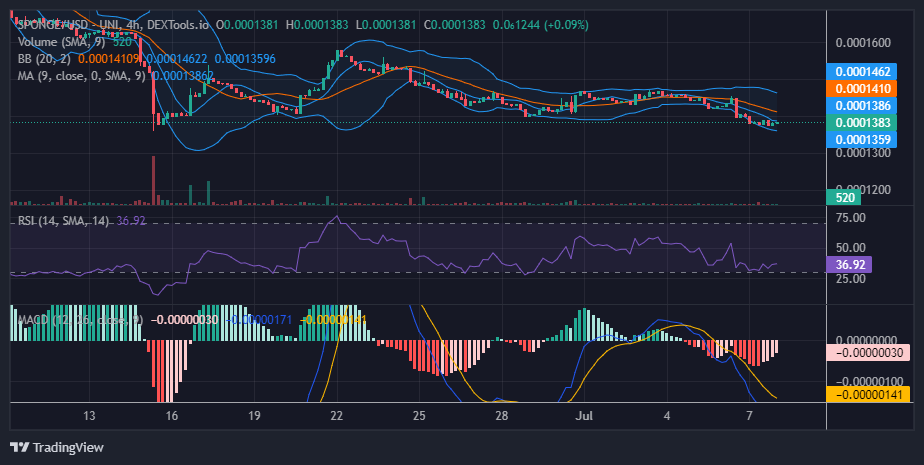
In the $SPONGE market, the bulls have demonstrated resilience by holding their position against bearish pressure at the $0.00014 support level since June 16. From this level, the market reached a high of $0.0001581, which triggered the bearish momentum. However, the market managed to remain strong and retained the $0.00014 demand level.
Key Levels
- Resistance: $0.0004, $0.0045, and $0.0005.
- Support: $0.00013, $0.00012, and $0.00011
SPONGE/USD ($SPONGE) Price Analysis: The Indicators’ Point of View
On July 7, the $SPONGE bulls lost their grip on the $0.00014 support level, and they are currently regrouping around the June 15 price level of $0.0001375. This level has now become an important area for potential support.
Looking at the Relative Strength Index (RSI), the $SPONGE market is currently in the lower section of the indicator, measuring momentum at 36.9. This suggests that the market has weakened in terms of momentum but is not yet oversold. Traders should monitor the RSI for potential shifts in sentiment.
Additionally, the Moving Average Convergence and Divergence (MACD) indicator shows faded red histograms, indicating fading bearish momentum. This suggests a potential weakening of selling pressure, although it does not provide a clear signal for a bullish reversal.
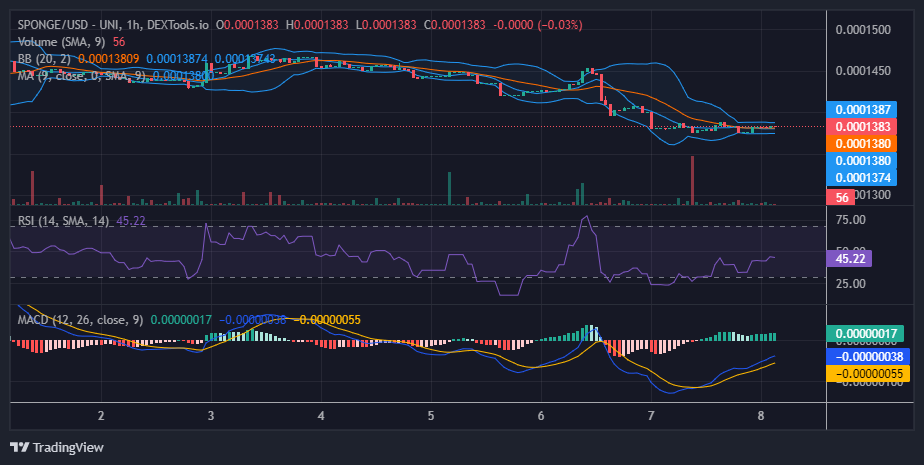
SPONGE/USD Short-Term Outlook: 1-Hour Chart
On a 1-hour timeframe, the volatility level has fallen significantly, resulting in consolidation. This trend suggests a potential buildup of energy for a significant price movement. Currently, the bulls are catching up with the bears as they have trapped the selling pressure in the consolidation trend while they prepare to overrun the $SPONGE market.
Do you have any interest in Bitcoin?
Would you be interested in #Bitcoin? 🤑💰🤣 pic.twitter.com/nmrkUc5j7U
— $SPONGE (@spongeoneth) July 7, 2023
Invest in the hottest and best meme coin. Buy Sponge ($SPONGE) today!