SPONGE/USD ($SPONGE) Consolidates Around $0.0001374, Ahead of a Bounce
Estimated Reading Time: 2 minutes
Don’t invest unless you’re prepared to lose all the money you invest. This is a high-risk investment and you are unlikely to be protected if something goes wrong. Take 2 minutes to learn more
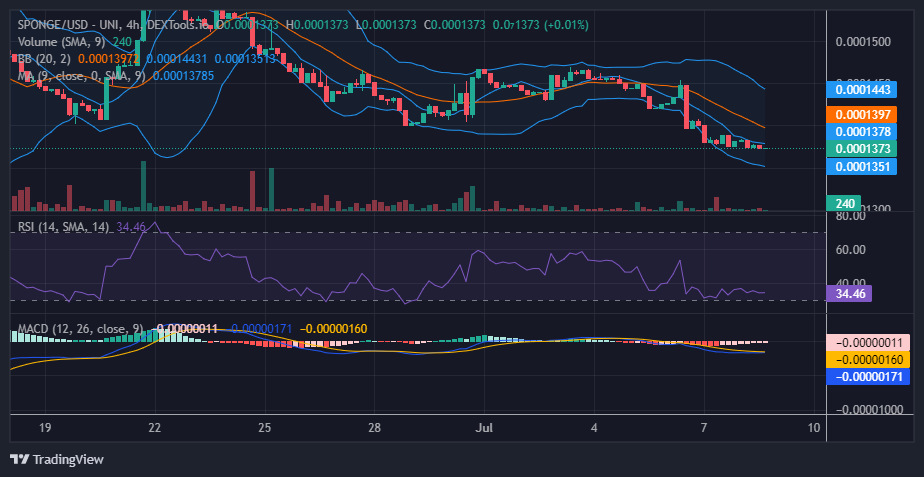
The bulls have shown tenacity in the SPONGE/USD market by resisting negative pressure at the $0.00014 support level since mid-June. After rising to a high of $0.0001581, the bear market was triggered too soon, putting more pressure on the demand level. The bulls were forced to find another lower base at $0.0001373.
Key Levels
- Resistance: $0.0004, $0.0045, and $0.0005.
- Support: $0.00013, $0.00012, and $0.00011
Sponge (SPONGE/USD) Price Analysis: The Indicators’ Point of View
The SPONGE/USD market is currently in the lower portion of the Relative Strength Index (RSI), with a momentum reading of 34.46. This implies that the market’s momentum has decreased but that it is not yet oversold. Investors should keep an eye on the RSI for possible mood changes.
The Moving Average Convergence and Divergence (MACD) indicator is pointing to a possible bullish breakout from this new demand level as the negative histograms are now appearing in faded red with a reduction in height and the readiness to cross into the positive side of the indicator.
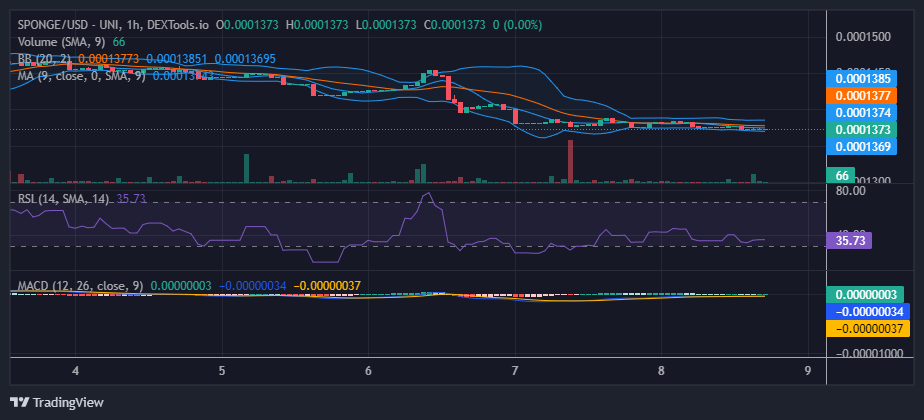
Sponge Short-Term Outlook: 1-Hour Chart
The volatility level has dramatically decreased over a 1-hour time frame, causing consolidation. This pattern shows that the momentum for a large price movement may be building as the market moves along within a very narrow price channel. The selling pressure was contained in the consolidation trend, and the bulls are now catching up with the bears as they get ready to take over the market.
Bitcoin is money for smart people.
Would you be interested in #Bitcoin? 🤑💰🤣 pic.twitter.com/nmrkUc5j7U
— $SPONGE (@spongeoneth) July 7, 2023
Invest in the hottest and best meme coin. Buy Sponge ($SPONGE) today!