The Sei Market (SEI/USD) Powers Higher: Bullish Momentum Builds Amid Strong Investor Demand
Estimated Reading Time: 3 minutes
Don’t invest unless you’re prepared to lose all the money you invest. This is a high-risk investment and you are unlikely to be protected if something goes wrong. Take 2 minutes to learn more

The Sei (SEI/USD) market is gaining impressive traction as bullish sentiment intensifies. In today’s trading session, a sharp uptick in buying pressure has propelled the price into higher territory, breaking through key resistance levels with confidence.
After briefly consolidating around the $0.25 mark following a mild correction, the market quickly regained momentum. SEI surged past the psychological barrier at $0.30 and is now approaching the $0.35 region, signaling strong upward momentum.
This rally appears to be underpinned by positive fundamentals within the Sei ecosystem, potentially drawing renewed investor interest. Notably, trading volume has remained elevated over the past two sessions, suggesting sustained buying activity and further upside potential.
The Sei Market (SUI/USD) Market Data
- SEI/USD Price Now: $0.34
- SEI/USD Market Cap: $1.9 billion
- SEI/USD Circulating Supply: 5.6 billion SEI
- SEI/USD Total Supply: 10 billion SEI
- SEI/USD CoinMarketCap Ranking: #51
Key Levels
- Resistance: $0.35, $0.40, and $0.45
- Support: $0.28, $0.25, and $0.20
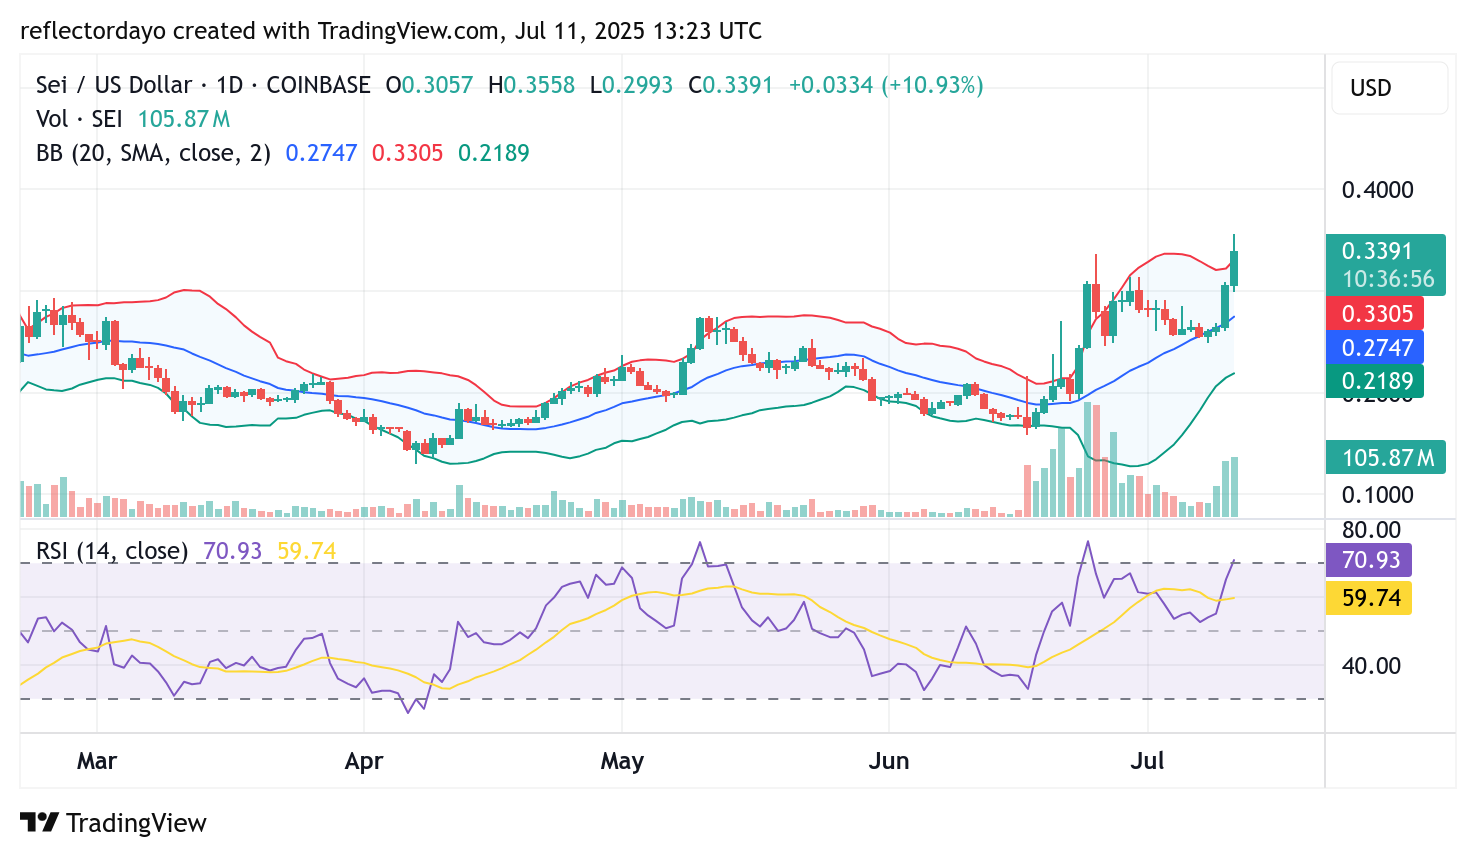
The Sei Market (SEI/USD) Daily Chart Outlook: Bullish Breakout and Potential Support Formation
The Sei (SEI/USD) market is exhibiting strong bullish momentum, having successfully flipped the critical $0.30 resistance level into a support zone. This significant price move has reinforced bullish sentiment, fueling continued upward movement.
The rally began yesterday from the $0.25 region and has shown impressive strength, extending into today’s session with minimal hesitation. As price action approached the $0.35 mark, a modest correction emerged—likely due to short-term profit-taking by traders.
Technical indicators reflect this strong momentum, with the Relative Strength Index (RSI) now touching overbought territory. While this crypto signal suggests a cooling phase could be near, the market remains poised for further upside if buyers can hold the current level around $0.34.
If bulls maintain control and price stays buoyant at this level, $0.34 may solidify as a new support, potentially setting the stage for another leg upward in the ongoing bullish trend.

SEI/USD 4-Hour Chart Analysis: Signs of Exhaustion as Market Balances at $0.34
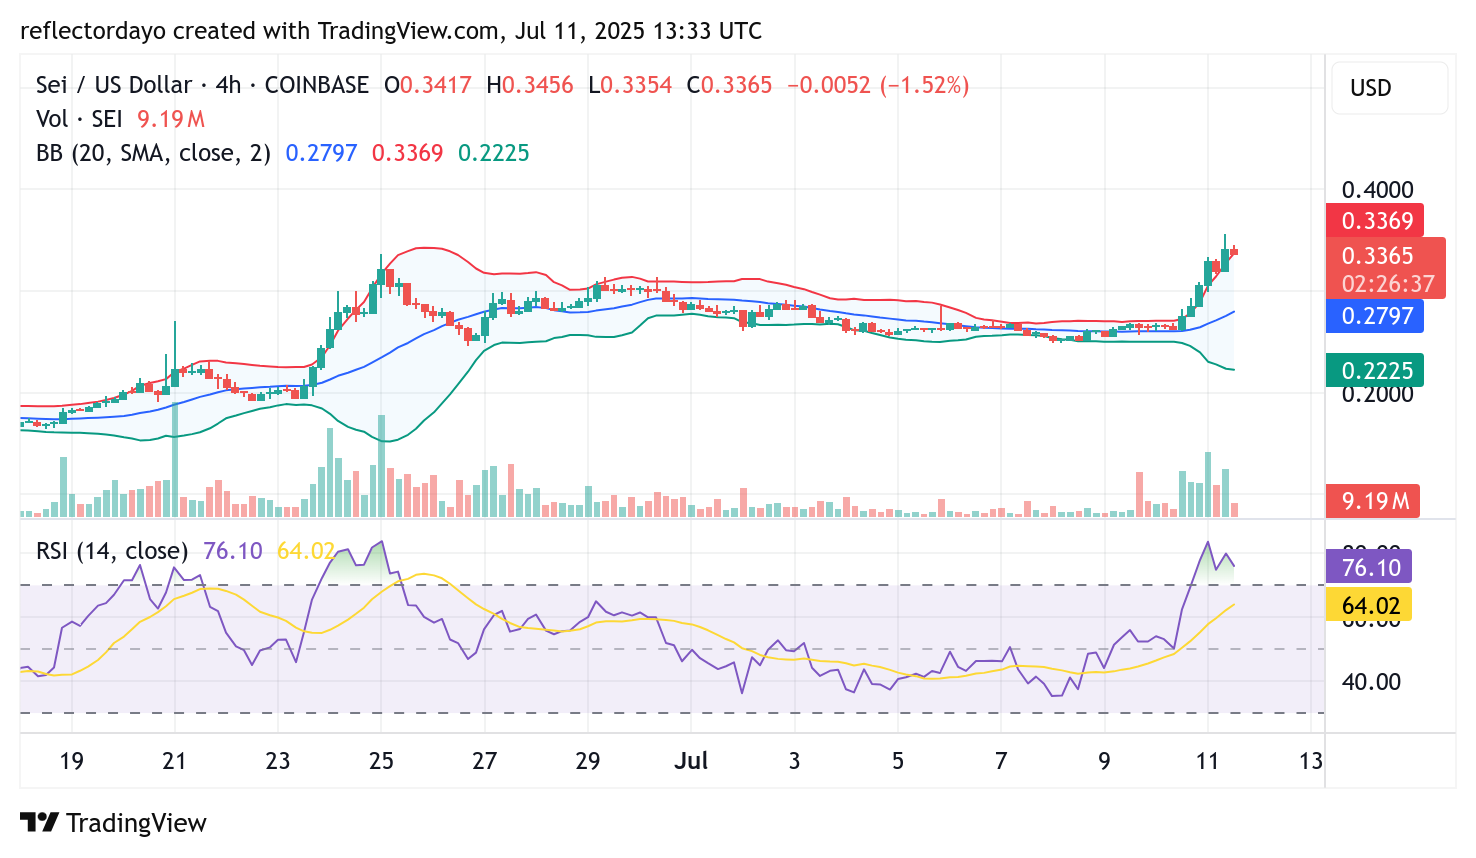
On the 4-hour chart, SEI/USD is currently showing signs of consolidation near the $0.34 price level, highlighted by the appearance of a plus-sign doji candle—often a signal of market indecision.
Despite the current stability, the Bollinger Bands are diverging, with price action trading above the upper band. This setup typically suggests that the market is in an overbought condition and may be due for a correction. The expanded bandwidth of the indicator further reinforces this possibility, indicating heightened volatility.
Should a pullback occur, the $0.30 level is expected to serve as a strong support zone and potential reentry point for bullish traders. As a recently flipped resistance, it now presents itself as a higher support level—an encouraging sign for those anticipating continued upside once the correction plays out.