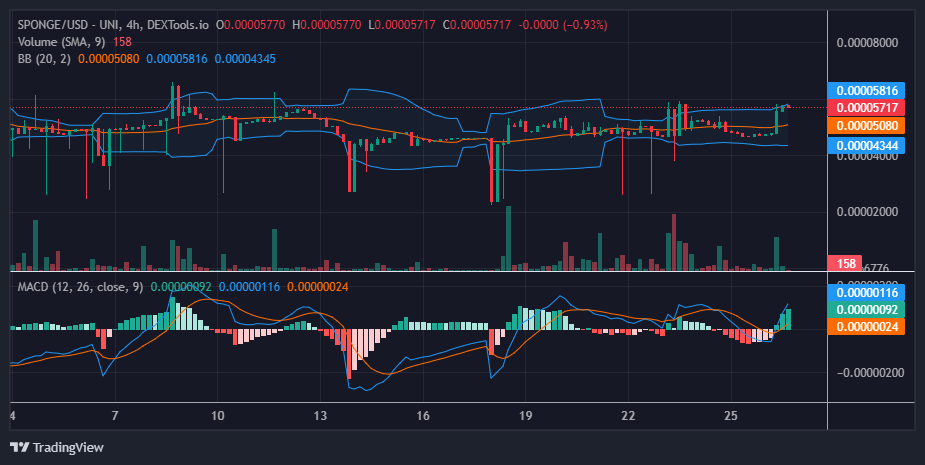
In this analysis of the $SPONGE market, there are indications of the trend teetering between the shores of support and resistance, with volatility ebbing away. However, a sudden surge emerges, signaling a bullish tide that now crashes against the formidable barrier at $0.000058. It is crucial for the bull market to surge beyond the $0.000058 and $0.00006 price levels to establish a bullish trajectory.
Key Market Dynamics:
- Resistance Levels: $0.0010, $0.0011, and $0.0012.
- Support Levels: $0.000035, $0.000030, and $0.000025.
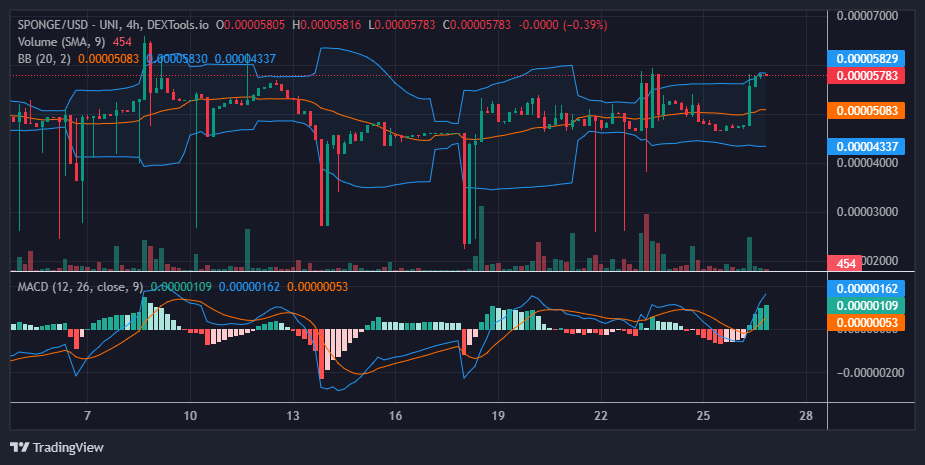
Delving into Technical Analysis for $SPONGE (SPONGE/USD):
In today’s trading session, the strong bullish candlestick in the third 4-hour session was notable as it brought the market close to the crucial $0.00006 price level, exerting pressure on the bearish position at this juncture. Consequently, the market drifts sideways, caught within the broad range outlined by the Bollinger Bands.
To navigate further, the bulls must gather sufficient momentum to overcome the barriers at $0.000058 and $0.00006. Alternatively, if bullish momentum persists, matching the bears at this level and creating a narrow channel of consolidation around $0.00006, a support level may emerge. This could eventually compel bears to reposition themselves at higher price levels.
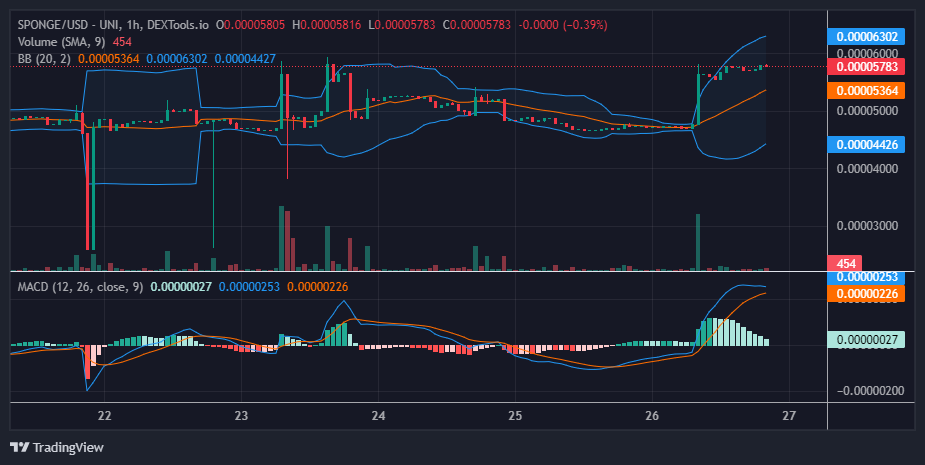
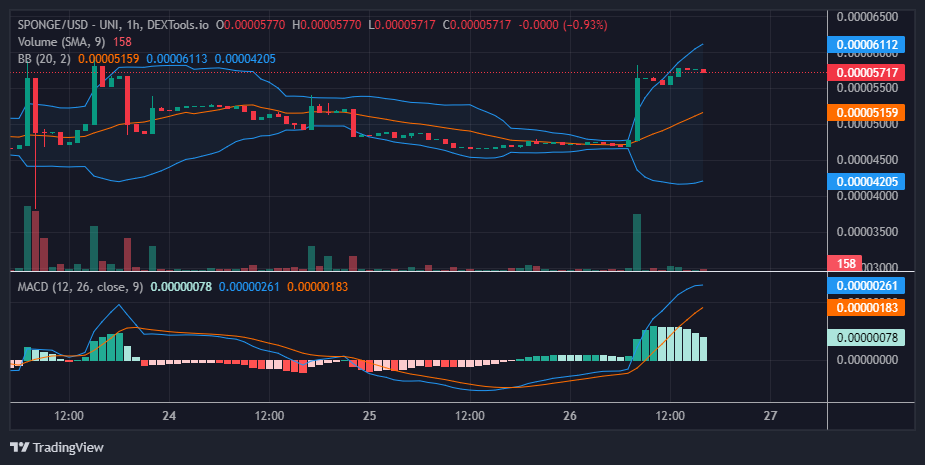
Insights from the 1-Hour Perspective:
On the 1-hour chart, the market appears to stabilize around $0.000058. With an increase in bullish activity at this level, the potential for an upward surge emerges. However, a detailed analysis of indicators, particularly the Moving Average Convergence and Divergence (MACD), indicates a fading green hue, suggesting a decline in bullish momentum. As a crypto signal result, immediate breakthroughs in resistance appear unlikely.
Nevertheless, if the bulls gather momentum around a more robust support level, such as $0.000055, the likelihood of success may grow. A solid support level at $0.000055 could exert pressure on the $0.00006 price level, potentially facilitating a breakthrough.
Absorb the damp!
Once you start there’s no going back.$SPONGE #MemeCoin #Crypto pic.twitter.com/Nx93DJGIXD
— $SPONGE (@spongeoneth) April 26, 2024
Invest in the hottest and best meme coin. Buy Sponge ($SPONGE) today!

 ENJUSD consolidated at the discount zone until late last year. The price remained within the $0.210 support and $0.270 previous resistance until November 2023. The