Lucky Block Price Prediction: LBLOCK/USD Could Move Sideways as Price Hovers Around $0.000101

Lucky Block Price Prediction – July 18

The Lucky Block price prediction shows that the coin will cross above the moving averages to create additional gains.

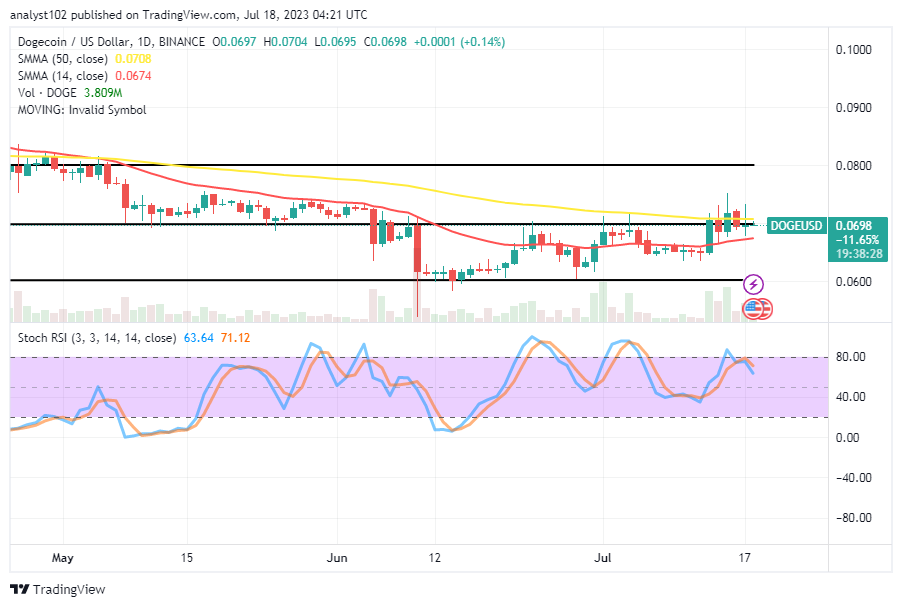
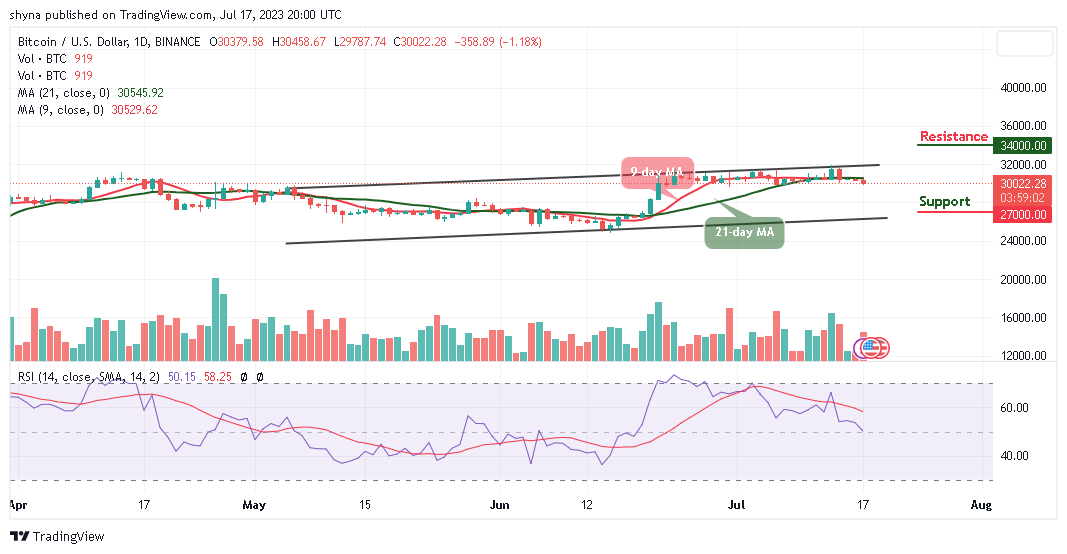
LBLOCK/USD Medium-term Trend: Ranging (1D Chart)

Key Levels:

Resistance levels: $0.000150, $0.000160, $0.000170

Support levels: $0.000060, $0.000050, $0.000040

Lucky Block Price Prediction: LBLOCK/USD Could Move Sideways as Price Hovers Around $0.000101
LBLOCKUSD – Daily Chart

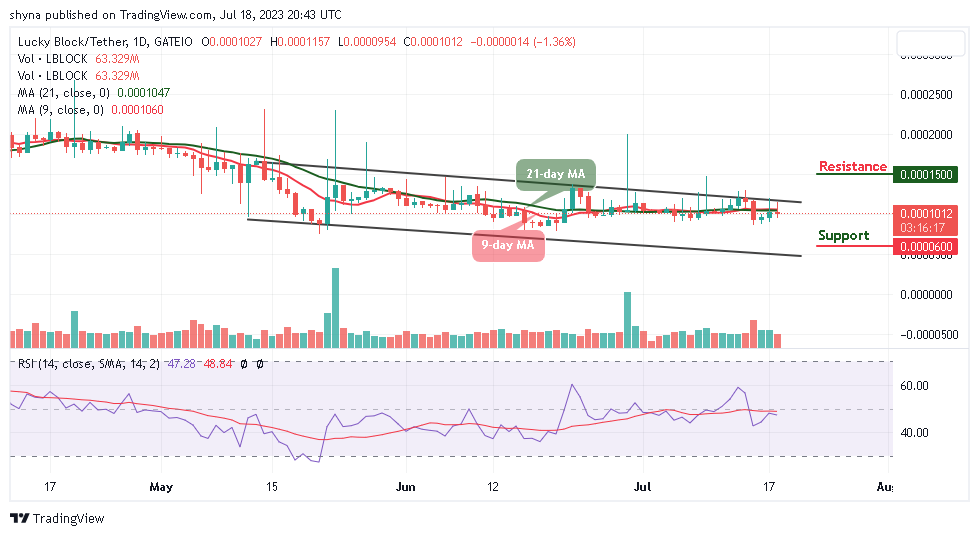
From now on, LBLOCK/USD will begin to follow a bullish movement as the coin moves to cross above the 9-day and 21-day moving averages. The current movement is essential for the coin so that it can reach the resistance level of $000120 as new buyers are expected to enter the market. Meanwhile, if the sellers bring the market toward the lower boundary of the channel, the support level of $0.000080 could be reached.

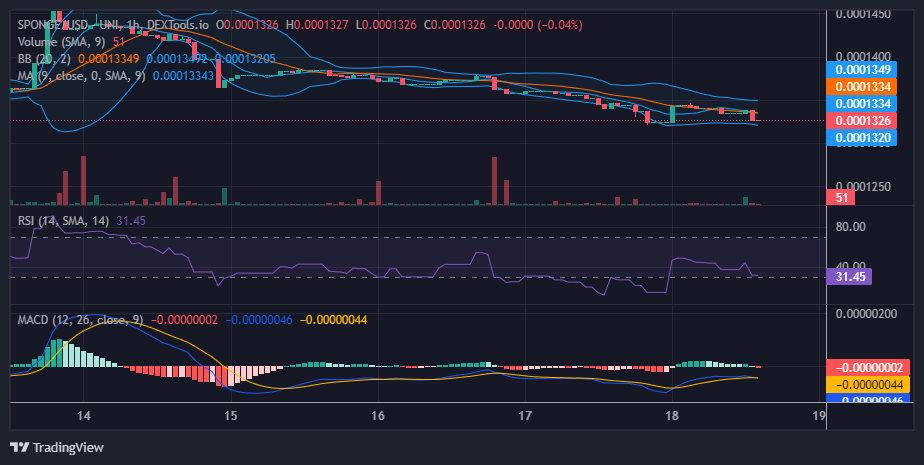
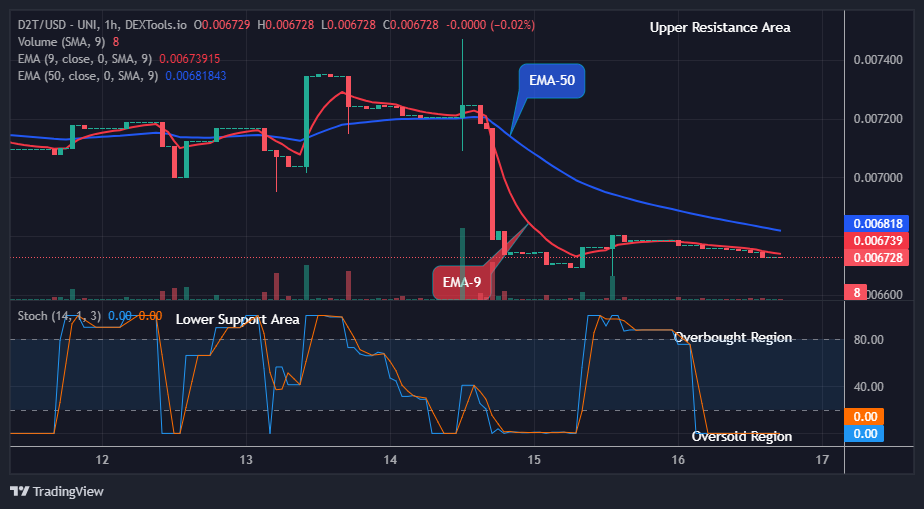
Lucky Block Price Prediction: LBLOCK Could Move Sideways

The Lucky Block price is hovering below the 9-day and 21-day moving averages. If the coin creates more bearish signals, it could move bearishly. Meanwhile, it will be a good opportunity for the existing buyers to buy the dip while the new buyers could invest in the coin. Moreover, the technical indicator Relative Strength Index (14) is seen around the 50-level. Any bearish movement may locate the supports at $0.000060, $0.000050, and $0.000040.

Furthermore, if the buyers hold the current market value and push it to cross above the 9-day and 21-day moving averages, the bulls can break above the upper boundary of the channel, and any further bullish movement could hit the resistance levels at $0.000150, $0.000160, and $0.000170 respectively.

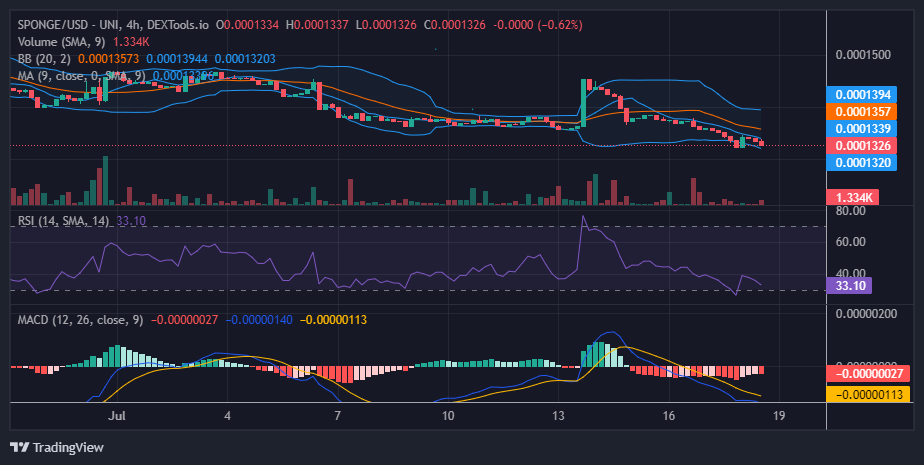
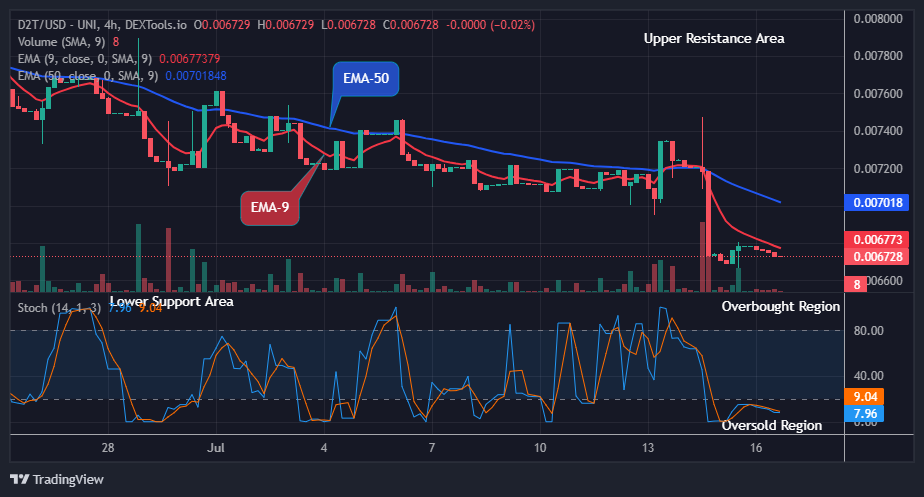
LBLOCK/USD Medium-term Trend: Ranging (4H Chart)

On the 4-hour chart, the Lucky Block price ranges as the buyers are preparing to come into the market by crossing above the 9-day moving average. LBLOCK/USD is trading near the resistance level of $0.000110.

LBLOCKUSD – 4 Hour Chart

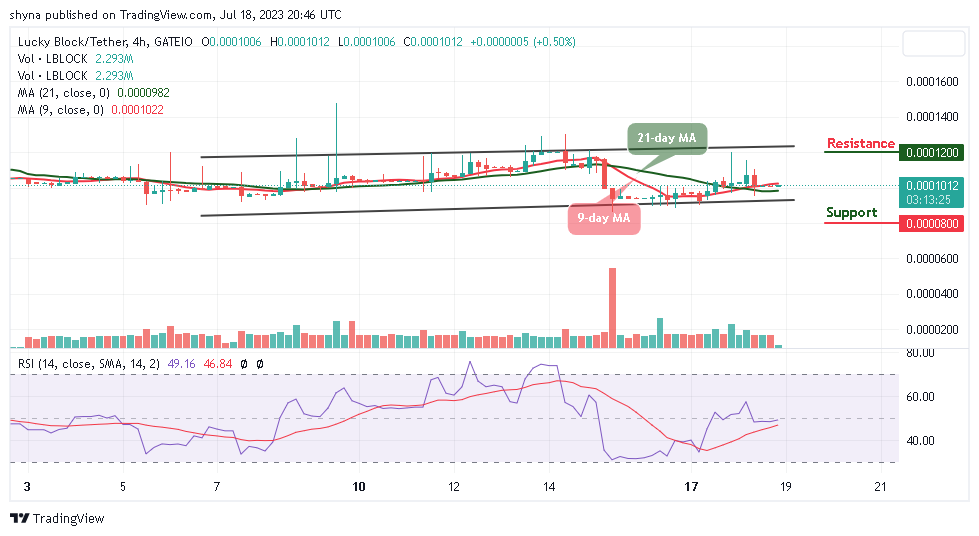
Moreover, the buyers are getting ready to spike above the moving averages, higher resistance could be located at $0.000120 and above, but any bearish movement could hit the support at $0.000080 and below as the technical indicator Relative Strength Index (14) faces the 50-level.

You can purchase Lucky Block here. Buy LBLOCK

Ripple and SEC May Settle Soon, Court Orders

The legal battle between Ripple and the US Securities and Exchange Commission (SEC) may be nearing its end. A US judge has ordered both parties to agree on possible dates for a settlement conference.

The order was issued by US Magistrate Judge Sarah Netburn, who will oversee the next phase of the case. She asked Ripple and the SEC to suggest three dates that are convenient for them if they think a settlement is productive at this time.

The suggested dates should be 6–8 weeks in advance, due to the court’s busy schedule. The judge also warned that she would not accept any last-minute requests or delays.

US Court Document showing latest Ripple vs. SEC order
US Court Document

Settlement Talks Come Shortly After Ruling

This order comes shortly after US District Court Judge Analisa Torres ruled that XRP, the cryptocurrency used by Ripple, is not a security. This was a major win for Ripple, as it could clear the way for more regulatory clarity in the crypto industry.

Many observers believe that the SEC may be willing to settle with Ripple after losing this crucial point. However, it is not clear if Ripple will agree to settle or pursue a full victory.

Eleanor Terrett, a journalist from Fox Business, said that the order does not mean a settlement will happen soon. She said it only means that both sides should be ready to schedule a meeting if they want to.

She also said that both sides could refuse to meet or fail to agree on anything. She has been following the case closely since it started.

Meanwhile, Fred Rispoli, a lawyer who supports XRP, said that he thinks both sides will schedule a meeting to avoid upsetting the court. He said that this could be a sign of progress in the case.

A Pivotal Moment for Ripple and the Crypto Market

The outcome of this case could have a huge impact on the future of cryptocurrencies. The crypto community is eagerly waiting for more updates on the possible settlement conference and its implications for both Ripple and the wider regulatory landscape.


You can purchase Lucky Block here. Buy LBLOCK

SPONGE/USD ($SPONGE) Buyers Once Again Regroup at $0.0001325

The recent influx of buyers and sellers in the SPONGE/USD market has had a significant impact on market volatility, resulting in substantial price swings. Due to this heightened volatility, the price has retraced to the support level. However, with the bulls regrouping at $0.0001325, the bear market was unable to extend its downward movement.

Key Levels

  • Resistance: $0.0004, $0.0045, and $0.0005.
  • Support: $0.00013, $0.00012, and $0.00011

SPONGE/USD ($SPONGE) Buyers Once Again Regroup at $0.0001325

Sponge (SPONGE/USD) Price Analysis: The Indicators’ Point of View

Analyzing the market using the Bollinger Bands indicator, it appears that the market may consolidate above the support level. The lower band is not showing a significant response to the bearish pressure. This could be attributed to the resilience of SPONGE/USD buyers, who are effectively holding their ground and resisting further downward pressure. As a result, the market is likely to experience price consolidation before a potential upward movement.

SPONGE/USD ($SPONGE) Buyers Once Again Regroup at $0.0001325

$SPONGE Short-Term Outlook: 1-Hour Chart

The first 1-hour trading session commenced with a notable bullish candlestick, indicating that bulls dominated the initial phase of today’s trading. However, the most recent candlestick suggests that selling pressure has caused the SPONGE/USD bulls to retreat toward the support level. Considering the indecision observed near the support level, there is a possibility that a breakout will occur in an upward direction.

After purchasing your first MemeCoin, how did you feel?


Invest in the hottest and best meme coin. Buy Sponge ($SPONGE) today!

Dogecoin (DOGE/USD) Market Is Resorting to a Pit Stop, Conjecturing a Correction

Dogecoin Price Prediction – July 18
The Dogecoin market is resorting to a pit stop trade session, conjecturing a correction at a pace of pushing capacity it is maintaining as of the time of this technical piece.

Several price reactions have materialized in the DOGE/USD trade activities to showcase that buyers ability to push fearfully northward has hit a stronger resistance around $0.075. The negotiation zones have been seen for a few hours now, sustaining a positive 0.14 minute percentage rate between the high of $0.0704 and the low of $0.0695.

DOGE/USD Market
Key Levels:
Resistance levels: $0.075, $0.080, $0.085
Support levels: $0.060, $0.055, $0.050

DOGE/USD – Daily Chart
The DOGE/USD daily reveals the crypto-economic market is resorting to a pit stop, conjecturing a correction around the trending axis of the bigger indicator.

The positioning pattern of the indicators is portending that some decline forces might still feature only to allow the market to regain its stands to make up for a higher point of resistance in the long run as the 14-day SMA has been bending slowly northward from underneath the 50-day SMA. The Stochastic Oscillators have recently penetrated the overbought region to get a repositioning of 71.12 to 63.64, denoting that the pressure is a bit southbound.
Dogecoin (DOGE/USD) Market Is Resorting to a Pit Stop, Conjecturing a Correction
Which next move for the DOGE/USD market will be more difficult?
At this moment in this technical write-up, it appears that there will be room for a line of reductions in a manner of less price action as the DOGE/USD trade activity is resorting to a pit stop, conjecturing a correction.

In the process of the market moving to the downside, we believe that long-position takers will recoup the catalyst to negate the possibility of seeing a continuation in the furtherance of the devaluation around the point of $0.065. If that presumption doesn’t come into play, buyers will then settle for a lower support line of around $0.060 in the long run.

In the meantime, short-position takers would have to consolidate their efforts on any slight moves showcasing a return of rejection signals around the resistances between $0.075 and $0.080. The bear will need to exercise some caution to watch when such volatility will dowse before considering re-launching a sell order, though, if those points are vulnerable to a breakout opportunity.
Dogecoin (DOGE/USD) Market Is Resorting to a Pit Stop, Conjecturing a Correction
DOGE/BTC Price Analysis
In contrast, the Dogecoin market is currently resorting to a pit stop situation against Bitcoin, as it is conjecturing a correction from the near top of the smaller indicator.

The 50-day SMA trend line is above the 14-day SMA trend line. The Stochastic Oscillators have been positioned in the overbought region, and they have slightly crossed southbound from 81.43 to 72.67 points. Since the base cryptocurrency lacks the bright potential to rise well in the coming operations, a sizable number of drop hazards appear to hang over it. On the path to the south, however, not much is anticipated.

Note: Cryptosignals.org is not a financial advisor. Do your research before investing your funds in any financial asset or presented product or event. We are not responsible for your investing results.

You can purchase Lucky Block here. Buy LBLOCK

Tamadoge (TAMAUSD) Prepares to Rally

Although the direction of the TAMAUSD market is still unclear, the presence of two inverted hammers with very long upper shadows indicates a potential bullish reversal. This is particularly noteworthy as the consolidation occurs around the key support level. However, it is important to consider other indicators for a comprehensive analysis.

Key Levels                 

  • Resistance: $0.035, $0.040, and $0.045
  • Support: $0.010, $0.0091, and $0.0087.

Tamadoge (TAMAUSD) Prepares to Rally

TAMAUSD Price Analysis: The Indicators’ Point of View

On July 15th, there was a significant bearish price breakout from the key resistance level of $0.01156, which forced the TAMAUSD bulls to regroup at $0.0106. This development, as indicated by the Bollinger Bands indicator, increased the level of volatility in the market. However, despite the heightened volatility, the overall direction of the market has not yet been established. Currently, the market is trading below the 20-day moving average, indicating that bears still have a slight advantage. However, the support level is acting as a strong hindrance for them.

Tamadoge (TAMAUSD) Prepares to Rally

TAMA/USD Short-Term Outlook: 1-Hour Chart

Based on the 1-hour chart outlook, the price is currently trading sideways around the $0.0109 price level. This indicates that buyers are attempting to maintain the price above the key support level. Additionally, the Bollinger Bands are converging, suggesting a decrease in volatility. This indicates a potential continuation of the consolidation phase ahead of an imminent breakout.

Here it is for the world to see after we shared our first piece of concept art for the Pet Store NFT collection with our Tamadoge Telegram community.


Do you want a coin that will be 100 times more valuable in the next few months? That is Tamadoge. Buy TAMA today!

Apecoin (APE/USD) Turns in the Bullish Direction after Hitting $1.874

The Apecoin market has been in a downtrend since April, But now it seems like the bear market has hit a brick wall, as we can see from the appearance of the inverted hammer candlestick pattern. There has been a prolonged period of sell-off, so the appearance of this type of candlestick pattern may suggest that bulls are gaining strength to turn the market around in their favor.

Apecoin Market Data

  • APE/USD Price Now: $2.06
  • APE/USD Market Cap: $758,349,313
  • APE/USD Circulating Supply: 368,593,750 APE
  • APE/USD Total Supply: 1,000,000,000
  • APE/USD CoinMarketCap Ranking: #54

Apecoin (APE/USD) Turns in the Bullish Direction after Hitting $1.874

Key Levels

  • Resistance: $2.30, $3.00, and $3.50.
  • Support: $1.90, $1.50, and $1.30.

Price Prediction for Apecoin: The Indicators’ Point of View

The appearance of an inverted hammer and a very significant volume histogram on July 14 is a sign of a potential trend reversal. The strong volume indicates a significant influx of Apecoin buyers, but the inability to push the price higher indicates a lack of follow-through momentum. Traders might view this as a potential sign of a trend slowdown or a period of consolidation, but it also stands as a sign of a trend reversal.

Apecoin (APE/USD) Turns in the Bullish Direction after Hitting $1.874

APE/USD 4-Hour Chart Outlook

In the 4-hour timeframe, the market is moving along with the 20-day moving average. This means that the price is still within the range of equilibrium, even though demand slightly exceeds supply. The bulls need to overcome the key resistance at $2.269. However, as the Bollinger Bands indicator suggests a decrease in volatility, we might witness some price consolidation before a significant movement occurs.

Buy Apecoin on eToro.

ApeCoin (APEUSD) Shows Bullish Divergence According to RSI

APEUSD Analysis: RSI Indicates Bullish Divergence in ApeCoin (APEUSD)

APEUSD shows signs of bullish divergence according to the RSI. The RSI (Relative Strength Index) is set to face upward as the price recovers from an oversold state. The market’s order flow has been bearish as the APEUSD buyers lose complete interest in causing a significant rally. However, the RSI has indicated a divergence as it creates higher lows against the price.

APEUSD Significant Zones
Demand Zones: $1.810, $1.560
Supply Zones: $3.370, $6.420

ApeCoin (APEUSD) Shows Bullish Divergence According to RSI

The downtrend began in January 2023 in response to the triggered sell orders at the $6.420 supply zone. Since the downtrend began, APEUSD has remained under the control of the bears, as indicated by the MA Cross. While the downtrend continued, the APEUSD buyers completely exited the market. This caused a massive decline, as the price barely created a significant bullish expansion. Since the second week of May 2023, the RSI indicator has been below the 50.0 level.

This indicates the overwhelming dominance of the bears, as they refuse to halt the selling process. While the market’s structure is still bearish, a bullish divergence was signalled by the RSI. This resulted from the divergence between the price’s movement and the RSI’s movement. Recently, the RSI formed a higher low, while a lower low formed in the price’s move. As it appears, APEUSD is likely to experience a significant rally for the first time in about six months.

ApeCoin (APEUSD) Shows Bullish Divergence According to RSI

Market Expectation

On the four-hour chart, APEUSD is heading into the premium zone. The four-hour bullish order block will likely cause the expected expansion, thereby invalidating the previous high of $2.530.


How To Buy  Lucky Block

NoteCryptosignals.org is not a financial advisor. Do your research before investing your funds in any financial asset or presented product or event. We are not responsible for your investing results.

Dash 2 Trade Price Predictions for Today, July 18: D2TUSD Price Could See another Uphill Trend Soon, Watch out for Buy!

Dash 2 Trade Price Forecast: D2TUSD Price Could See Another Uphill Trend Soon, Watch out for Buy! (July 18)
The market price of D2TUSD may experience a possible reversal at the $0.00672 support level to resume its upside moves soon. The coin price may likely reverse in a bullish direction, and it may soon be prepared for another probable upward surge. The price may perhaps retrace to retest the previous high of $0.00789 level and even further if buyers can demonstrate their strength and trade hands with sellers at the current support level of $0.00672. Thus, a post-retest rally may drive the prices high to hit the $0.1000 upper resistance trend level.

Key Levels:
Resistance levels: $0.00800, $0.00900, $0.01000
Support levels: $0.00700, $0.00600, $0.00500

D2T (USD) Long-term Trend: Bearish (4H Chart)
Dash 2 Trade market is having a bearish posture in its long-term outlook as can be seen from the chart below. This is due to the high inflow from the sell traders.
Dash 2 Trade Price Predictions for Today, July 18: D2TUSD Price Could See another Uphill Trend Soon, Watch out for Buy!
The sustained pressure from the bears at the $0.00675 support level during yesterday’s session has contributed to its bearishness in its recent low.

Today, the bears however made a drop to a $0.00672 support level below the moving averages as the 4-hourly session opens. Given the current trend, buyers are able to purchase the item at a lower cost and push the market higher.

Hence, if the bulls could change their orientations and trigger a breakout above the $0.00789 resistance level, a breakout above this barrier, with a 4-hour candle closing could signify a shift in the market dynamics.

Further, D2TUSD is likely going to reverse and face the upsides as the market is now trading around the 8% range of the daily stochastic; it means that the selling pressure will end soon.

This will compel the buy traders to resume an uptrend and may likely break up the $0.00789 supply level soon in its higher time frame.

D2T (USD) Medium-term Trend: Bearish (1H Chart)
The Dash 2 Trade price is forming lower lows and lower highs on its long-term chart. Further, the price is trading below the two EMAs; it means that it’s in a bearish market zone at the moment.
Dash 2 Trade Price Predictions for Today, July 18: D2TUSD Price Could See another Uphill Trend Soon, Watch out for Buy!
The price drop to the $0.00675 low value during the previous action has made the coin price trade below the supply levels in recent times.

The market price of Dash 2 Trade is currently trading at the $0.00672 support value below the resistance trend lines in the medium-term outlook. This is due to the inflow from the short traders.

Meanwhile, the current price at a $0.00672 low value below the supply trend lines has not stale the market condition of the crypto. Thus, traders who buy the coin during the bearish market will also make gains in the future.

Furthermore, there is a possibility for a price reversal at the mentioned support as the market now trades at the oversold region of the daily stochastic. In light of this, the upcoming bullish rally may likely break up the $0.00747 high mark which might possibly hit the $0.1000 supply value in the coming days in the medium-term outlook.

We calculated! Almost 16 times less likely to enter rug pull presales! D2T is preparing to alter the rules of the game. Visit http://Dash2Trade.com to learn more.


Want a coin that has a huge potential for massive returns? That coin is Dash 2 Trade. Buy D2T now.

Bitcoin Price Prediction: BTC/USD Faces Fresh Support At $29,000

Bitcoin Price Prediction – July 17

The Bitcoin price prediction shows BTC sliding toward the downside as the cryptocurrency touches the $29,787 low.

BTC/USD Long-term Trend: Ranging (Daily Chart)

Key levels:

Resistance Levels: $34,000, $35,000, $36,000

Support Levels: $27,000, $26,000, $25,000

Bitcoin Price Prediction: BTC/USD Faces Fresh Support At $29,000
BTCUSD – Daily Chart

BTC/USD is seen dropping with another loss of 1.18% today as the cryptocurrency falls beneath the $30,000 support level to reach the daily low at $29,787. However, the daily chart reveals that $29,000 is a very important area as it is expected to provide strong support for the coin.

Bitcoin Price Prediction: Bitcoin Price May Cross Below $29k

The Bitcoin price begins to slide below the 9-day and 21-day moving averages at support provided by the trend line of the channel. A breakdown below this trend line could cause the Bitcoin price to create a new low below the $29,000 level. However, a bearish slide toward the lower boundary of the channel could be detrimental to Bitcoin as it could lead the first digital asset toward the supports at $27,000, $26,000, and $25,000.

Moreover, if the buyers can rebound from the current support level of $30,022, the first level of resistance could lie at $31,000. This may likely follow by the potential resistance at $34,000, $35,000, and $36,000 levels. Therefore, if the coin can break above these levels, then the market may be on the verge of turning bullish in the long term. Presently, the Relative Strength Index (14) is likely to cross below the 50-level, indicating that more bearish signals might come to play.

BTC/USD Medium-term Trend: Ranging (4H Chart)

As revealed by the 4-hour chart, the Bitcoin price is seen hovering at $30,069 as the coin trades around the lower boundary of the channel with sellers forcing its price down to the low of $29,900. However, if the bulls decide to push the market price back above the 9-day and 21-day moving averages, the coin may likely hit the resistance at $31,500 and above.

BTCUSD – 4-Hour Chart

Nevertheless, it now appears that the cryptocurrency is at risk of seeing further downside in the near term, as the multiple attempts to shatter its $29,500 support seem to indicate that bears are building momentum. As the Relative Strength Index (14) remains below the 40-level, the king coin may locate critical support at $29,000 and below.

You can purchase Bitcoin here. Buy BTC