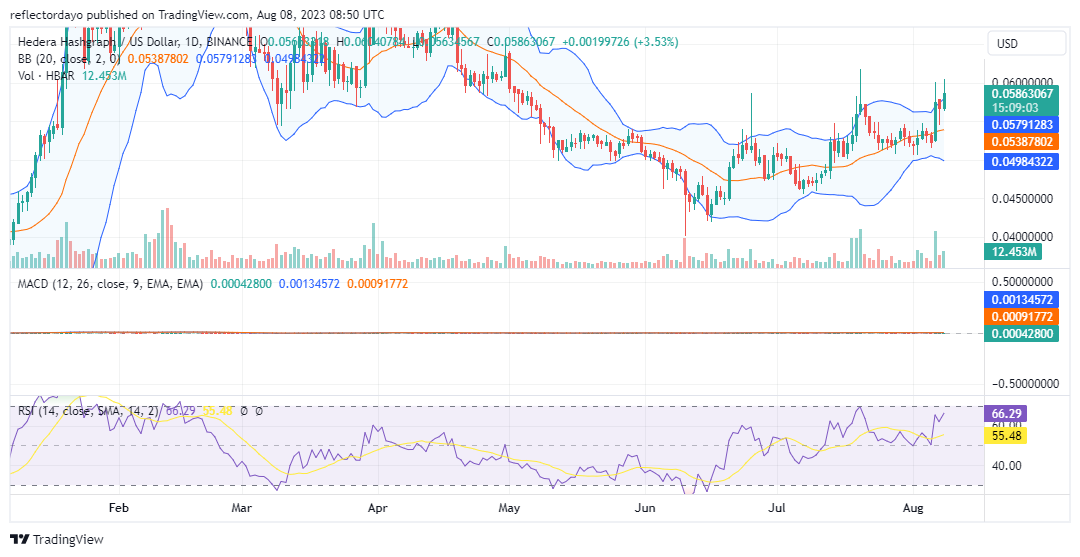
In the Hedera Hashgraph market, the price levels at $0.06 and $0.055 have consistently served as resistance points since June 25. The price movement has repeatedly challenged this resistance range and notably breached the $0.06 mark after July 20. Despite the underlying support level initially being below $0.055, recent sessions indicate the emergence of a stronger support level above $0.055.
HBAR Market Data
HBAR/USD Price Now: $0.0584
HBAR/USD Market Cap: $1.9 billion
HBAR/USD Circulating Supply: 32,559,526,344 HBAR
HBAR/USD Total Supply: 50,000,000,000
HBAR/USD CoinMarketCap Ranking: #30
Key Levels
Resistance: $0.060, $0.065, and $0.070.
Support: $0.055, $0.050, and $0.045.
Price Prediction for Hedera Hashgraph: The Indicators’ Point of View
Prior to mid-June, the Hedera Hashgraph market was in a downtrend until it established firm footing around $0.042. Subsequently, an uptrend commenced. Additionally, since that point in time, the market has witnessed an escalation in volatility. This uptick in volatility has reinvigorated the bear market, leading to a substantial gap between the support and resistance levels. Nevertheless, the bulls currently hold the advantage as they exert upward pressure on the bears. Given the establishment of a robust support level, there is a likelihood of breaching the $0.06 resistance level.
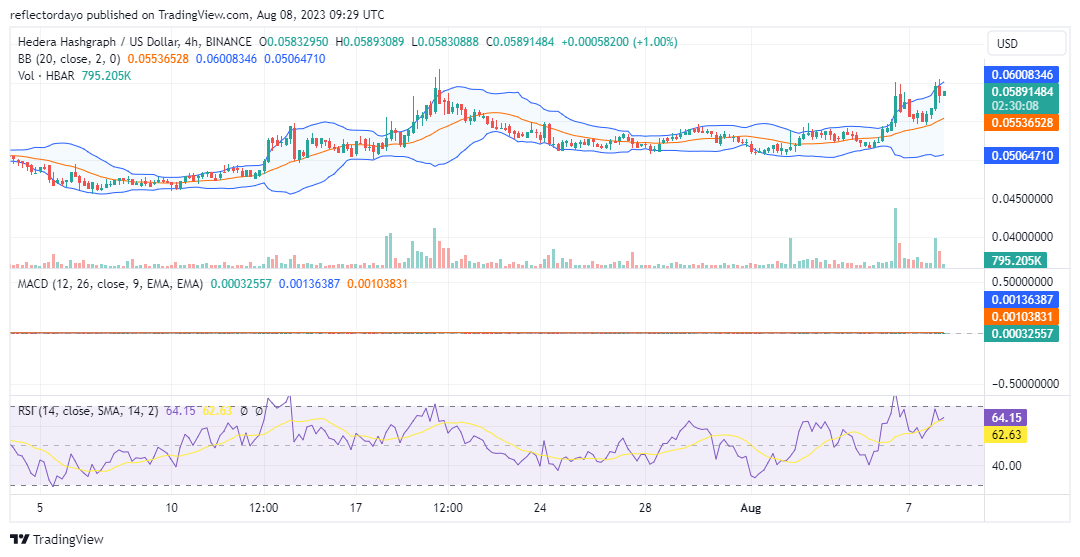
HBAR/USD 4-Hour Chart Outlook
Upon reviewing the 4-hour chart, we observe the expansion of the Bollinger Bands, indicating potential unpredictability in price movement. Nevertheless, due to the establishment of a higher support level by the bull market, their prospects outweigh those of the bears. Traders should closely monitor the potential breach of the $0.06 resistance level so that they will be able to ascertain the next direction of the market.
Dogecoin Price Prediction – August 8 The financial book of records of the Dogecoin market bulls’ inversion reaches SMAs and tempts a base against the worth of the US Dollar closely around $0.070.
The velocity power applied to the market at the time of this technical analysis appears to be intensifying in a consolidated-moving approach towards securing the fewest number of reduction points before attempting to either bounce or rally back into upward-dealing motions later. Around $0.0690 has been identified as the ideal low point to continue the trend’s lone positive course within the range-bound trading zones.
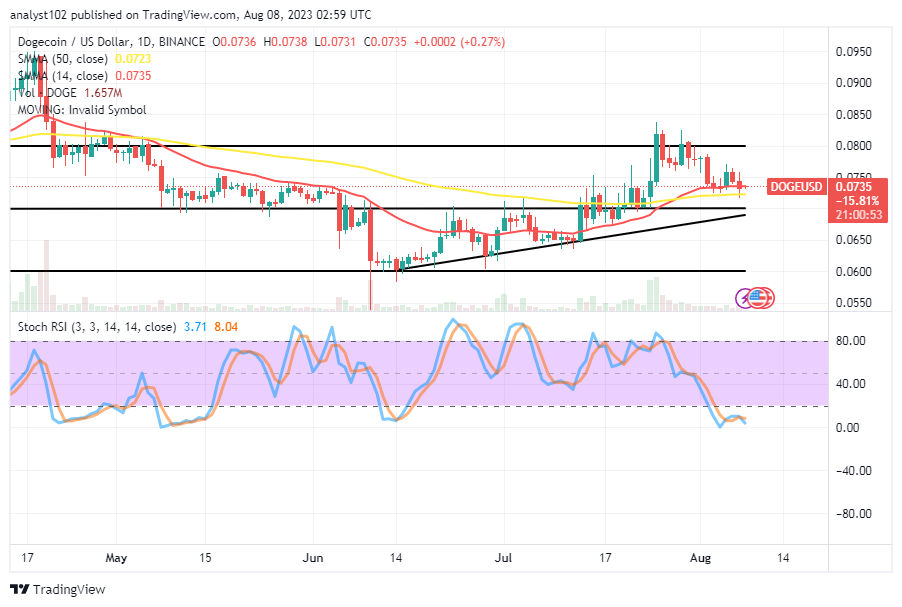
DOGE/USD – Daily Chart The DOGE/USD daily reveals the crypto-economic trade bulls’ inversion reaches SMAs and tempts a base bargaining zone of around the spot of $0.0690 in accordance with the higher point of the bullish trend line drawn in the ranges.
The 14-day SMA indicator is located at $0.0735, only a little bit above the 50-day SMA indicator’s value of $0.0723. And if bulls want to increase their vigor, they are currently acting as the tending zones where the market may finally experience an early bounce-off mood. The stochastic oscillators are maintaining a depression-like pace between 8.04 and 3.71 while being oversold. What should traders expect given the state of DOGE/USD business operations right now? The expectation as regards the present situation in the Dogecoin against the US currency is that traders should be cautious of coming until an active move surfaces, given that the crypto-economic market bulls’ inversion reaches SMAs at the moment and tempts a base outlook to begin a swing high.
In the meantime, long-position placers are to be getting ready for re-positioning mode by executing a pending order of buy limit around $0.070 or thereabout with a reasonable use of a stop-loss order. However, investors should never cash out their positions at any depreciation point. Rather, they should let their stances run on a long-term basis into a bullish trend before closing to maximize profits at the later end.
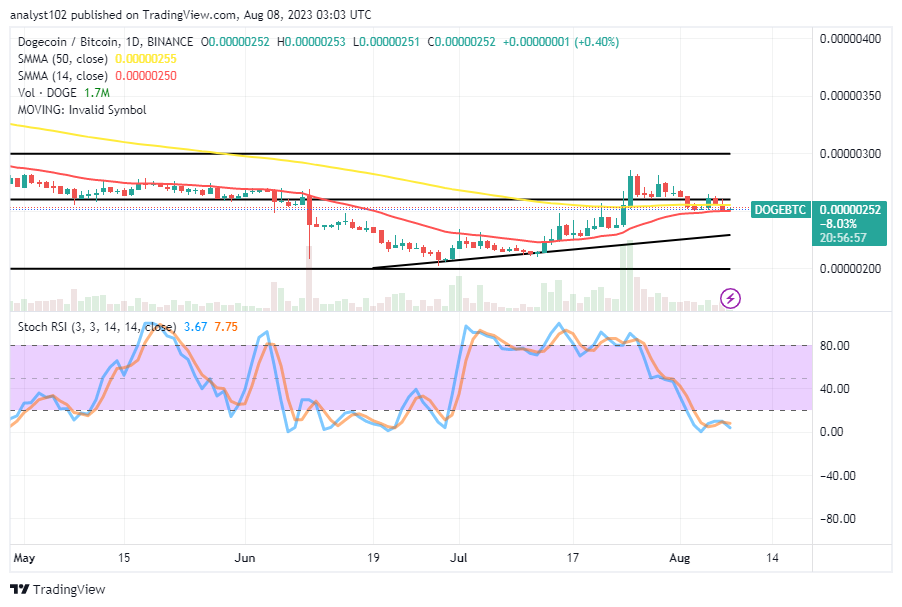
As it stands, if a swift rebound occurs from the SMAs’ points, selling actions may be pushed into whipsawed trade settings. Similarly, if the price is forced lower to only test a support of approximately $0.070, along with a nervous bounce, buyers may be able to pass through some higher marks that aren’t much higher than the previous. DOGE/BTC Price Analysis In contrast, the Dogecoin market bulls’ inversion reaches SMAs and tempts a base against the purchasing worth of the US coin.
The 14-day SMA trend line is underneath the 50-day SMA trend line, maintaining a closure point. The drawn bullish trend line illustrates the greatest possible decline in price from the current, provisionally convergent low values of the moving averages. The oversold region of the stochastic oscillators indicates that there is a downward force between 7.75 and 3.67.
Note:Cryptosignals.org is not a financial advisor. Do your research before investing your funds in any financial asset or presented product or event. We are not responsible for your investing results.
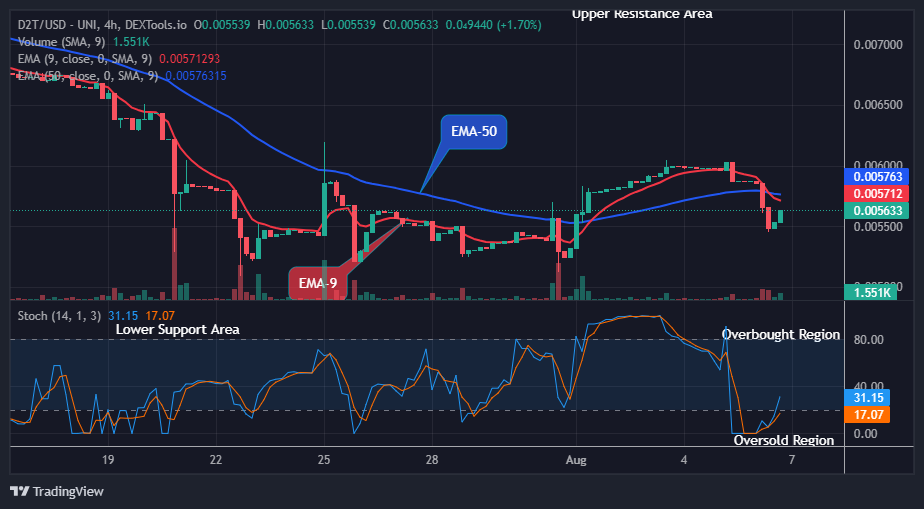
Dash 2 Trade Price Forecast: D2TUSD Price Will Surpass $0.00674 Amidst Rising Momentum, Purchase Now! (August 8) In recent days, the D2TUSD pair showed a significant upsurge offering an opportunity for an extended recovery. The coin is possibly making its way up after hitting the $0.00553 high level to signal a pump. Thus, a strong push from the current price at a $0.00563 supply value will put the crypto in a bullish trend and this may further extend to the $0.0 1000 upper resistance level resulting in intraday gains for buying traders.
D2T (USD) Long-term Trend: Bearish (4H) D2TUSD indicates a downward trend with a bearish sentiment in its long-term perspective. The coin is trading below the two EMAs. However, the current trend will soon be nullified as the market has now resumed its bullish race to the overhead resistance.
Sellers’ pressure on the coin to a $0.00545 low level in the previous action has made Dash 2 Trade price remain below the supply trend levels in recent times.
An increase to a $0.00563 high level below the two EMAs approaching the resistance levels as the 4-hourly chart opens today indicates that traders are actively buying at this level.
This current trend will enable the coin price to remain on the upside and rise or break out above a $0.00674 supply value indicating a strong recovery level from the long traders. This will however creates a strong area of interest for buyers.
Additionally, the D2TUSD market is pointing up in the oversold; this will quicken the emergence of more buyers to move the crypto price up to a significant level at the upside and this might hit the $0.01000 supply trend mark, thus registering a buy signal for the coin traders as the market remain strongly bullish soon in its higher time frame.
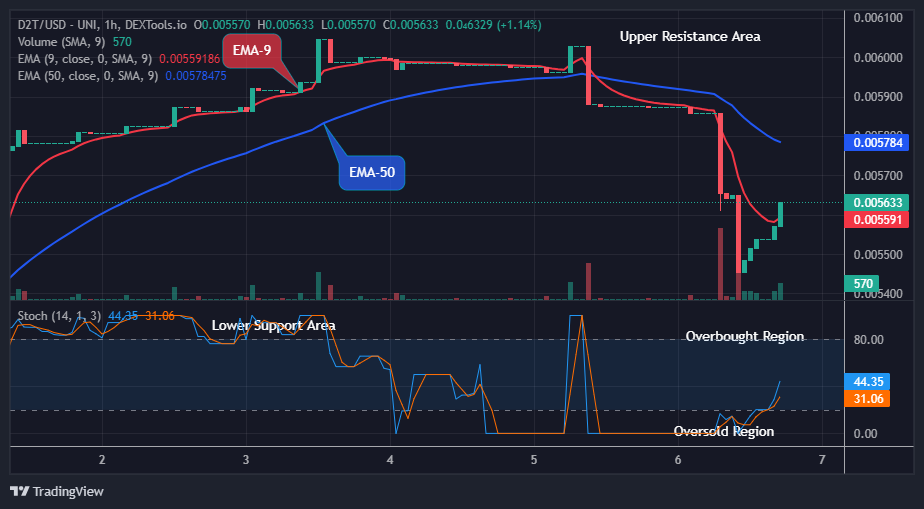
D2T (USD) Medium-term Trend: Bullish (1H) The D2TUSD pair remains in an uptrend in its medium-term outlook. The price bars can be seen above the EMA-9 with huge volumes from the long investors approaching the overhead resistance. The coin price has walked a lateral path, trying to sustain above the $0.00557 price level.
The sustained bullish pressure pushed the currency pair up to the $0.00548 supply level during yesterday’s session and sustained it. This has made it capable for the coin to remain firm in an uptrend in recent times.
Dash 2 Trade’s current price at the $0.00563 resistance level above the supply level suggests the returns of the buy traders in the market. The market participants are responding to this pattern, and its breakout should offer a good buy entry opportunity for interested traders.
However, if buyers successfully keep the coin prices above a $0.00588 high level, a retest of the previous high at $0.00604 level is possible soon, offering buyers a suitable footing to rise higher.
Hence, the price of Dash 2 Trade pointing upwards on the daily stochastic means that further upside is certain. It is therefore expected that the buy investors will move the price action up and may likely hit the $0.01000 supply level in the days ahead in its medium-term time frame.
The market is sending mixed signals as price activity stays flat. Smart Money Stablecoin holdings have dropped to 10.8%, meaning that 90% of their wealth is now invested in volatile assets. Exchange outflows signal retail selling, while Smart Money fills their suitcases.
🔍 Smart Money Insights 🚀
The market shows mixed signals as price action remains stagnant. Smart Money Stablecoin holdings decline to 10.8%, indicating 90% of their capital in volatile assets. Outflows from exchanges suggest retail selling, while Smart Money fills up their… pic.twitter.com/g3V7emueas
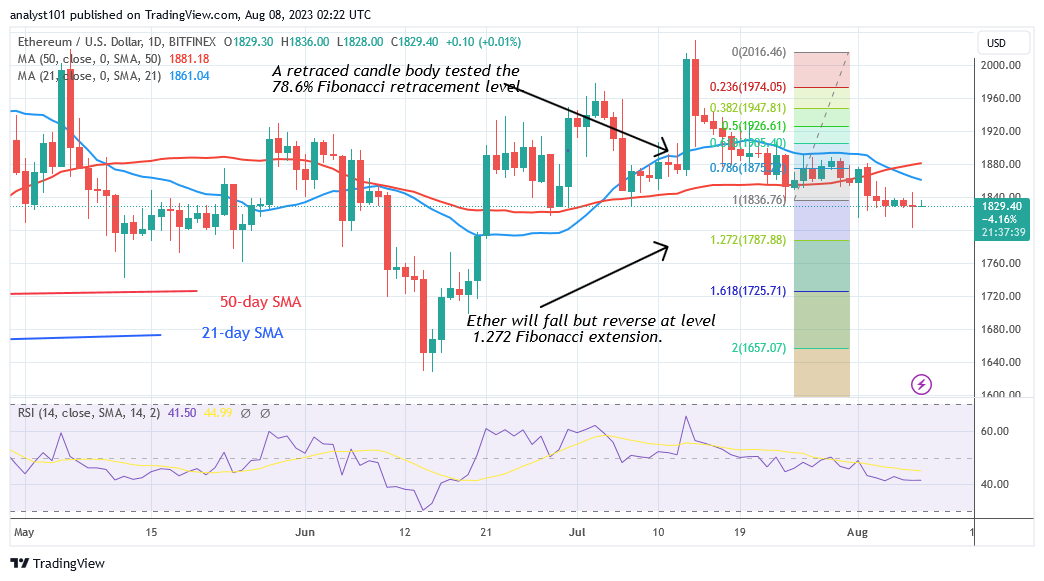
Ethereum Price Long-Term Analysis: Bearish Ethereum (ETH) price has plunged to a low of $1,802 after falling below the 50-day simple moving average (SMA) but may recoup above $1,787. Following the breakdown, Ether has been consolidating above the $1,800 support level. The price indicator has indicated a likely reversal and further decrease.
Price movement is being limited by Doji candlesticks above the $1,800 support. On the downside, the price signal forecasts a drop and likely reversal to the 1.272 Fibonacci extension l level, or $1,787.88. In the meantime, Ether has been consolidating above the $1,800 support level for the previous week.
ETH/USD – Daily Chart
Technical indicators: Major Resistance Levels – $2, 600, $2,800, $3,000 Major Support Levels – $1.600, $1, 400, $1,200
Ethereum Indicator Analysis The recent slump has pushed Ether to Relative Strength Index for period 14 level 41. The altcoin is declining since it is in a negative trend. The price bars have now fallen below the moving average lines, potentially increasing selling pressure. The positive momentum has been volatile, but it is still above the daily Stochastic mark of 50.
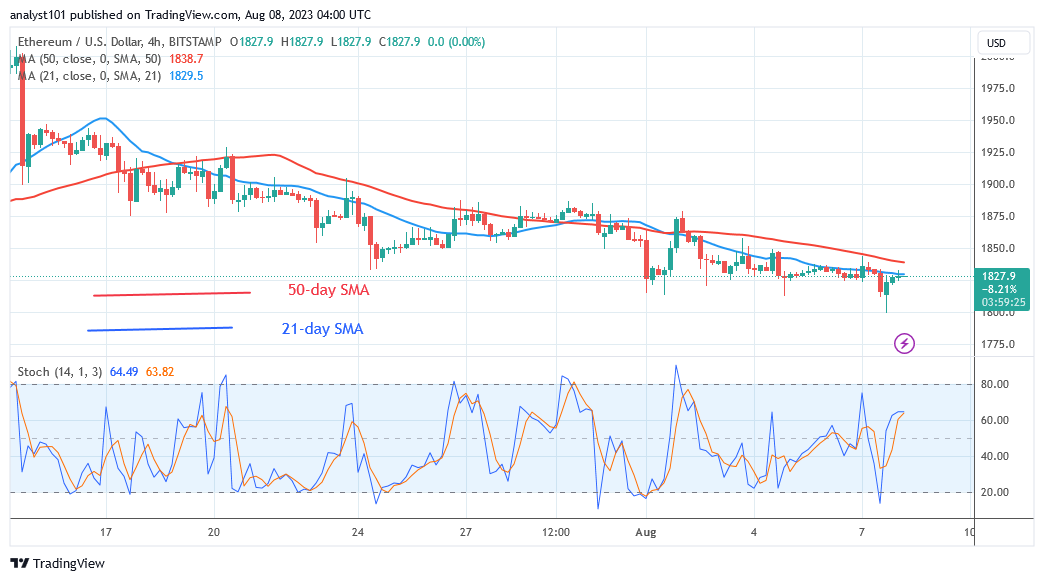
Conclusion On the 4-hour chart, Ethereum is in a downtrend but may recoup above $1,787. The cryptocurrency has been declining since July 14. Moving average lines have stopped the upward movement. Today, the resistance at $1,828 has repulsed the bullish momentum. Price movement has been stifled by the Doji candlesticks.
Note:Cryptosignals.org is not a financial advisor. Do your research before investing your funds in any financial asset or presented product or event. We are not responsible for your investing results
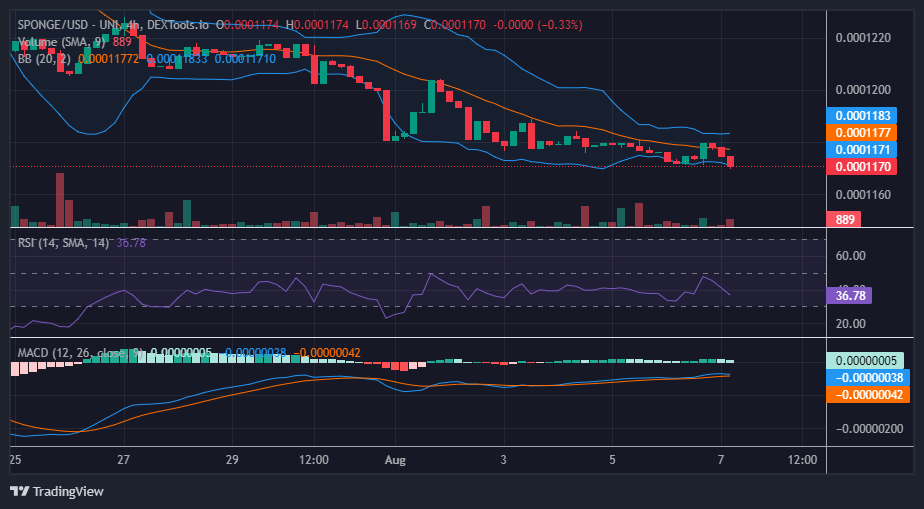
In the $SPONGE market, the price is currently exhibiting a period of consolidation, with the $0.0001175 price level acting as a significant point of interest. Bullish investors are making notable efforts to reverse the market’s direction from this level. However, it’s important to note that bearish pressure has caused a slight dip below the key demand level.
Despite this development, the bullish participants remain resilient and are still actively participating in the market, suggesting that the situation is far from being completely dominated by bears.
Key Levels
Resistance: $0.0004, $0.0045, and $0.0005.
Support: $0.00011, $0.00010, and $0.00009.
Sponge (SPONGE/USD) Price Analysis: The Indicators’ Point of View
For quite a while now, the $SPONGE market has been displaying a bearish trend in the Relative Strength Index (RSI). The momentum of the market has consistently fluctuated between the oversold section and the bearish section of the indicator, with occasional and brief bursts into the buy zone.
Traders and investors may act swiftly to secure profits during these brief bullish movements, which can lead to a return to the bearish zone once selling pressure resumes. The extended period of a flat market could be a contributing factor to the challenge of sustaining a bullish trend, as some buyers might promptly take their profits after holding long positions for an extended period in the market.
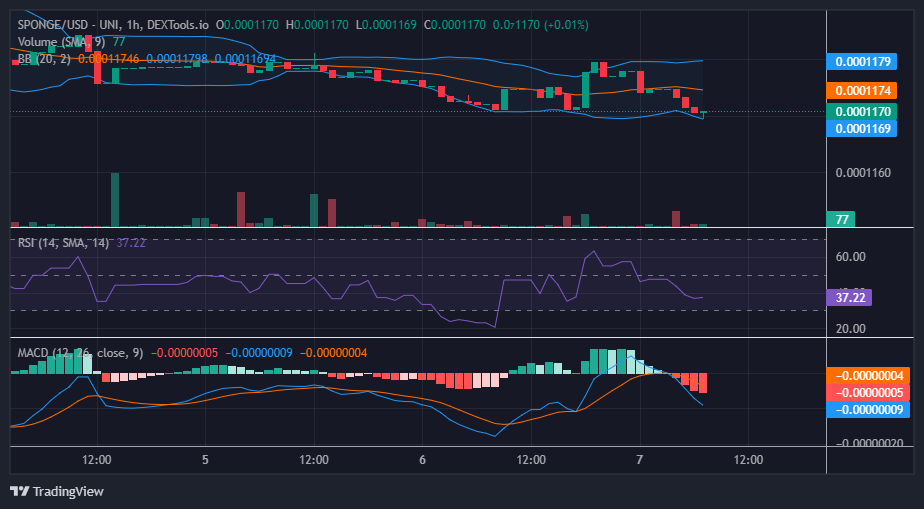
$SPONGE Short-Term Outlook: 1-Hour Chart
Furthermore, in terms of the 1-hour chart outlook, the market has maintained its eastward movement, although the price action has been oscillating around the 20-day moving average. The intermittent and brief bursts into the buy zone in the Relative Strength Index (RSI) could be attributed to short-term price corrections or temporary buying surges, where certain investors perceive potential value at specific price levels and capitalize on those opportunities. Nevertheless, these sporadic buy-side movements have not exhibited sufficient strength to sustain a lasting upward trend, resulting in the market returning to the bearish zone.
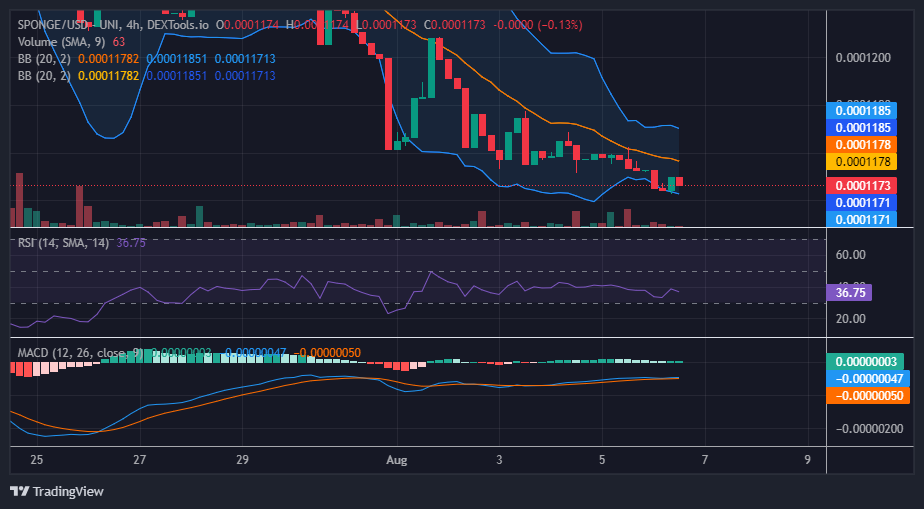
Despite the recent underperformance of the SPONGE/USD pair, there are indications that the market could be gearing up for a potential reversal. Analyzing the current price action and technical indicators, we identify several factors that may lead to a bullish scenario in the coming days.
Since the beginning of August, bulls have consistently kept the demand level at $0.0001177. This indicates strong buying interest at this price point, which could act as a significant support level for the pair.
Key Levels
Resistance: $0.0004, $0.0045, and $0.0005.
Support: $0.00011, $0.00010, and $0.00009.
Sponge (SPONGE/USD) Price Analysis: The Indicators’ Point of View
The recent appearance of a gravestone doji candlestick pattern is an encouraging sign for SPONGE/USD traders. This pattern, which reflects indecision in the market, is often seen as a potential reversal signal when it appears after a downtrend. It suggests that bears are losing strength, and a shift towards bullish activities could be on the horizon.
The RSI currently measures around 36.6, indicating that the market is not heavily oversold. While it is below the 50 threshold, the stability in the RSI suggests that selling pressure may be waning, providing a window of opportunity for bulls to regain control.
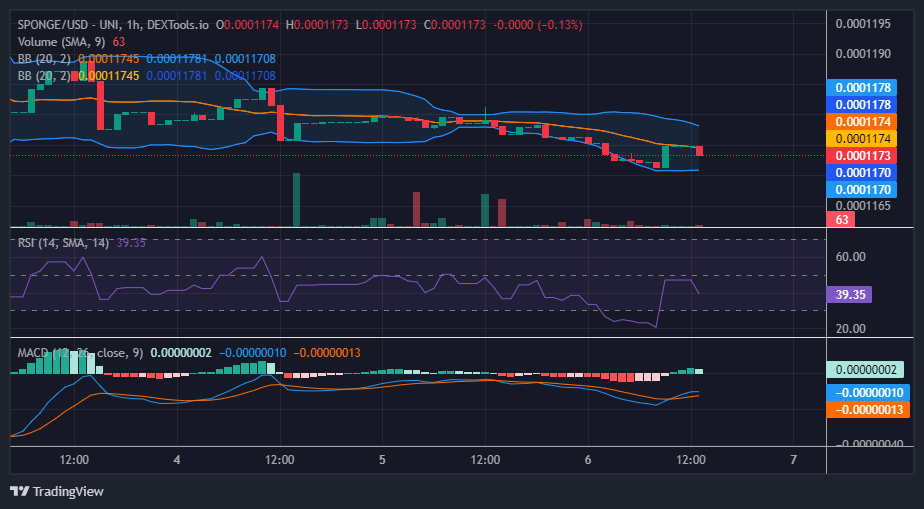
$SPONGE Short-Term Outlook: 1-Hour Chart
While the SPONGE/USD pair has been performing below expectations, the current technical analysis presents a mixed but cautiously optimistic outlook. The strong historical demand level, coupled with the appearance of the gravestone doji candlestick pattern and the bullish crossover of the MACD lines on this 1-hour timeframe, suggests the potential for a bullish trend to emerge in the near future.
Buy and sell this alluring MemeCoin now to join SPONGE in riding the wave.
Meme coins are becoming popular for making a lot of money, and Pepe Coin is one of the new stars. It’s known for changing a lot in value and potentially giving big rewards. Since April 2023, it has gone up by more than 2,645%, and now it’s the third biggest meme coin around.
Even though it looks fun, like the internet’s Pepe the Frog meme, lots of serious investors – about 130,000 – are interested in Pepe Coin. This year, Pepe Coin (PEPE) is standing out among meme cryptocurrencies. It started in April, and in just two weeks, it became worth more than $1 billion.
This guide will help you figure out where to buy Pepe coin and how to buy this popular meme coin. We’ll also look at how much Pepe Coin has cost in the past and talk about if it’s a good idea to invest in it.
What is Pepe Coin?
Pepe Coin is a meme coin that uses Ethereum’s blockchain and has become quite popular since it started in April 2023. It’s now ranked among the top 70 cryptocurrencies on CoinMarketCap. Pepe gets its name from the Pepe the Frog meme. But even though it’s connected to that meme, it’s important to know that the coin isn’t officially connected to the person who made the meme, Matt Furie.
Pepe’s official website jokes around, saying that Pepe is just for laughs and doesn’t really have any value for investing. Even though the website says that around 130,000 people have still decided to invest in this meme coin. It’s also available on big exchanges like Binance, Uniswap, Bybit, and Gemini.
Brief History of Pepe Coin
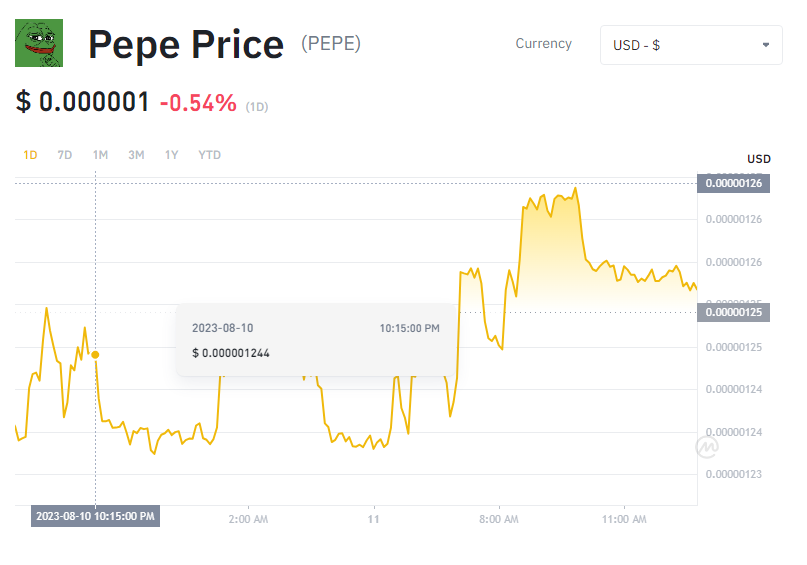
Unlike many new meme tokens, Pepe didn’t have an ICO. It went straight to exchanges on April 17, 2023, at a start price of about $0.000000001 per token. This popular crypto has around 420.69 trillion tokens. Its price shot up quickly,reaching a record high of $0.00000431 on May 5, 2023. That’s a huge increase of over 430,000% since it began.
But then, its price went down a bit. By May 12, it was trading around $0.00000126. Over the next months, Pepe mostly stayed around the same price. However, in late June, the price went up again. From $0.00000095 on June 20, it’s now at $0.00000150. In just a month, it went up by more than 65.5%.
With a value of over $630 million, Pepe Coin is the 70th biggest cryptocurrency in the world.
You can buy Pepe Coin on various crypto exchanges like KuCoin, Binance, CoinEx, Kraken, OKX, Bybit, gate.io, and MEXC.
When picking an exchange, make sure it’s available in your country. Some are better for holding, while others suit active traders. Check if the exchange has the features you need, like spot, margin, and futures trading.
KuCoin is great for altcoins, offering margin, futures, NFTs, lending, and staking. Low fees of 0.1%, and you can use USDT to trade Pepe Coin. They also take credit card payments.
Binance is huge, with margin, futures, NFTs, and a debit card. Fees are competitive (0.1%), but it’s not for US customers.
CoinEx lets you buy crypto privately, without long verifications.
Kraken is secure but has slightly higher fees, better for holding than day trading.
gate.io is for trading and serves many customers worldwide.
MEXC is user-friendly, charging 0% for spot and futures maker fees.
5 Easy Steps to Buy Pepe Coin Using OKX
After reading our Pepe Coin guide, you can decide if you want to invest in this new meme cryptocurrency. If you’re ready to buy Pepe now, follow these steps:
Step 1: Choose a Cryptocurrency Exchange
Pick a cryptocurrency exchange where you want to buy Pepe. You can use exchanges like Binance, OKX, Huobi Global, or KuCoin. This guide will show you how to use OKX.
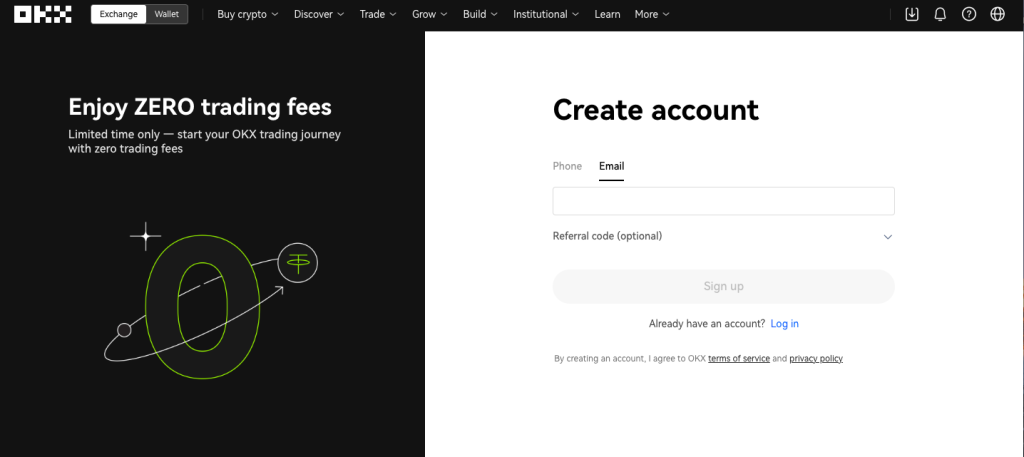
Step 2: Make an Account
Visit the OKX exchange website and click ‘Sign Up.’ Enter your email, name, and details. You don’t need to do a complex verification process right now. Verify your account by clicking the link in your email.
Img source: https://www.okx.com/join/1801002
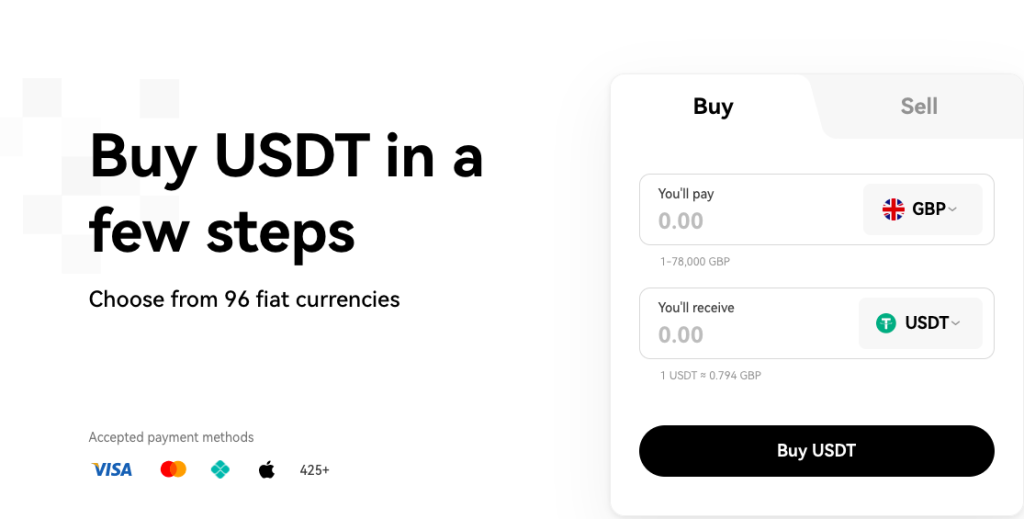
Step 3: Get USDT
On OKX, you can buy Tether (USDT) using various methods like VISA or MasterCard. You’ll need USDT to trade for Pepe.
Image Source: https://www.okx.com/join/1801002
Step 4: Find Pepe Coin
Once your account is ready, you’ll see a list of cryptocurrencies. Look for ‘Pepe’ under meme tokens and click on it. You’ll go to the token’s trading chart.
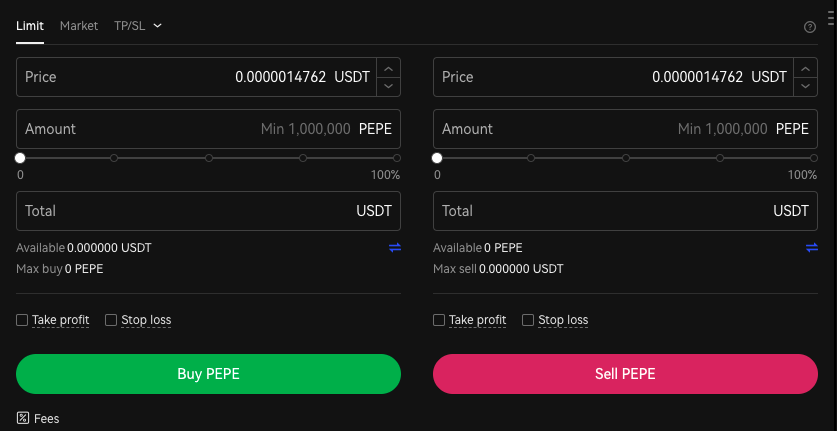
Step 5: Purchase Pepe
On the trading chart, you’ll see the current price. Enter the number of Pepe tokens you want to buy with your USDT. Click ‘Buy Pepe’ to confirm the trade.
Img Source: https://www.okx.com/join/1801002
How to Sell Pepe Coin?
Selling Pepe Coin is quite similar to buying it. You’ll decide between a limit or market order, as explained earlier. Also, choose the trading pair you want to use. Remember, selling might have fees like transaction or exchange fees. Check the exchange’s fee details before selling.
After selling, you can either take out money (if you used a crypto-to-fiat pair) or move crypto to another wallet (if you used crypto-to-crypto). Transferring between exchanges is easy. If you’re switching between Binance and KuCoin, or any other exchanges, it’s a straightforward process.
As Pepe Coin’s value has risen since its 2023 launch, should investors consider buying more Pepe? Read on to find out if investing in Pepe Coin is a good idea right now.
Currently, Pepe is trading around $0.0000015. Even though it’s gone up over 60% in the last month, it’s still over 65% below its highest price. Remember, meme tokens can be very risky in the crypto world.
After big price jumps, a drop like this is common. This might suggest another price increase could happen later. Also, the recent price rise could mean Pepe Coin is picking up after a few months of staying steady. Since the price is quite low, those willing to take higher risks might want to add Pepe to their investments.
Before investing in meme tokens, it’s important to research on your own and understand the risks involved.
Conclusion
This guide has explained where to buy pepe coin, how to buy Pepe coin, a new meme cryptocurrency. Even though it started in April 2023, Pepe quickly reached a market cap of $1 billion. There are over 420 trillion Pepe tokens, and they don’t have transaction taxes. Right now, the token’s price is around $0.0000015. This makes Pepe Coin stand out as a promising crypto in 2023.
In the world of meme coins, Pepe has found its place. It can give you big profits thanks to social media hype. But remember, investing in Pepe comes with normal crypto risks – prices can change a lot, and people might buy based on speculation. The Pepe Coin community is working on making the token more useful, which could make its future brighter.
To invest smartly, know how much risk you’re comfortable with and keep up with market changes. With thousands of cryptos out there, staying ahead means knowing about new ones with high potential.
FAQs
Should I buy, sell or hold Pepe Coin?
Deciding on buying, selling, or holding Pepe depends on your investment plan. But, looking at fundamental and technical analysis can give you a better idea of what to do.
What’s the total supply of Pepe Coin?
Pepe Coin has 69.420 trillion tokens. But, some tokens get burned in transactions, so the supply goes down over time.
Can Pepe Coin get to $0.01?
For Pepe Coin to reach $0.01, it has to go up by more than 666,000%. This is a big increase and might not happen soon.
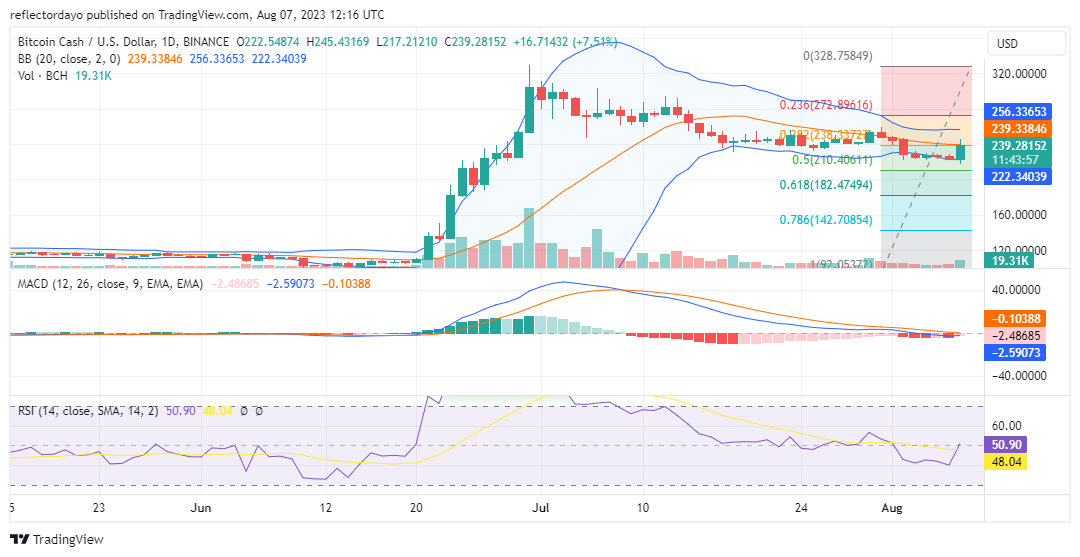
The Bitcoin Cash market has been in a downtrend since June 30, after reaching a high of $329. However, the bearish trend was not devoid of bullish bias, as the presence of bulls in the market slowed down the decline throughout July.
In today’s market, it appears that the bull market has found solid support at the $220 price level. Notably, we observed a significant bullish candlestick, representing a strong bull market emerging from this support level.
BCH Market Data
BCH/USD Price Now: $240.83
BCH/USD Market Cap: $4,659,458,427
BCH/USD Circulating Supply: 19,469,838 BCH
BCH/USD Total Supply: 19,469,838 BCH
BCH/USD CoinMarketCap Ranking: #16
Key Levels
Resistance: $256, $280, and $300.
Support: $210, $200, and $190.
Price Prediction for Bitcoin Cash: The Indicators’ Point of View
The Bitcoin Cash market is experiencing a bounce-back at the 50% (or 0.5) Fibonacci retracement level, currently at the $210.4 support level. The long-term price retracement, which commenced on June 30, has taken considerable time to retrace halfway of the last bull run, presenting a potential point for the market to rally.
Based on analysis using three indicators, it is evident that the market has now retraced back to equilibrium, signifying a significant step in the recovery process. With demand and supply now balanced, bulls need to exert more effort to establish a rally. Traders should closely monitor the market, as it needs to rise well above the 20-day moving average to confirm an upside retracement. If the market remains in equilibrium, there is a possibility of a consolidation trend.
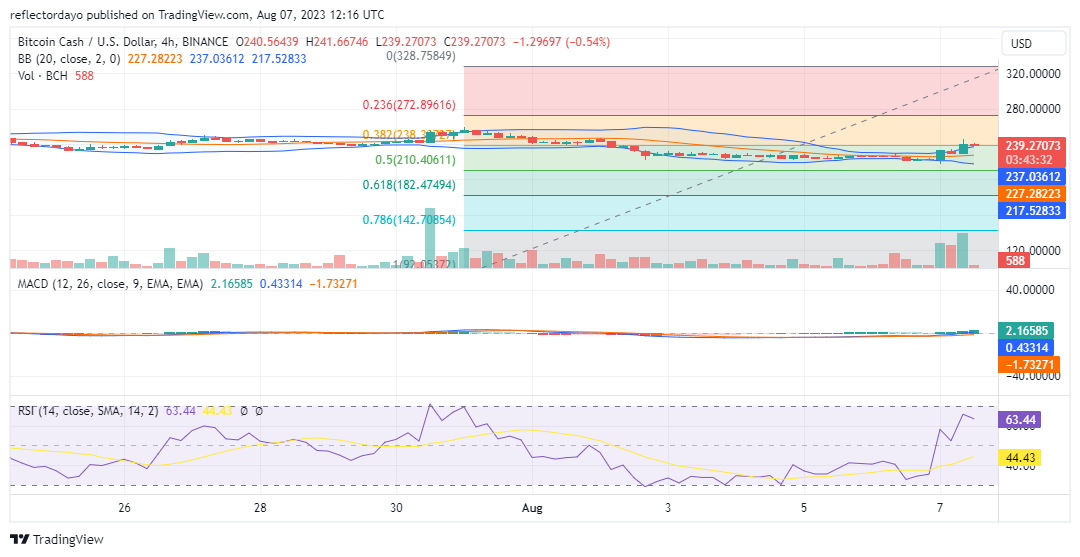
BCH/USD 4-Hour Chart Outlook
The Bitcoin Cash market has experienced a significant breakout from the previous consolidation trend around the $225 price level. The upside breakout was initiated when the market dropped below the $220 price level. During this breakout, trading volume surged as investors seized the opportunity to buy at the lower price.
However, the market encountered resistance near the $240 price level, which is currently acting as a significant obstacle. Both support and resistance levels are converging, and if bulls are unable to overcome the $240 resistance level, the market might consolidate within the $240 price zone.
Layer 1 blockchains are the base of the cryptocurrency ecosystem. Scalable blockchains like Ethereum, Solana, and Cardano have played a key role in the advancement of notable Decentralized Finance technologies like Non-Fungible Tokens and will keep doing so. Consequently, this sector of the cryptocurrency ecosystem has received billions of dollars from investors over the past five years.
There will surely be merits and demerits. Nevertheless, the volatile nature of the traditional Leyer-1 cryptos always attracts regulatory bodies in the United States and Europe. And, except for ETH and BTC, the Security Exchange Commission (SEC) is taking a hostile stance against all the famous Layer-1 chains.
Blockchains atLayer 1 (L1) are what really support emerging cryptocurrency marketplaces. With the first-ever functional Layer-1 protocol, Bitcoin set the bar high. But this came with more advanced and scalable chains like Ethereum, which have now become more advanced in their technology and design.
Besides the fact that Bitcoin is a very lucrative asset and Layer-1 project, other projects such as ETH (Ethereum), SOL (Solana), and ADA (Cardano) provide other varied benefits. Nevertheless, the future of other Layer-1 projects seems rather unclear. This is mainly because the competition between them is too tough, or because of some inherent weakness or growing pressure from regulatory bodies.
Three Leading Layer-1 Projects by Market Capitalization
Ethereum (ETH)
As the second-biggest blockchain by market capitalization, Ethereum is well-known to all crypto users. Initially, the Ethereum blockchain started as a PoW (Proof-of-Work) chain, developed by Vitalik Buterin and some other programmers.
Due to its outstanding support for smart contracts and decentralized applications that can address real-world issues, Ethereum is highly popular. Ether (ETH), the second-largest cryptocurrency by market cap, is the blockchain’s original asset.
Ethereum started a transition from Proof of Work to Proof of Stake (PoS) in 2020 due to growing network congestion and expensive transaction fees (gas). In April 2023, the last network update (the Merge) was finished.
BNB Chain (BNB)
The BNB Chain was launched in 2020 and was initially referred to as the BNB Smart Chain. It was launched by Binance, which is a crypto exchange and the biggest one at that. It is true that Binance itself is a centralized exchange, but the Binance Chain was created to be non-centralized, and its blockchain doesn’t require any permission.
Before being upgraded to a legitimate cryptocurrency on its native Layer-1 project, BNB was first designed as an ERC-20 token on the Ethereum network. People think of BNB Chain and BNB as rivals to Ethereum and ETH, respectively.
BNB Chain offers DeFi, smart contracts, and scalable Layer-2 chains, just like Ethereum. The Layer-1 protocol also employs a PoS, and validators who provide liquidity and execute transactions are rewarded with Binance Coin.
The BNB Chain is very famous in other countries apart from the United States. Nevertheless, this organization has had its own share of hard times due to regulatory action in the United States.
The lawsuit that was filed against Binance earlier this year (2023) by the SEC has had a great impact on their ability to render their services to customers in the United States. Depending on the result, both the exchange and the BNB chain may have to pay more to operate and comply in the US. Other nations have done the same.
Cardano (ADA)
From 2017 to 2020, many more chains were launched, and they have improved scalability due to their PoS agreement mechanism. All these Layer-1 projects became known as a close substitute for Ethereum. This is because the Ethereum blockchain is now being weighed down by elevated transaction fees and network congestion.
The native token is called ADA in honor of Ada Lovelace, a pioneer of computer programming, while Cardano is named for an Italian genius from the 16th century. Cardano was a top contender among these protocols for the moniker “Ethereum Killer.”
Conclusion
The SEC in the United States is monitoring all other Layer-1 blockchains save the main two, bitcoin and Ethereum. Each of these tokens has a security label on it. Unregistered securities sales and trades may result in regulatory sanctions.
The affected layer-1 blockchain tokens are no longer available for trade or sale on a large number of US-based exchanges and platforms. If you have already invested, we strongly advise you to exercise caution before investing in L1s other than Bitcoin and Ethereum.