Ethereum Is Prone to Declines but May Recoup above $1,787
Estimated Reading Time: 2 minutes
Don’t invest unless you’re prepared to lose all the money you invest. This is a high-risk investment and you are unlikely to be protected if something goes wrong. Take 2 minutes to learn more
Ethereum Price Long-Term Analysis: Bearish
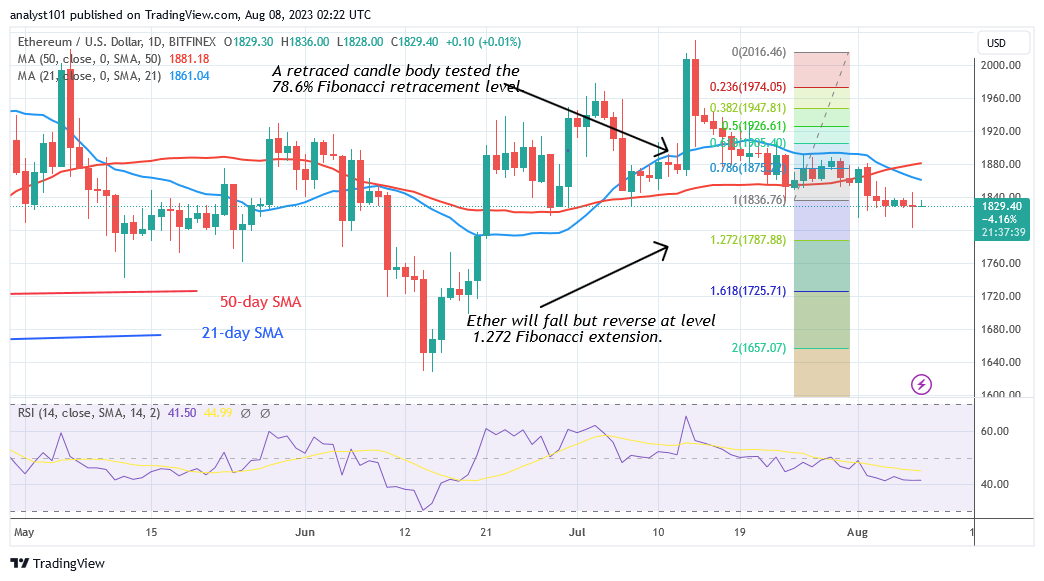
Ethereum (ETH) price has plunged to a low of $1,802 after falling below the 50-day simple moving average (SMA) but may recoup above $1,787. Following the breakdown, Ether has been consolidating above the $1,800 support level. The price indicator has indicated a likely reversal and further decrease.
Price movement is being limited by Doji candlesticks above the $1,800 support. On the downside, the price signal forecasts a drop and likely reversal to the 1.272 Fibonacci extension l level, or $1,787.88. In the meantime, Ether has been consolidating above the $1,800 support level for the previous week.
Technical indicators:
Major Resistance Levels – $2, 600, $2,800, $3,000
Major Support Levels – $1.600, $1, 400, $1,200
Ethereum Indicator Analysis
The recent slump has pushed Ether to Relative Strength Index for period 14 level 41. The altcoin is declining since it is in a negative trend. The price bars have now fallen below the moving average lines, potentially increasing selling pressure. The positive momentum has been volatile, but it is still above the daily Stochastic mark of 50.
Conclusion
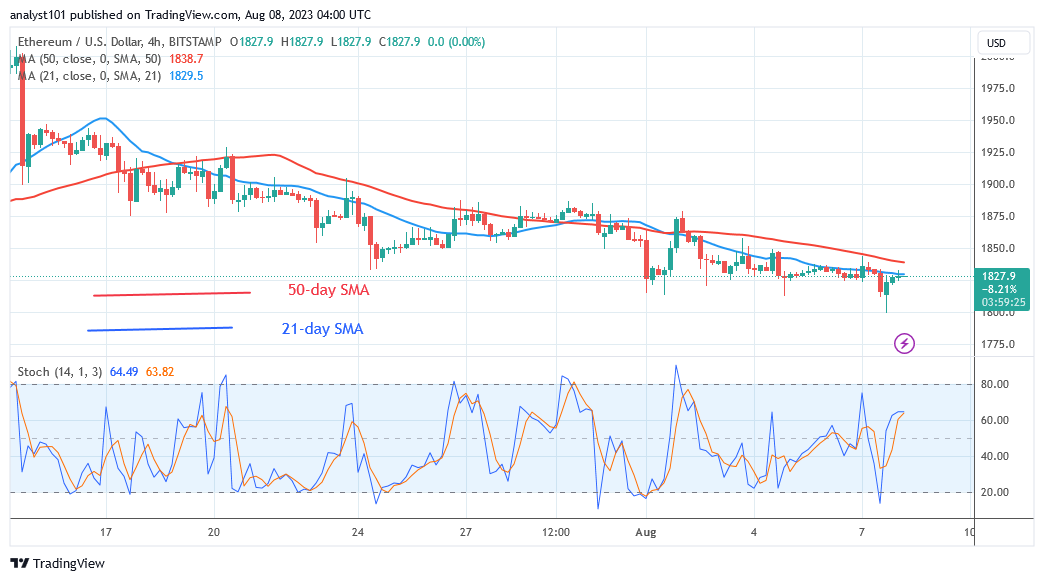
On the 4-hour chart, Ethereum is in a downtrend but may recoup above $1,787. The cryptocurrency has been declining since July 14. Moving average lines have stopped the upward movement. Today, the resistance at $1,828 has repulsed the bullish momentum. Price movement has been stifled by the Doji candlesticks.
You can buy crypto coins here. Buy LBLOCK
Note: Cryptosignals.org is not a financial advisor. Do your research before investing your funds in any financial asset or presented product or event. We are not responsible for your investing results