Open Interest in Crypto Futures: What Rising OI Can Tell Traders

Open interest, often shortened to OI, shows the total value of outstanding futures contracts that have not been closed. In crypto, it is especially useful because futures markets can drive short-term moves in Bitcoin, Ethereum, and major altcoins.

When open interest rises, more futures positions are being opened. That does not tell us whether they are long or short by itself. It simply shows leverage is building. When open interest falls, positions are being closed, liquidated, or reduced.

telegram

Free Crypto Signals Channel

More than 50k members
Technical analysis
Up to 3 free signals weekly
Educational content
telegram Free Telegram Channel

The key is combining OI with price. If price is rising and OI is rising, new money is entering the move. That can support a trend, but it can also mean leverage is becoming crowded. If price is rising while OI falls, the move may be driven by short covering rather than fresh long demand.

If price is falling and OI is rising, traders may be aggressively shorting or trapped longs may be adding risk. That can lead to continuation, but it can also create a squeeze if price reverses sharply. If price falls while OI drops, the market may be flushing leverage out.

High OI is not automatically bullish or bearish. It means conditions are more combustible. When too many leveraged traders cluster around similar levels, liquidations can accelerate the next move. This is why crypto can move violently after breaking obvious support or resistance.

Cryptocurrency Signals Monthly
£42
  • 2-5 Signals Daily
  • 82% Success Rate
  • Entry, Take Profit & Stop Loss
  • Amount To Risk Per Trade
  • Risk Reward Ratio
Cryptocurrency Signals Quarterly
£78
  • 2-5 Signals Daily
  • 82% Success Rate
  • Entry, Take Profit & Stop Loss
  • Amount To Risk Per Trade
  • Risk Reward Ratio
Cryptocurrency Signals Yearly
£210
  • 2-5 Signals Daily
  • 82% Success Rate
  • Entry, Take Profit & Stop Loss
  • Amount To Risk Per Trade
  • Risk Reward Ratio
arrow
arrow

Funding rates add another layer. If OI is rising and funding is very positive, long positions may be crowded. If price then fails to continue higher, a long squeeze becomes possible. If funding is deeply negative while OI is elevated, shorts may be crowded instead.

For beginners, the safest approach is to treat rising OI as a warning to be precise. Do not widen stops randomly. Do not chase late entries after a huge move. Look for clean structure, clear invalidation, and sensible risk.

Key takeaway:

Open interest shows leverage building or unwinding. It becomes most useful when combined with price action, funding rates, and key levels.

Educational content only. Not financial advice. DYOR.
Bitcoin (BTC) Clears the Resistance at the $65,000 Mark

Summary:

  •  BTC remains bullish above the 9-day EMA.
  •  MACD signals continued buying momentum.
  • Targets: $70,000, then $75,000–$80,000.

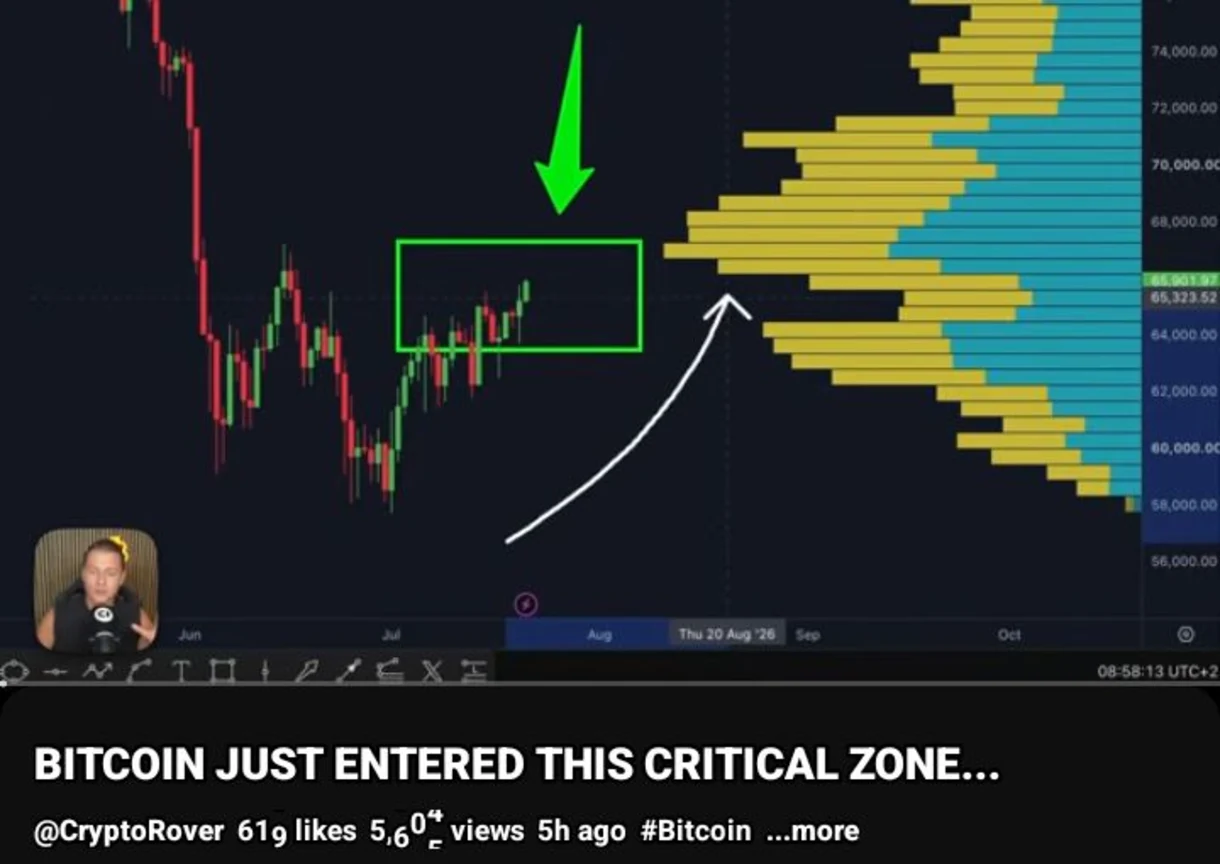
Bitcoin has maintained a steady upward trend since rebounding from the support around the $60,000 price level. Some analysts suggest that the coin has entered a critical phase, which could pave the way for further bullish momentum in the coming sessions.

Bitcoin (BTC) Clears the Resistance at the $65,000 Mark
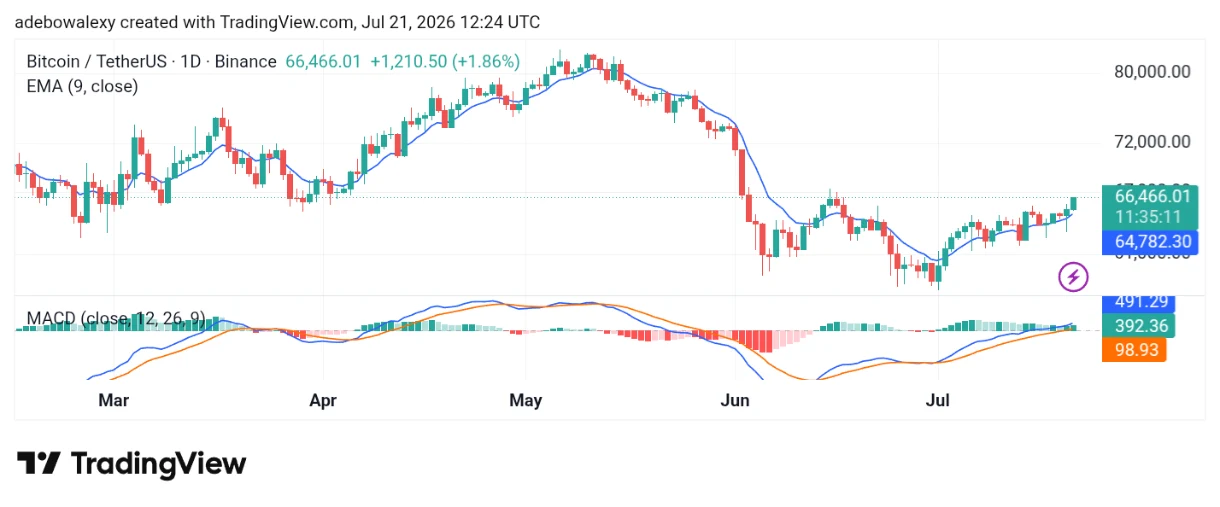
Bitcoin (BTC) Clears the Resistance at the $65,000 Mark. Source: TradingView

Bitcoin on the Daily Chart

Bullish momentum has remained dominant on the BTC/USDT daily chart since the beginning of the month. At the time of writing, the token is trading above the 9-day Exponential Moving Average (EMA).

Additionally, today’s price candle is bullish and has formed a strong body, indicating sustained buying pressure. Likewise, the Moving Average Convergence Divergence (MACD) indicator remains above the equilibrium level. The MACD histogram bars are also solid green, reflecting strong bullish sentiment in the market.

BTC/USDT Traders Still Eye Higher Targets

From the current market structure, Bitcoin traders are becoming increasingly bullish. This has pushed the token into a key technical position. The latest candlestick suggests that buyers remain firmly in control of the market.

Bitcoin (BTC) Clears the Resistance at the $65,000 Mark
Bitcoin (BTC) Clears the Resistance at the $65,000 Mark. Source: YouTube

Likewise, the MACD lines continue to rise above the equilibrium level, indicating that bullish momentum may still have room to strengthen and drive prices higher.

Bitcoin May Clear the $70,000 Barrier

Since rebounding on July 1, Bitcoin has maintained a consistent upward trajectory. The current trading session continues to hold comfortably above the 9-day EMA, reinforcing the prevailing bullish trend.

The MACD indicator also continues to show a positive trend, indicating that buying momentum remains strong. Consequently, the $70,000 price level appears to be within reach. If the current momentum persists, traders may begin targeting the $75,000 and $80,000 price levels as longer-term objectives.

Litecoin (LTC) Traders Anticipate a Bullish Market

Summary:

  • LTC remains bullish above the 9-day EMA.
  • MACD supports continued upward momentum.
  • Price may rally toward $55.

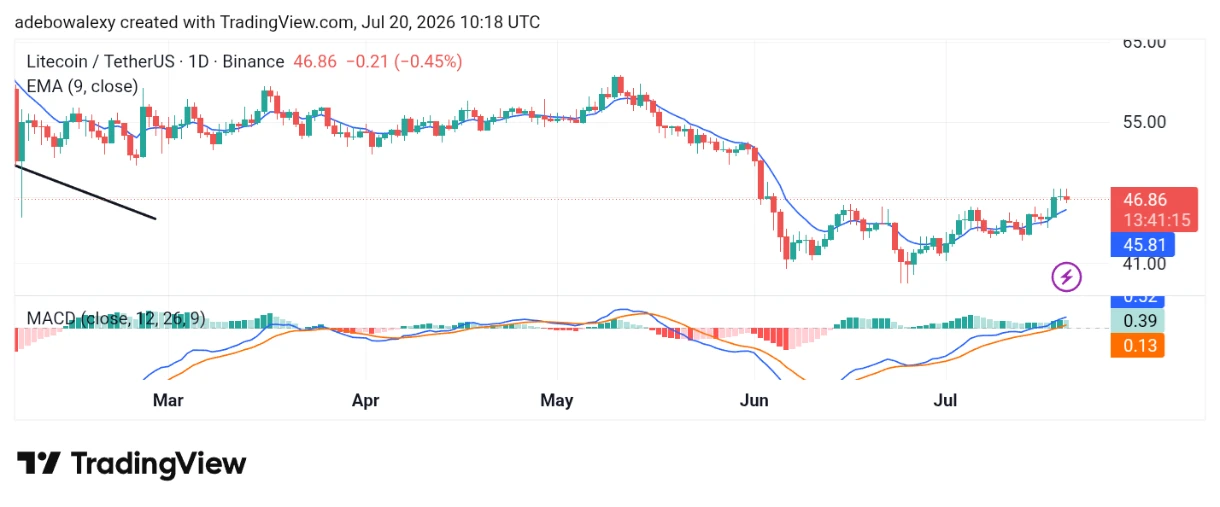
While technical indicators surrounding Litecoin suggest that bullish momentum remains in control, market sentiment is also aligning with this outlook. The market is currently trading at around $47, holding above a key technical support level. The coin has gained more than 6.5%, and further upside may still be on the horizon.

Litecoin on the Daily Chart

Looking at the LTC/USDT daily chart, it is clear that bullish momentum remains dominant. Although the latest candlestick is bearish, it continues to trade above the 9-day Exponential Moving Average (EMA).

Litecoin (LTC) Traders Anticipate a Bullish Market
Litecoin (LTC) Traders Anticipate a Bullish Market. Source: TradingView

Likewise, the Moving Average Convergence Divergence (MACD) indicator has crossed above the equilibrium level. In addition, the MACD histogram bars are now printing above the zero line, although the latest bar has turned light green, reflecting a slight slowdown in bullish momentum during the current session.

LTC/USDT Sees a Bearish Pullback but Remains on Course

A modest bearish pullback Today’s Litecoin market on the daily chart shows a modest bearish pullback. in today’s Litecoin market on the daily chart. Nevertheless, price action continues to hold above the 9-day EMA, indicating that buyers still maintain the upper hand and may continue pushing prices higher.

At the same time, the MACD lines remain above the equilibrium level. Although the histogram bars have turned light green, they are still positioned above the zero line, suggesting that bullish momentum remains intact. Consequently, the overall market outlook continues to favor the bulls.

Litecoin (LTC) Traders Anticipate a Bullish Market
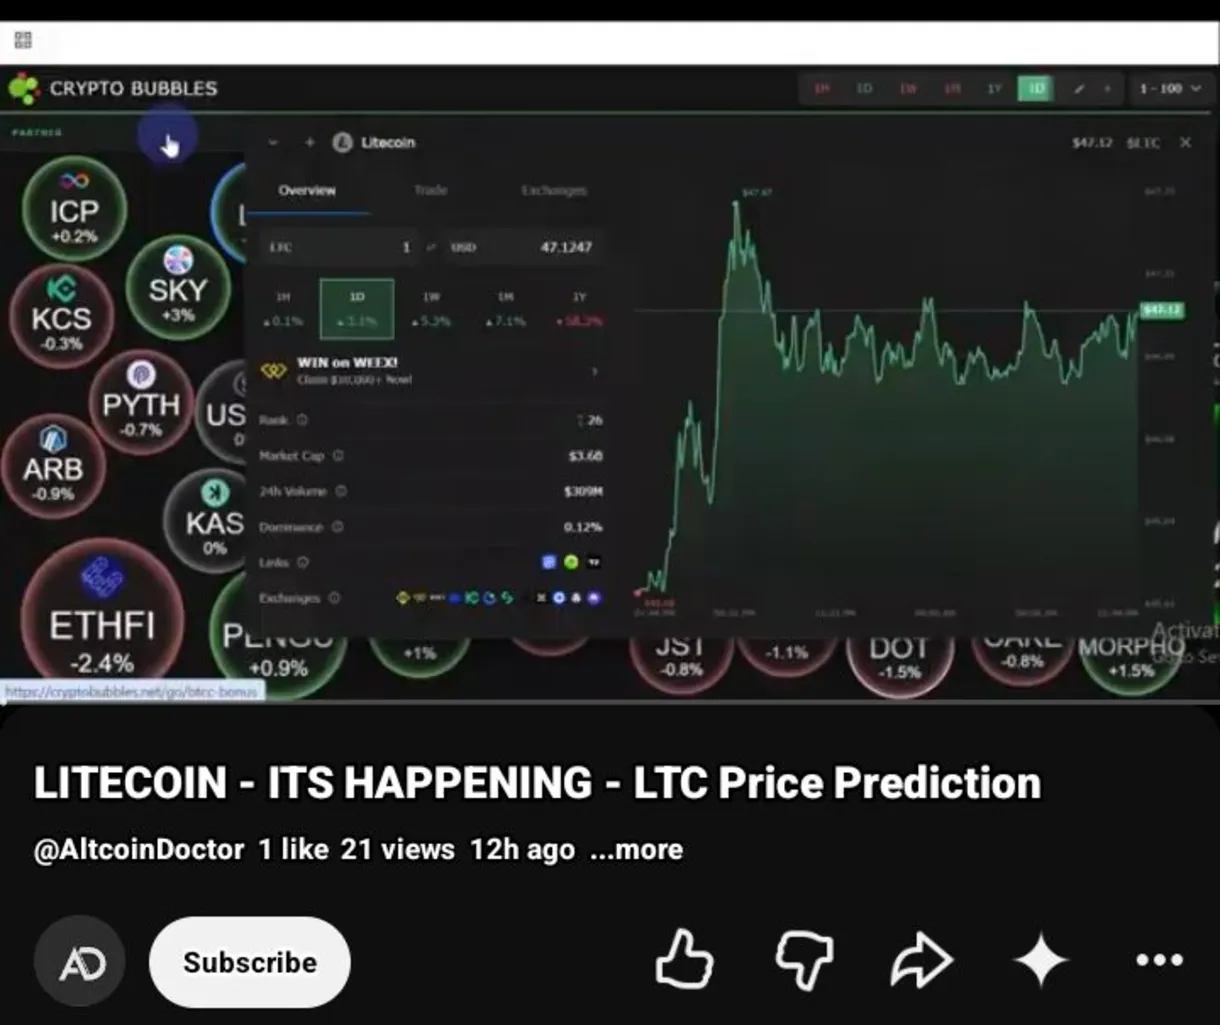
Litecoin (LTC) Traders Anticipate a Bullish Market. Source: YouTube

Litecoin May See a Significant Recovery Soon

A closer look at Litecoin’s recent price movement reveals a steady upward trend. This has been particularly evident since the market rebounded from the $41 support level.

Even now, price action remains above the 9-day EMA, as shown by the latest candlestick on the chart. This suggests that the market remains well-positioned for further gains. Therefore, traders may continue to target the $55 price level if bullish momentum persists.

Three High-Impact Events Every Crypto Trader Should Be Watching

Key Takeaways:

  • FOMC (July 28–29) could move crypto markets.
  • CLARITY Act faces a key Senate test.
  • July 31 options expiry may increase volatility.


Bitcoin’s chart makes this week look calm. Under the surface, three separate catalysts are converging over the next ten days that could decide whether that calm holds.

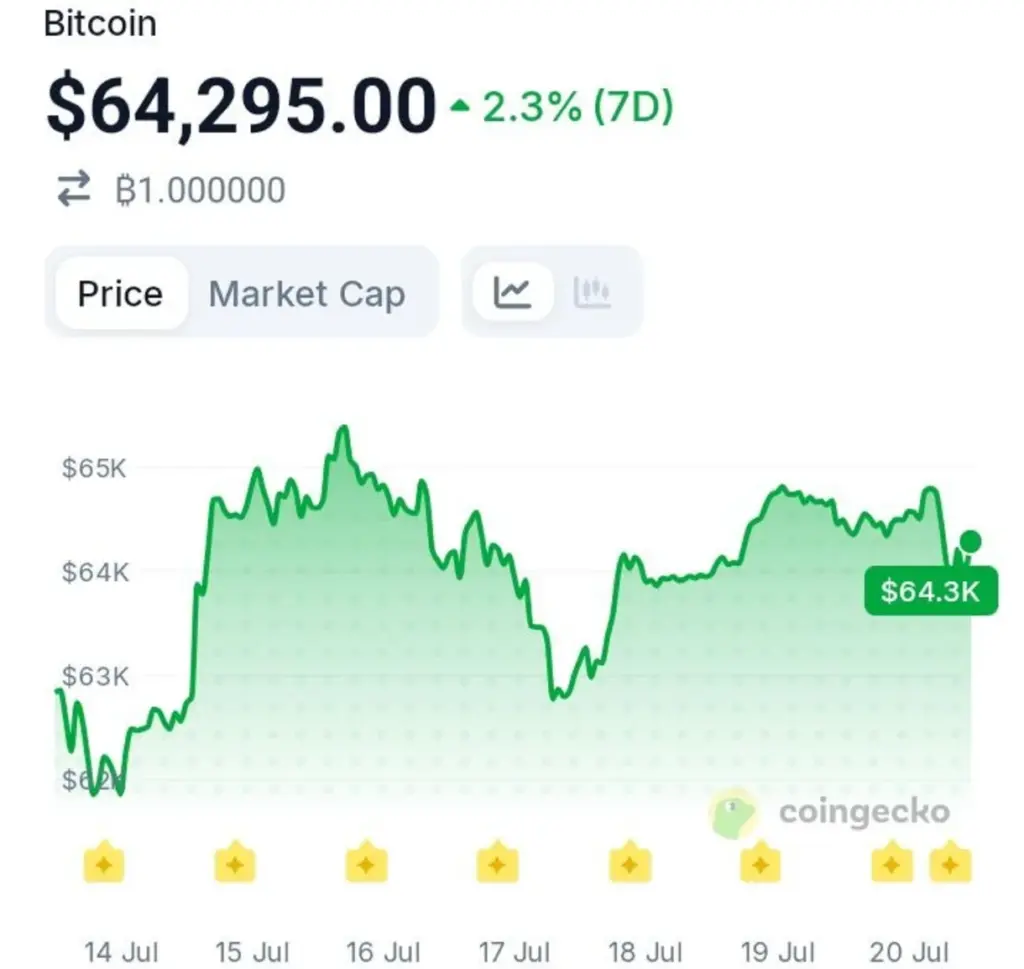
BTC trades at $64,295.00, up 2.3% over the past seven days, according to CoinGecko. The week’s climb from a July 14 low near $62,000 to a peak above $65,000 on July 16 has since settled into a tighter range, with price holding near $64,300 as of July 20. That stability sits ahead of a calendar that’s anything but quiet.

Three High-Impact Events Every Crypto Trader Should Be Watching
BTCUSD Weekly Chart. Source: CoinGecko.

1. The FOMC Meeting — July 28-29

The Federal Reserve enters its communications blackout this week ahead of the July 28-29 FOMC meeting, meaning no speeches or fresh guidance from policymakers until Chair Kevin Warsh’s press conference on July 29. This will be Warsh’s second meeting at the helm, with the federal funds rate having held at 3.50%-3.75% for four consecutive meetings. 

Traders are watching not just the rate decision itself but the language of the statement — Warsh’s approach has been described as “strategic ambiguity,” meaning tone may move markets more than the actual decision.

2. The CLARITY Act’s Senate Deadline

Crypto market structure legislation faces its last realistic window before the Senate breaks for recess. A merged Banking-Agriculture draft recently dropped an ethics provision Democrats had demanded, prompting several senators to formally oppose it — and prediction markets have cut the odds of 2026 passage to around 35%, down sharply from above 80% earlier this year. 

Three unresolved fights remain: the ethics standoff over officials profiting from crypto, a developer-shield provision that has split law enforcement, and stablecoin-yield language now drawing pushback from the banking lobby. Whether Majority Leader John Thune schedules floor time this week is the detail worth watching.

3. Deribit’s Monthly Options Expiry — July 31

Options positioning tends to create real price gravity around expiry dates, and July 31 brings the larger monthly BTC and ETH expiry on Deribit, following the smaller weekly expiries already completed on July 17 and July 24. Large monthly expiries often see increased volatility in the days leading up to settlement as market makers hedge concentrated positions, particularly when price is sitting near key strike levels the way Bitcoin is now.

Why the Sequence Matters

None of these events happen in isolation. A hawkish FOMC statement could pressure risk assets right as options positioning is already elevated heading into month-end, while a stalled CLARITY Act vote removes a potential structural tailwind the market has been pricing in since earlier this year. Layered together, the next ten days carry more consequence than the current price chart suggests — and traders who are only watching the ticker may be the last to see it coming.

Crypto Volume Profile: How Traders Find High-Interest Price Zones

Most traders look at volume bars under a chart, but volume profile shows volume by price instead of by time. That difference can be powerful. It helps traders see where the most activity happened and which price zones may matter in the future.

A volume profile displays horizontal bars along the price axis. Large bars show price levels where many coins changed hands. These are called high-volume nodes. Small bars show low-volume areas where price moved quickly with less trading activity.

telegram

Free Crypto Signals Channel

More than 50k members
Technical analysis
Up to 3 free signals weekly
Educational content
telegram Free Telegram Channel

High-volume zones often act like magnets. If Bitcoin traded heavily around $65,000 for several days, that area may become important later. Traders remember it, positions were opened there, and reactions can happen when price returns. It may act as support, resistance, or a consolidation zone.

Low-volume zones can behave differently. If price moved quickly through an area with little trading, it may move quickly through that area again. This is why some breakouts accelerate once they clear a major level. There may simply be less historic trading interest until the next high-volume area.

One useful concept is the point of control, often called POC. This is the price level with the highest traded volume in the selected range. If price is above the POC and holding, buyers may have control. If price is below it and failing to reclaim, sellers may be stronger.

Volume profile should not be used alone. A high-volume node does not automatically mean buy or sell. It means “pay attention here.” Traders can combine it with support and resistance, trend direction, candlestick reactions, and funding data.

Cryptocurrency Signals Monthly
£42
  • 2-5 Signals Daily
  • 82% Success Rate
  • Entry, Take Profit & Stop Loss
  • Amount To Risk Per Trade
  • Risk Reward Ratio
Cryptocurrency Signals Quarterly
£78
  • 2-5 Signals Daily
  • 82% Success Rate
  • Entry, Take Profit & Stop Loss
  • Amount To Risk Per Trade
  • Risk Reward Ratio
Cryptocurrency Signals Yearly
£210
  • 2-5 Signals Daily
  • 82% Success Rate
  • Entry, Take Profit & Stop Loss
  • Amount To Risk Per Trade
  • Risk Reward Ratio
arrow
arrow

For example, if Ethereum pulls back into a high-volume zone, funding is neutral, and price forms a higher low, that may be a cleaner setup than buying in the middle of nowhere. If price slices through the zone with heavy selling, the level has failed.

Key takeaway:

Volume profile helps traders identify where the market has previously shown interest. It does not predict the future, but it gives structure to entries, stops, and take-profit planning.

Educational content only. Not financial advice. DYOR.
While Others Waited, One Whale Quietly Bought $64 Million in BTC

Key Takeaways:

  • A whale bought $64M in BTC via Galaxy Digital.
  • The wallet has accumulated steadily for months.
  • Buying continued as Bitcoin stabilized near $64K.


Not every big buy comes with a press release. Sometimes it’s just a wallet, a handful of transfers, and a pattern only visible to someone watching the chain closely enough to notice.

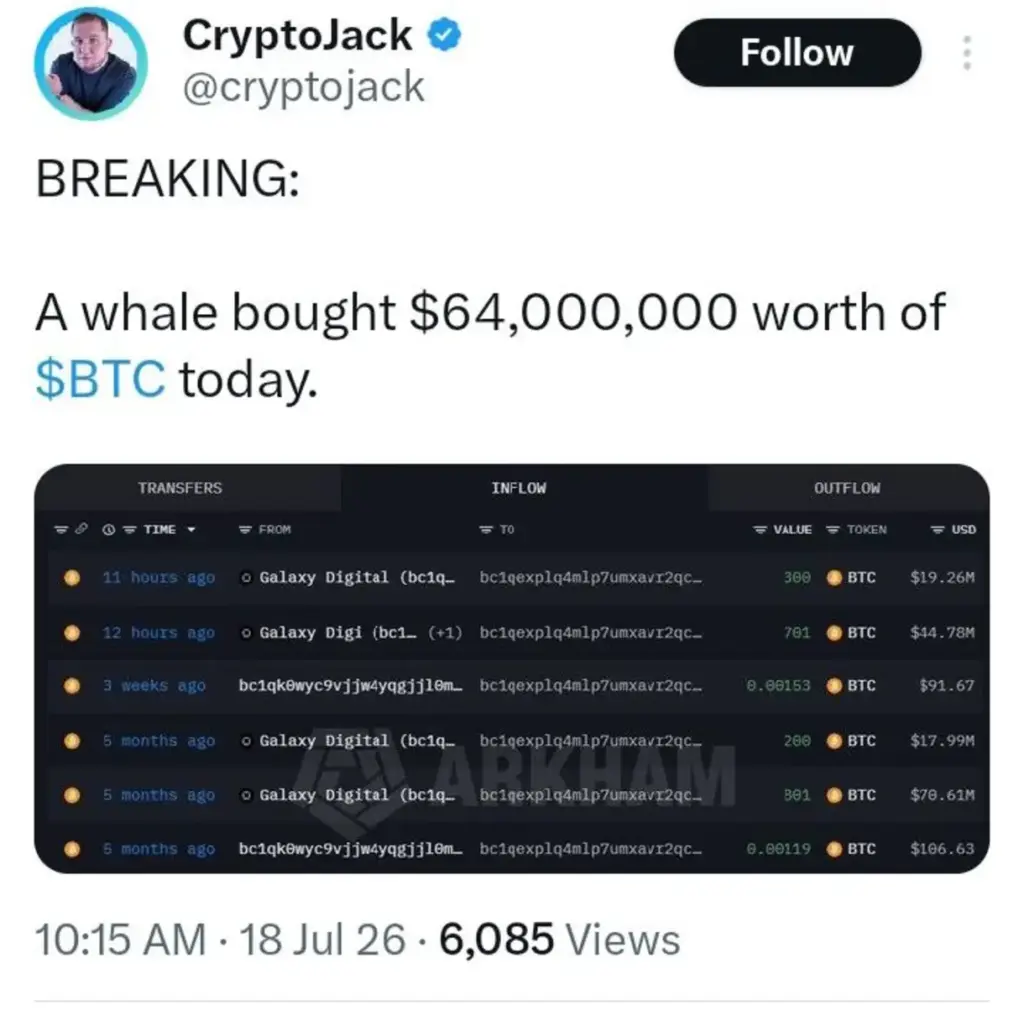
According to on-chain data shared by crypto commentator CryptoJack on July 18, 2026, a whale wallet has accumulated roughly $64 million worth of Bitcoin, based on inflow records pulled from Arkham Intelligence. The receiving address shows a series of transfers originating from Galaxy Digital-labeled wallets, including a 701 BTC deposit worth $44.78 million roughly 12 hours before the post and a 300 BTC deposit worth $19.26 million an hour later — together accounting for the bulk of the reported total.

While Others Waited, One Whale Quietly Bought $64 Million in BTC
Image Via X/CryptoJack.

A Pattern, Not a One-Off

What stands out in the Arkham data isn’t just the size of the two most recent transfers — it’s that they aren’t isolated. The same receiving address shows a history of similar inflows from Galaxy Digital-linked wallets stretching back roughly five months, including transfers of 200 BTC and 301 BTC at earlier points. That repetition suggests an entity that has used Galaxy Digital as a consistent counterparty for accumulating Bitcoin over time, rather than a single opportunistic purchase.

Galaxy Digital’s role here is worth noting on its own. As one of the largest institutional trading desks in crypto, wallets labeled to the firm typically represent OTC-style transactions moving size without hitting public order books directly — the kind of activity that can accumulate meaningfully before it’s ever visible on an exchange chart.

The Price Backdrop

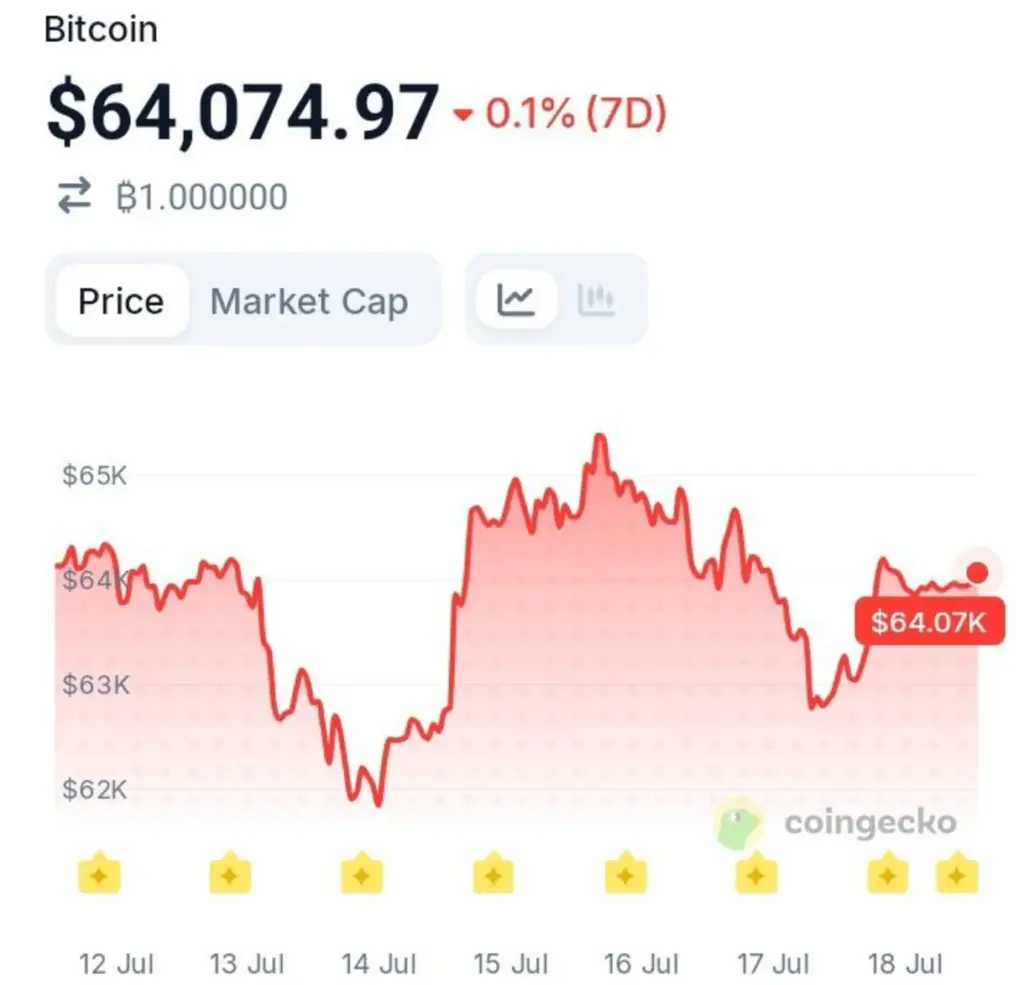
Looking at the seven-day chart, Bitcoin trades at $64,074.97, down a modest 0.1% for the week, according to CoinGecko. The chart shows a choppy path: BTC dipped toward $62,000 around July 14, then rallied sharply to a local peak just above $65,000 by July 16, before pulling back through July 17 and stabilizing near $64,000 into July 18. The whale’s most recent buys landed squarely in that stabilization window — accumulating not at the week’s low, but as price found its footing again.

While Others Waited, One Whale Quietly Bought $64 Million in BTC
BTCUSD Weekly chart. Source: CoinGecko.

Why This Kind of Flow Is Worth Watching

A single $64 million buy isn’t enough to move a market with Bitcoin’s liquidity on its own. But repeated OTC-sized accumulation through the same desk, over months, is the type of signal on-chain analysts watch precisely because it doesn’t show up as dramatically as an exchange deposit or a viral price spike. It’s a quieter form of conviction — the kind that only becomes visible in aggregate.

Whether this wallet keeps building its position or this marks a pause is the detail worth watching next. Either way, it’s a reminder that some of the most consequential positioning in this market happens away from the price chart entirely.

Cronos (CRO) Bulls Hold Their Ground Despite Facing a Pullback

Summary:

  • CRO remains bullish, supported by a double-bottom pattern and price above the 9-day EMA.
  • SRSI signals strong buying momentum, despite recent selling pressure.
  • CRO could target $0.07 short term, with $0.08–$0.10 possible longer term.

Sentiment surrounding the Cronos (CRO) token appears bullish. Some analysts speculated that the coin could experience a significant upward move. The current technical setup supports this outlook.

Cronos on the Daily Chart

On the daily CRO/USDT chart, price action has formed a double-bottom pattern, followed by a strong bullish recovery. The most recent sessions have encountered resistance, as reflected by the last two candlesticks.

Cronos (CRO) Bulls Hold Their Ground Despite Facing a Pullback
Cronos (CRO) Bulls Hold Their Ground Despite Facing a Pullback. Source / Cryptosignals : TradingView

Trading activity remains above the 9-day Exponential Moving Average (EMA), while the Stochastic Relative Strength Index (SRSI) continues to trend upward in the overbought region, suggesting bullish momentum is still intact.

CRO/USDT Maintains a Strong Bullish Position

Price action on the Cronos chart continues to hold above a key technical support level. The last two candlesticks indicate that the market is still trading comfortably above the 9-day EMA, providing additional support for the ongoing bullish momentum.

Although these recent candles show signs of price compression due to selling pressure, the SRSI remains pointed upward within the overbought region, with no bearish crossover. This suggests that buyers may still have enough strength to push the market higher.

Cronos (CRO) Bulls Hold Their Ground Despite Facing a Pullback
Cronos (CRO) Bulls Hold Their Ground Despite Facing a Pullback. Sources / Cryptosignals : YouTube

Cronos’ Long-Term Outlook

While the current market conditions may offer attractive short-term trading opportunities, the long-term outlook appears even more promising. Price action continues to hold above the 9-day EMA, indicating that buyers are defending their position.

Likewise, the SRSI remains firmly bullish, showing no signs of weakening momentum. Consequently, a short-term move toward the $0.0700 level appears achievable. Beyond that, traders may maintain a longer-term target around the $0.0800 and $0.1000 price levels if the current bullish momentum persists.

Ethereum (ETH) Holds a 5% Price Increase as Price Action Reverses from Resistance

Summary:

  •  Ethereum remains bullish after rebounding from $1,500.
  •  Price is testing 9-day EMA support as momentum weakens slightly.
  •  A move toward $2,500 remains likely if support holds.

The Ethereum market has seen a significant upward movement since rebounding from strong support at $1,500. Some predictions suggest that a major price rally may be on the way, as leading cryptocurrencies could experience a fresh wave of bullish momentum.

The Ethereum Daily Chart

On the 24-hour price chart, the ETH/USDT market is pulling back for the second consecutive session. This has brought the current session to test the support provided by the 9-day Exponential Moving Average (EMA).

Ethereum (ETH) Holds a 5% Price Increase
Ethereum (ETH) Holds a 5% Price Increase as Price Action Reverses from Resistance. Source / Cryptosignals : TradingView

Meanwhile, the Moving Average Convergence Divergence (MACD) indicator lines have risen above the equilibrium level at the 0.00 mark. Additionally, green but fading histogram bars remain visible above the equilibrium line.

ETH/USDT Market Stands on a Key Support Base

Ever since price action in the Ethereum market formed a double-bottom pattern at the $1,500 price level and advanced toward the $2,000 mark, the market has gained nearly $500. However, the downward rejection seen since the previous session has brought the market to a crossroads.

At this point, the prospects for a bullish continuation depend on whether buyers can defend the support provided by the 9-day EMA. For now, the MACD indicator remains bullish but shows signs of weakening, as reflected by the fading appearance of its histogram bars.

Ethereum (ETH) Holds a 5% Price Increase
Ethereum (ETH) Holds a 5% Price Increase as Price Action Reverses from Resistance. Sources / Cryptosignals : YouTube

Ethereum Stays on Course Toward Higher Price Levels

So far, price action has managed to withstand bearish pressure despite the pullback that has occurred since the previous session. As a result, the market continues to trade just above the 9-day EMA.

Likewise, the MACD indicator lines maintain a positive trajectory despite signaling some weakening momentum. Therefore, traders may continue to target the $2,500 price level over the medium term.

How to Read Crypto Market Structure: Higher Highs, Lower Lows and Trend Shifts

Market structure is the basic language of price action. Before adding indicators, traders should understand whether a coin is trending up, trending down, or moving sideways. The easiest way to do that is by reading highs and lows.

An uptrend usually forms higher highs and higher lows. Price pushes to a new high, pulls back, but holds above the previous low before continuing. That pattern shows buyers are stepping in earlier and accepting higher prices. In crypto, strong uptrends often move quickly, so waiting for pullbacks can help avoid buying into emotional spikes.

A downtrend usually forms lower highs and lower lows. Each bounce fails below the previous high, and sellers push price to new lows. In that environment, long trades become harder because rallies are often sold. Beginners frequently lose money by treating every drop as a bargain without checking whether the structure has actually changed.

Cryptocurrency Signals Monthly
£42
  • 2-5 Signals Daily
  • 82% Success Rate
  • Entry, Take Profit & Stop Loss
  • Amount To Risk Per Trade
  • Risk Reward Ratio
Cryptocurrency Signals Quarterly
£78
  • 2-5 Signals Daily
  • 82% Success Rate
  • Entry, Take Profit & Stop Loss
  • Amount To Risk Per Trade
  • Risk Reward Ratio
Cryptocurrency Signals Yearly
£210
  • 2-5 Signals Daily
  • 82% Success Rate
  • Entry, Take Profit & Stop Loss
  • Amount To Risk Per Trade
  • Risk Reward Ratio
arrow
arrow

A sideways market forms overlapping highs and lows. Price may bounce between support and resistance without a clear direction. These conditions can frustrate trend-following traders because breakouts often fail. In a range, patience matters. The best trades usually come near the edges of the range, not in the middle.

A market structure shift happens when the previous pattern breaks. For example, in a downtrend, price may stop making lower lows, reclaim a previous lower high, and then hold a higher low. That does not guarantee a new bull trend, but it shows sellers may be losing control.

Traders can improve structure reading by using multiple timeframes. A coin may look bullish on a 15-minute chart but bearish on the daily chart. Short-term traders can still trade smaller moves, but they should know whether they are trading with or against the bigger trend.

telegram

Free Crypto Signals Channel

More than 50k members
Technical analysis
Up to 3 free signals weekly
Educational content
telegram Free Telegram Channel

Volume can also confirm structure. A breakout with strong volume is more convincing than a breakout on weak activity. A breakdown with rising volume shows sellers are active, while a low-volume dip may simply be a pullback.

Key takeaway:

Market structure helps traders avoid guessing. Higher highs and higher lows favour buyers. Lower highs and lower lows favour sellers. Sideways structure calls for patience.

Educational content only. Not financial advice. DYOR.