Principles for Becoming a Professional Trader

Summary:

  • Mastery comes from discipline, not prediction.
  • Simplify your approach and master one strategy.
  • Control emotions and avoid unnecessary trades.

Mastering trading is often portrayed as the result of discovering the perfect strategy, accurately predicting market direction, or gaining a unique technical advantage. In reality, success is usually far less sensational. Professional traders are those who develop disciplined habits and cultivate a mindset that gradually transforms them from ordinary market participants into true professionals.

The principles outlined below are not traditional trading rules but guiding philosophies that shape a trader’s thinking, decision-making, and behavior over thousands of trades. They emphasize consistency over prediction, discipline over emotion, and continuous improvement over shortcuts. While no single principle guarantees success, together they provide the foundation for building reliable trading systems, sound judgment, and lasting confidence.

1. Become Addicted to the Process

Making money is not the primary motivation of exceptional traders. Instead, they are genuinely fascinated by the markets. They enjoy studying price action, analyzing trades, testing ideas, and refining their execution.

The profits they eventually earn are simply the by-product of their curiosity and commitment to continuous learning. Traders who genuinely enjoy the process consistently outperform those motivated solely by financial rewards.

Principles for Becoming a Professional Trader
Principles for Becoming a Professional Trader. Source / Cryptosignals : Google Images

2. Simplify Your Trading Environment

Many traders unknowingly clutter their decision-making with outdated indicators, incomplete strategies, conflicting opinions, endless news, social media commentary, and trading methods they neither trust nor consistently follow. Every unnecessary source of information creates another opportunity for doubt.

Professional traders deliberately keep their trading environment simple. Every chart, rule, and tool should serve a clear purpose. A clean trading workspace often leads to a clearer mind and more confident execution.

3. Master One Edge Before Chasing Another

Many traders struggle not because their ideas are ineffective, but because they pursue too many ideas at once. One day they trade breakouts, the next day they switch to mean reversion. Soon they move to options, AI stocks, scalping, or another strategy altogether.

Rather than constantly changing approaches, focus on mastering a single trading edge before exploring others. Commit to one strategy for at least three months and develop a deep understanding of how it performs under different market conditions. Mastery of one proven approach is far more valuable than having superficial knowledge of many.

Principles for Becoming a Professional Trader
Principles for Becoming a Professional Trader. Source / Cryptosignals : Google Images

4. Rewrite Your Trading Identity

A trader’s mindset The stories that traders repeatedly tell themselves often shape their mindset. by the stories they repeatedly tell themselves. Thoughts such as “I always panic,” “I never let my winners run,” “I always miss the best opportunities,” or “I can’t trust my decisions” can eventually become self-fulfilling.

Replace these limiting beliefs with empowering ones, such as “I am becoming a disciplined trader who follows my plan consistently.” “Setbacks are a natural part of every trading journey,” and “My responsibility is to execute my strategy, not predict the market.”

Every successful trader experiences losing streaks, periods of frustration, and moments of self-doubt. These are not signs of failure—they are milestones on the path to long-term competence and consistency.

5. Create a “Not-to-Trade” List

Professional traders know not only what they should do, but also what they should avoid. They don’t chase breakouts after extended moves, trade illiquid markets, increase position sizes after losses, abandon profitable systems because of opinions, or seek revenge after losing trades.

Long-term success often comes from the trades you deliberately choose not to take. Knowing both what to do and what to avoid is one of the defining characteristics of consistently profitable traders.
Solana’s Latest Milestone Could Signal a Major Shift in Tokenized Assets

Key Takeaways:

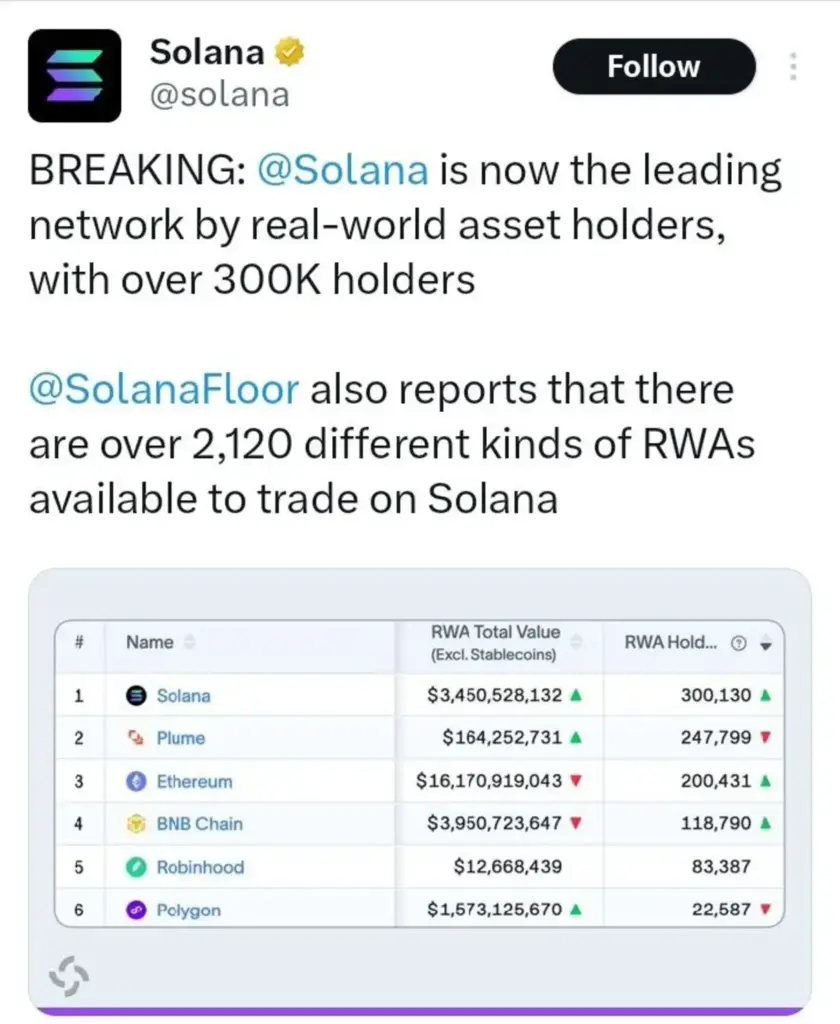
  • Solana now leads all blockchains in RWA holders, topping 300,000.
  • Retail-driven tokenized assets are fueling Solana’s rapid growth.
  • Ethereum still dominates total tokenized asset value.

When a network overtakes every other blockchain by user count in a single category, the market tends to ask what’s driving it — and whether the lead is durable. Solana just did exactly that in tokenized assets.

SolanaFloor reported that Solana has become the leading network by real-world asset holders, with the count surpassing 300,000 for the first time, according to data from RWA.xyz. The same report noted more than 2,120 distinct tokenized assets are now available to trade on Solana — the widest selection of any chain tracked by the platform.

Solana's Latest Milestone Could Signal a Major Shift in Tokenized Assets
Image Via X/Solana.

A Milestone Built On Users, Not Just Dollars

The 300,000 figure is significant because it measures something value totals can’t capture on their own: how many distinct wallets are actually participating. Solana’s RWA holder base has more than doubled in 2026, expanding from under 200,000 earlier in the year to its current record, according to RWA.xyz data. Ethereum, by comparison, holds around 200,000 RWA holders — meaningful, but no longer the leader on this specific metric.

Tokenized equity products have played a direct role in that growth. Assets like xStock, issued through the Backed protocol, give retail users on-chain exposure to names like Tesla and Nvidia — a distribution channel that has pulled in participants beyond the institutional players that typically dominate RWA activity.

Securitize CEO Carlos Domingo has pointed to this shift directly, describing tokenization’s growth as ultimately a distribution story, where asset value tends to follow wherever user activity is already concentrated.

What the Chart Did Around the Announcement

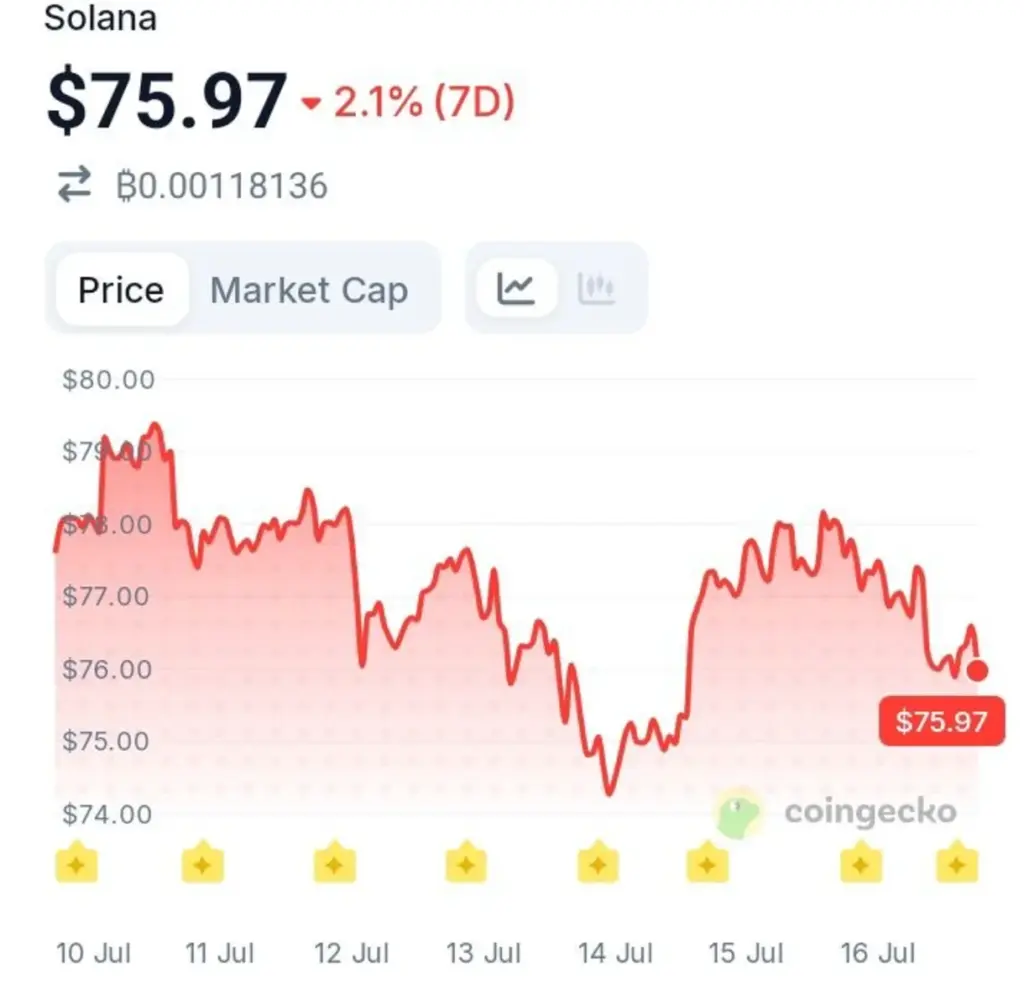
Data from CoinGecko shows SOL trading at $75.97 as of July 16, 2026, down 2.1% over the past seven days. The token opened the week near $78, spiked briefly above $79 on July 10, then slid into a rough stretch that bottomed near $74.20 on July 14. SOL clawed back above $77.80 by July 15 before easing into a pullback that brought it to current levels by midday UTC on July 16. 

Solana's Latest Milestone Could Signal a Major Shift in Tokenized Assets
SOLUSD Weekly Chart. Source: CoinGecko.

The RWA milestone landed in the middle of that recovery, with price showing no sharp reaction in either direction — suggesting the market hasn’t yet fully priced in what the holder lead could mean longer term.

Value Dominance Is Still Ethereum’s — For Now

The caveat is scale. Ethereum still holds roughly $16.1 billion in tokenized RWA value, more than four times Solana’s total, anchored by large institutional funds that haven’t shown signs of migrating. Holder count and value concentration are simply measuring two different adoption curves right now — one retail-led and expanding fast, the other institutional and more entrenched.

Whether Solana’s user lead eventually pulls institutional value in its direction, or whether the two networks continue serving separate corners of the tokenization market, is the dynamic worth watching as RWA activity accelerates through the second half of 2026.

Zcash (ZEC) Pushes Further North

Summary:

  •  ZEC has broken out of a symmetrical triangle, extending its bullish momentum.
  •  Price remains above the GMMA, while the SRSI signals continued buying strength.
  • Strong technicals and positive ecosystem developments could drive ZEC toward $1,000.

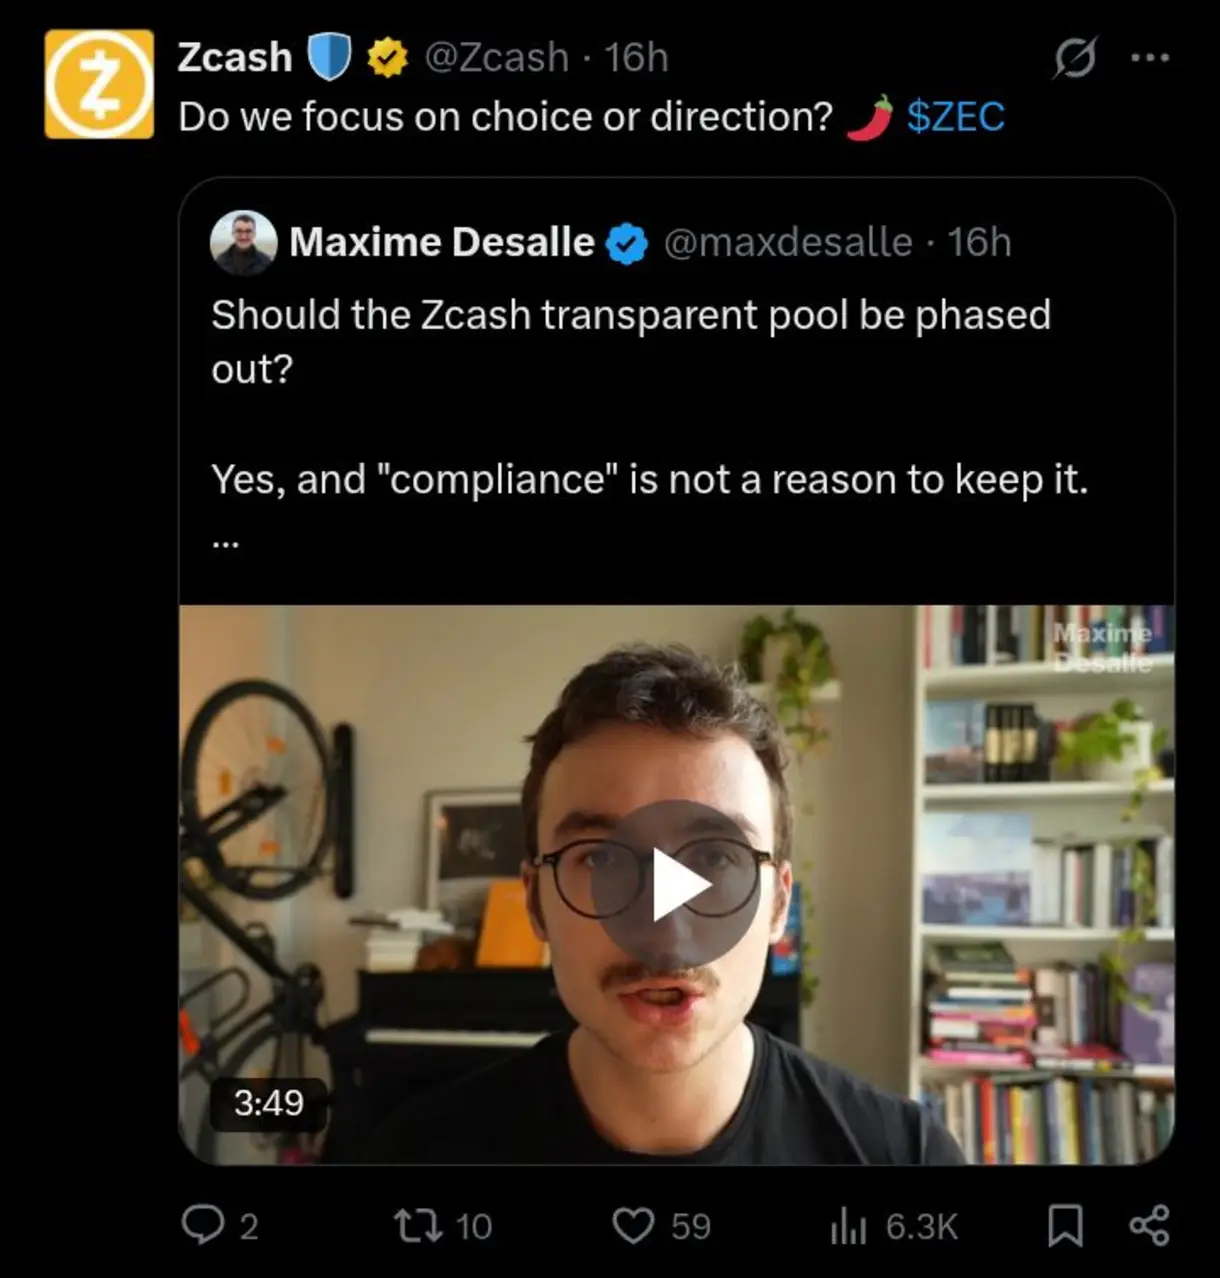
Even as the Zcash community continues to debate the proposed phase-out of transparent pools on the blockchain, the price of ZEC has continued to climb. Although the market previously formed a symmetrical triangle pattern, bullish momentum has ultimately prevailed.

Studying the Zcash 24-Hour Chart

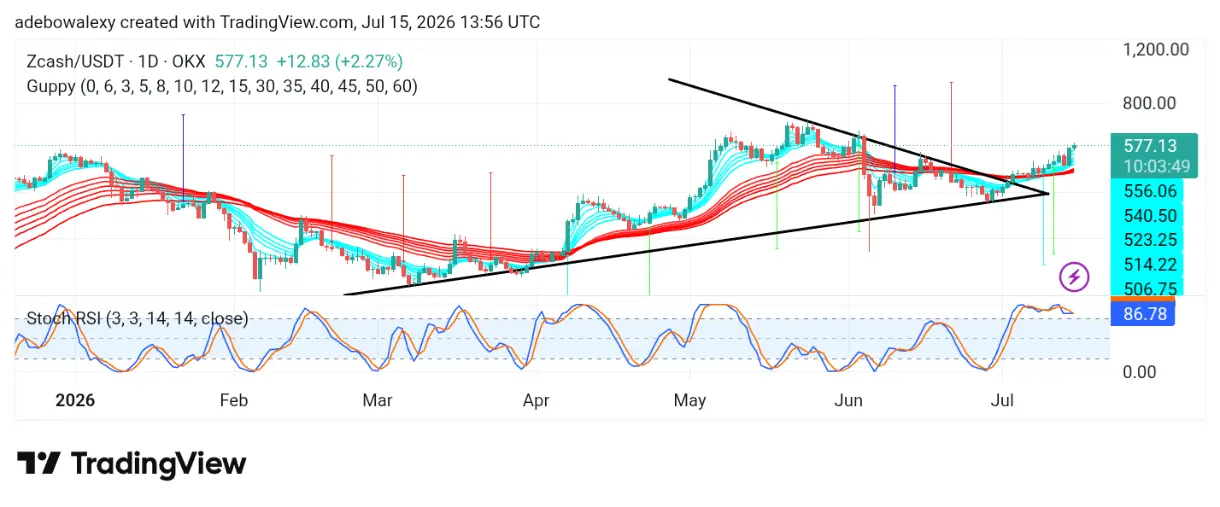
As mentioned earlier, the ZEC/USDT daily chart had formed a symmetrical triangle, a pattern that typically signals an equal probability of an upward or downward breakout. However, buyers have gained the upper hand, driving price action higher.

The latest candlestick keeps ZEC trading above the upper band of the Guppy Multiple Moving Average (GMMA), reinforcing the bullish outlook. Meanwhile, the Stochastic Relative Strength Index (SRSI) previously pulled back from the 100 level but has now converged for another bullish crossover within the overbought region, suggesting that buying momentum remains strong.

Optimism Remains Strong in the ZEC/USDT Market

Price action broke above the upper boundary of the symmetrical triangle several sessions ago and has continued to advance. The latest candlestick remains above all the GMMA lines, confirming that buyers are still in control.

Zcash (ZEC) Pushes Further North
Zcash (ZEC) Pushes Further North. Source / Cryptosignals : TradingView

At the same time, the convergence of the SRSI lines has renewed bullish sentiment. As a result, ZEC appears well-positioned to continue its advance toward the $800 price level in the near term.

Zcash Targets Higher Resistance Levels

Overall, the technical outlook for ZEC remains constructive. The recent bullish convergence of the SRSI has strengthened expectations of continued upside momentum.

Zcash (ZEC) Pushes Further North
Zcash (ZEC) Pushes Further North. Source / Cryptosignals : X.com

In addition, the ongoing discussions surrounding the proposed removal of transparent pools have drawn increased attention to the Zcash ecosystem. Given the blockchain’s strong emphasis on privacy, these developments could reinforce investor confidence and support further price appreciation. If bullish momentum persists, ZEC may continue its rally toward the $1,000 price level.

JPMorgan Just Issued a Warning That Could Shake Two Crypto Giants

Key Takeaways:

  • JPMorgan cut earnings forecasts for Circle and Coinbase over the Hyperliquid-USDC deal.
  • Hyperliquid’s revenue-sharing model is squeezing USDC profit margins.
  • USDC adoption is growing, but profitability is under pressure.


When a bank the size of JPMorgan cuts earnings forecasts for two of crypto’s most prominent public companies on the same day, the market pays attention — especially when the culprit is a deal both firms signed to grow, not shrink, their business.

CoinMarketCap reported on July 15, 2026 that JPMorgan cut earnings estimates for both Circle and Coinbase, citing pressure from Hyperliquid’s USDC revenue-sharing arrangement. Under the revised structure, Coinbase now classifies USDC held on Hyperliquid as “on-platform,” collecting the reserve income generated by those deposits but paying 90% of it directly to Hyperliquid — a sharp departure from the near-even split Coinbase previously maintained with Circle.

JPMorgan Just Issued a Warning That Could Shake Two Crypto Giants
Image via X/CoinMarketCap.

A Deal Meant to Grow USDC Is Now Squeezing Its Own Partners

The arrangement traces back to May 14, 2026, when Circle and Coinbase announced their partnership with Hyperliquid to deepen USDC integration across the exchange’s spot and perpetual futures markets. Since June 11, USDC has held the position of Hyperliquid’s preferred stablecoin. 

That adoption came at a cost: analysts led by Kenneth Worthington described the resulting economics as a “prisoner’s dilemma,” one that pushes Circle and Coinbase to compete against each other for USDC distribution rather than share in its growth together.

JPMorgan estimates Hyperliquid now holds roughly $6 billion in USDC — about 8% of the stablecoin’s entire circulating supply. That’s no longer a marginal distribution channel. It’s large enough that the terms Coinbase offered to secure it are reshaping how much revenue both companies can expect to keep.

The Numbers Behind the Downgrade

The pressure isn’t isolated to the Hyperliquid deal. JPMorgan also pointed to a broader slowdown: total crypto market capitalization fell 13% during the quarter, spot trading volume dropped 24% quarter-over-quarter, and USDC’s circulating supply has slipped to around $73 billion from nearly $80 billion in March. That’s part of a roughly $10 billion contraction across the entire stablecoin market since May, as trading activity cooled and regulated competitors chipped away at both USDC and USDT’s dominance.

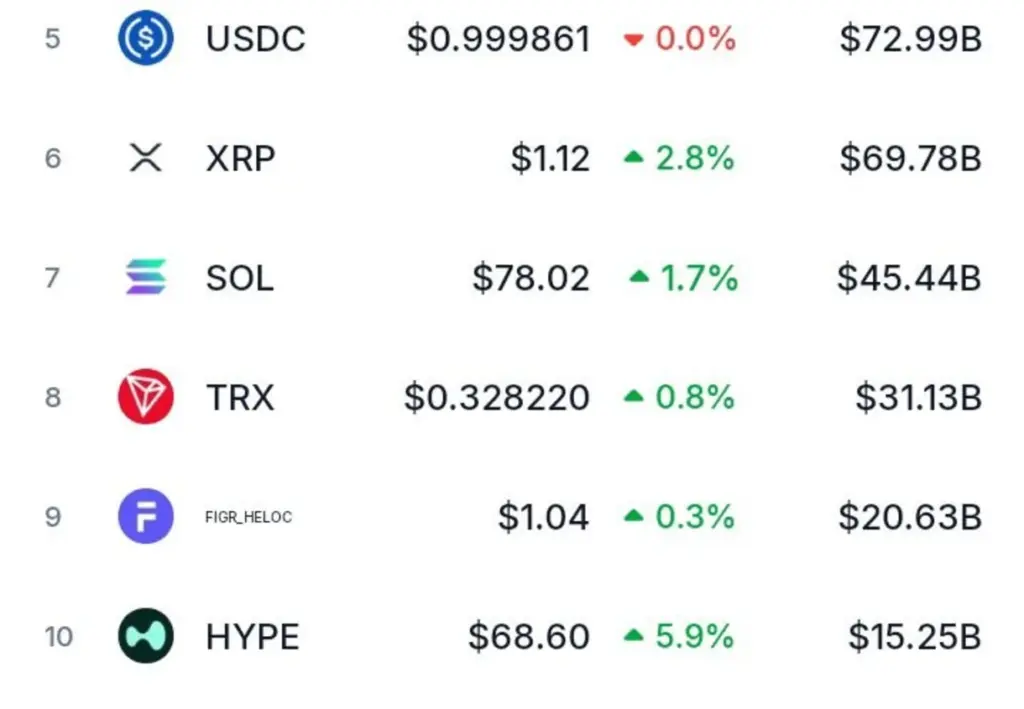
Looking at the market snapshot from CoinMarketCap on July 15, 2026, USDC trades at $0.999861, essentially flat on the day, while HYPE stands out as the strongest mover among major tokens, up 5.9% to $68.60 — a reminder that what pressures Circle and Coinbase’s margins may be doing the opposite for Hyperliquid’s own token.

JPMorgan Just Issued a Warning That Could Shake Two Crypto Giants
Market Outlook. Source: CoinMarketCap.

Growth Versus Margin, Not Growth Versus Decline

JPMorgan isn’t calling USDC’s long-term story broken. The bank still expects USDC-related earnings to grow through 2027, aided by an anticipated 25 basis point Federal Reserve rate increase in October that would boost income on the reserves backing the stablecoin. The concern is narrower and more structural: as more platforms the size of Hyperliquid negotiate similar terms, Circle and Coinbase may keep expanding USDC’s reach while retaining a shrinking share of the profit that comes with it.

Whether this becomes the template other major venues use to negotiate their own USDC terms — or a one-off concession to lock in the largest distribution partner available — is the question that will decide how much of this quarter’s downgrade turns out to be temporary.

While Retail Sells, Cardano Whales Keep Buying—Here’s Why It Matters

Key Takeaways:

  • Cardano whales continue accumulating while retail investors reduce holdings.
  • Large wallets now hold their highest ADA balance since February 2023.
  • Shrinking available supply could support a stronger price recovery.


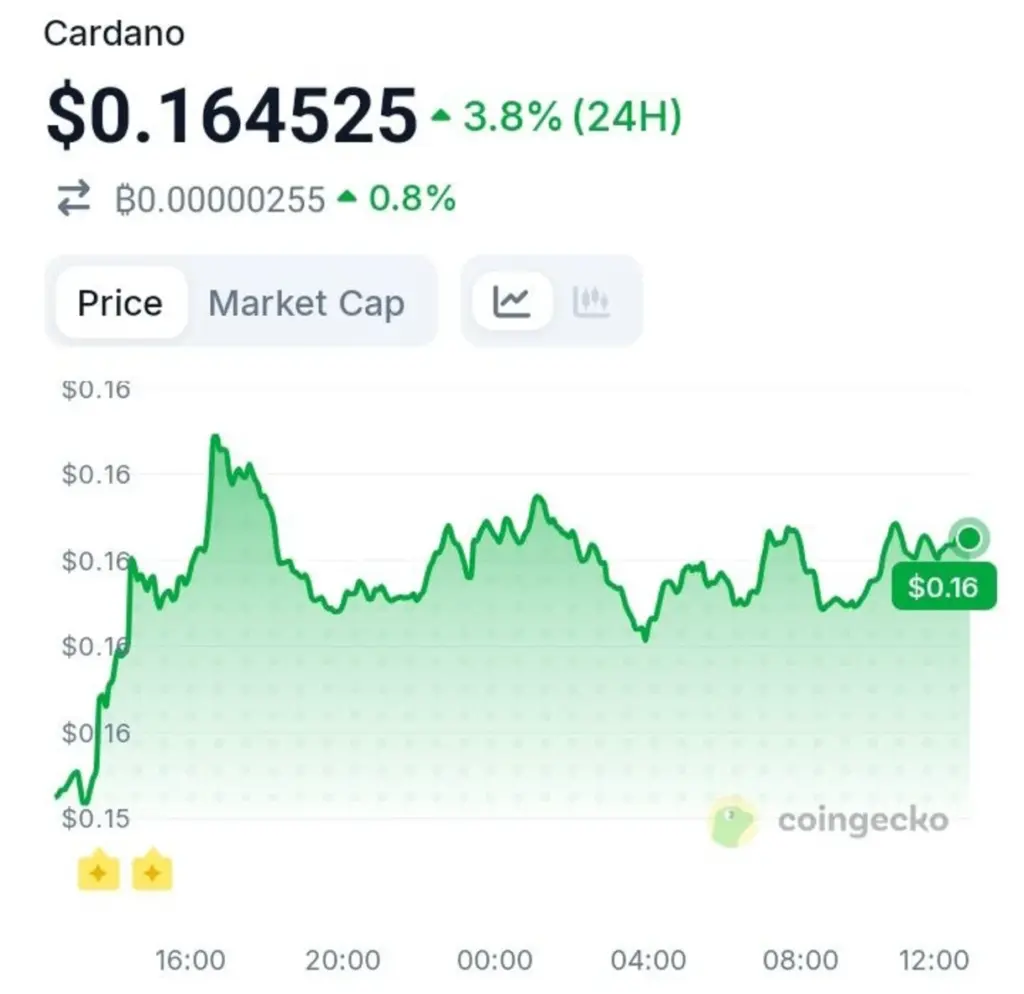
What do you do when everyone around you is heading for the exit, but the smartest money in the room keeps buying more? That’s the question Cardano’s chart is quietly raising right now. ADA sits at $0.164525 as of July 15, 2026, up 3.8% over the past 24 hours, according to CoinGecko. Beneath that modest bounce, a much bigger divergence is playing out between the network’s largest holders and everyone else.

A Choppy Climb Back Toward $0.16

The 24-hour chart tells a story of hesitation followed by resolve. ADA climbed sharply from a low near $0.15 around 15:00 UTC on July 14, spiking above $0.165 before pulling back into a choppy range through the evening. 

While Retail Sells, Cardano Whales Keep Buying—Here's Why It Matters
ADAUSD Chart. Source: CoinGecko.

Price found repeated support near $0.156 through the early hours of July 15, bounced off that floor multiple times, then pushed back toward $0.164 by midday UTC. It’s not a clean breakout, but it’s not a breakdown either—more like a market testing conviction on both sides.

Who’s Actually Buying This Dip?

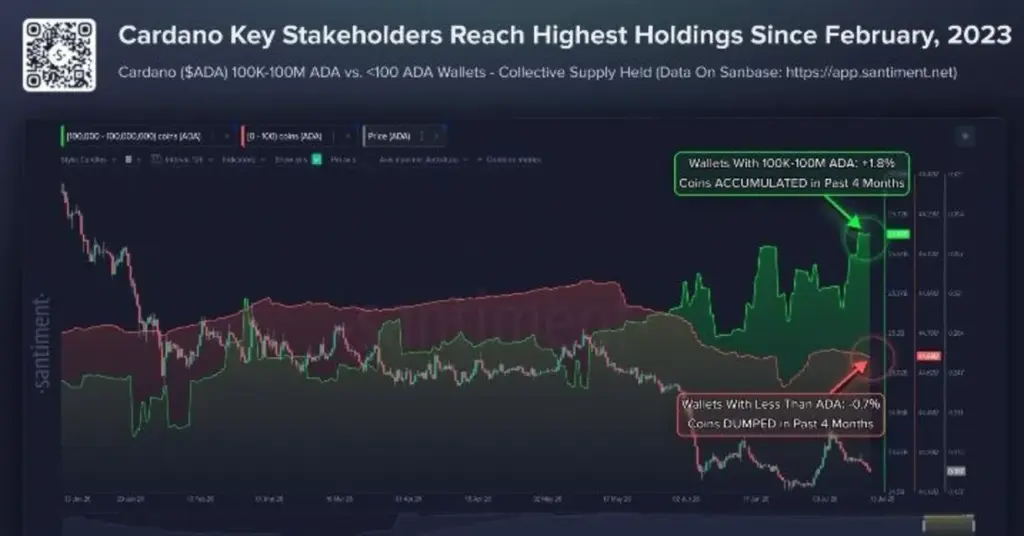
According to Santiment data, wallets holding between 100,000 and 100 million ADA now control more than 25.6 billion coins, the highest concentrated balance since February 2023—a period that came just before a strong repricing in the last cycle. These wallets have added roughly 1.8% to their holdings over the past four months, accumulating steadily through weakness rather than waiting for confirmation.

Retail hasn’t followed. Wallets holding under 100 ADA have trimmed their collective stack by about 0.7% over the same stretch, a pattern that tends to show up when smaller holders lose patience faster than the market rewards them for staying.

While Retail Sells, Cardano Whales Keep Buying—Here's Why It Matters
Image Via X/Santiment.

So What Happens When The Float Shrinks?

This is where the setup gets interesting. When large holders absorb supply while retail sells into thin order books, the coins available for quick liquidation start to disappear. Santiment’s own read on the data called it one of the more constructive technical setups ADA has shown all year, pointing to strong hands adding even as retail grows visibly impatient.

The accumulation also isn’t happening in a vacuum. Development on Leios, Hydra scaling, and Mithril continues to progress in the background, giving whales more to work with than just a discounted price.

Retail’s patience may be running thin. But if the last time whale wallets reached this level of concentration is any indication, patience might be exactly what gets tested next—on both sides of the trade.

Bitcoin Dominance Explained: Why It Matters for Altcoin Traders

Bitcoin dominance is one of the simplest market indicators in crypto, but many beginners ignore it. It measures Bitcoin’s share of the total crypto market value. If the entire crypto market is worth $3 trillion and Bitcoin is worth $1.8 trillion, Bitcoin dominance is 60%.

That number matters because crypto money often rotates in cycles. When Bitcoin dominance rises, capital is usually moving into Bitcoin faster than it is moving into altcoins. That can happen during strong Bitcoin rallies, nervous market conditions, or moments when traders prefer the most liquid asset in the market. When dominance falls, altcoins are often outperforming Bitcoin, which can create better conditions for selective altcoin trades.

telegram

Free Crypto Signals Channel

More than 50k members
Technical analysis
Up to 3 free signals weekly
Educational content
telegram Free Telegram Channel

A common mistake is assuming falling dominance means every altcoin will rise. It does not. It simply suggests that Bitcoin is losing relative share. In a healthy risk-on market, that can support Ethereum, Solana, XRP, and other large-cap coins. In a weak market, dominance can fall because Bitcoin is dropping while smaller coins are dropping even harder at different speeds. Context matters.

Traders can use Bitcoin dominance as a filter rather than a standalone signal. For example, if Bitcoin is above key support, market sentiment is improving, and dominance is drifting lower, altcoin setups may deserve more attention. If Bitcoin is breaking down and dominance is rising sharply, it may be safer to reduce altcoin exposure or wait for cleaner conditions.

Bitcoin dominance is especially useful for understanding market phases. Early bull moves often begin with Bitcoin. After Bitcoin stabilises, capital may rotate into Ethereum and then into higher-risk altcoins. Late-cycle periods can become chaotic, with smaller coins pumping quickly while risk also increases.

Cryptocurrency Signals Monthly
£42
  • 2-5 Signals Daily
  • 82% Success Rate
  • Entry, Take Profit & Stop Loss
  • Amount To Risk Per Trade
  • Risk Reward Ratio
Cryptocurrency Signals Quarterly
£78
  • 2-5 Signals Daily
  • 82% Success Rate
  • Entry, Take Profit & Stop Loss
  • Amount To Risk Per Trade
  • Risk Reward Ratio
Cryptocurrency Signals Yearly
£210
  • 2-5 Signals Daily
  • 82% Success Rate
  • Entry, Take Profit & Stop Loss
  • Amount To Risk Per Trade
  • Risk Reward Ratio
arrow
arrow

The best use of dominance is simple: ask whether money is favouring Bitcoin, altcoins, or neither. Combine that answer with price action, volume, funding rates, and news catalysts.

Key takeaway:

Bitcoin dominance does not predict exact entries, but it helps traders understand where capital is flowing. For altcoin traders, that context can prevent chasing weak setups when the broader market is not supporting them.

Educational content only. Not financial advice. DYOR.

A $150 Bitcoin Miner Just Pulled Off the Impossible

Key Takeaways:

  • A $150 Bitaxe miner solo-mined a Bitcoin block, defying incredible odds.
  • The 3.125 BTC reward was worth about $200,000 at the time of the find.
  • The event highlights Bitcoin’s open mining model, where anyone can still get lucky.


Most people who want to mine Bitcoin buy industrial hardware, join a mining pool, and split rewards with thousands of others. One person with a $150 device just skipped all of that — and found a block entirely on their own.

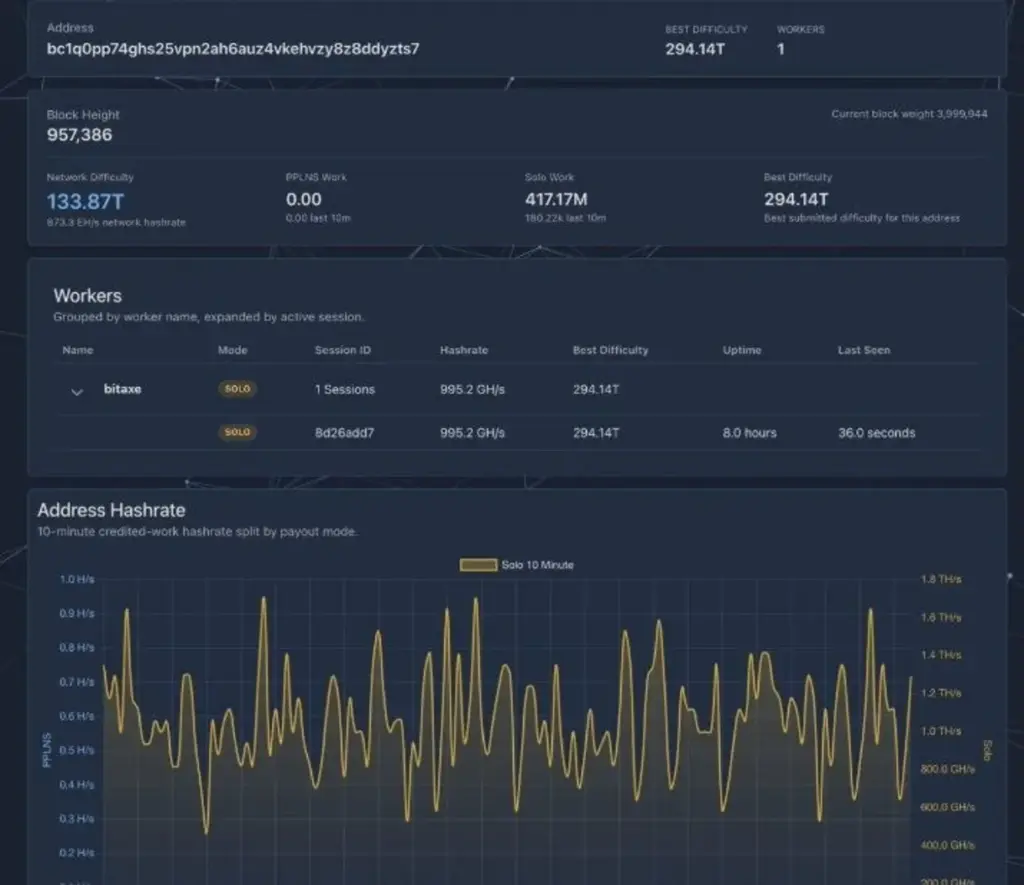
A Bitaxe solo miner running at just 995.2 GH/s has achieved a best difficulty of 294.14T — a figure that confirms a solo block find against a network difficulty of 133.87T. The dashboard, captured on July 14, 2026 at block height 957,386, shows a single worker named “bitaxe” that has been running for 8 hours with 36 seconds of uptime logged at the moment of capture. 

The solo work column reads 417.17M in the last 10 minutes. This is not a pool payout. This is a solo miner — one device, one person — finding a Bitcoin block on the world’s most competitive computational network.

A $150 Bitcoin Miner Just Pulled Off the Impossible
Image Via X.

What Makes This So Remarkable

To understand the significance, consider the odds. The Bitcoin network currently operates at approximately 873.3 EH/s of total hashrate. A Bitaxe running at 995.2 GH/s contributes roughly 0.000000114% of that total. Statistically, a miner at this hashrate might expect to find a block once every several thousand years of continuous operation. 

Solo block finds at this scale are not supposed to happen — which is precisely why the crypto community treats them as events worth celebrating when they do. They are the proof-of-work equivalent of winning a lottery no one expected to be winnable.

The Bitaxe is an open-source, community-designed Bitcoin miner built around the BM1366 ASIC chip. It draws minimal power, fits in the palm of a hand, and costs roughly $150. It was never designed to compete with industrial mining farms. It was designed to let individuals participate in Bitcoin’s proof-of-work consensus in a meaningful — if statistically unlikely — way.

Bitcoin’s Price on the Day of the Find

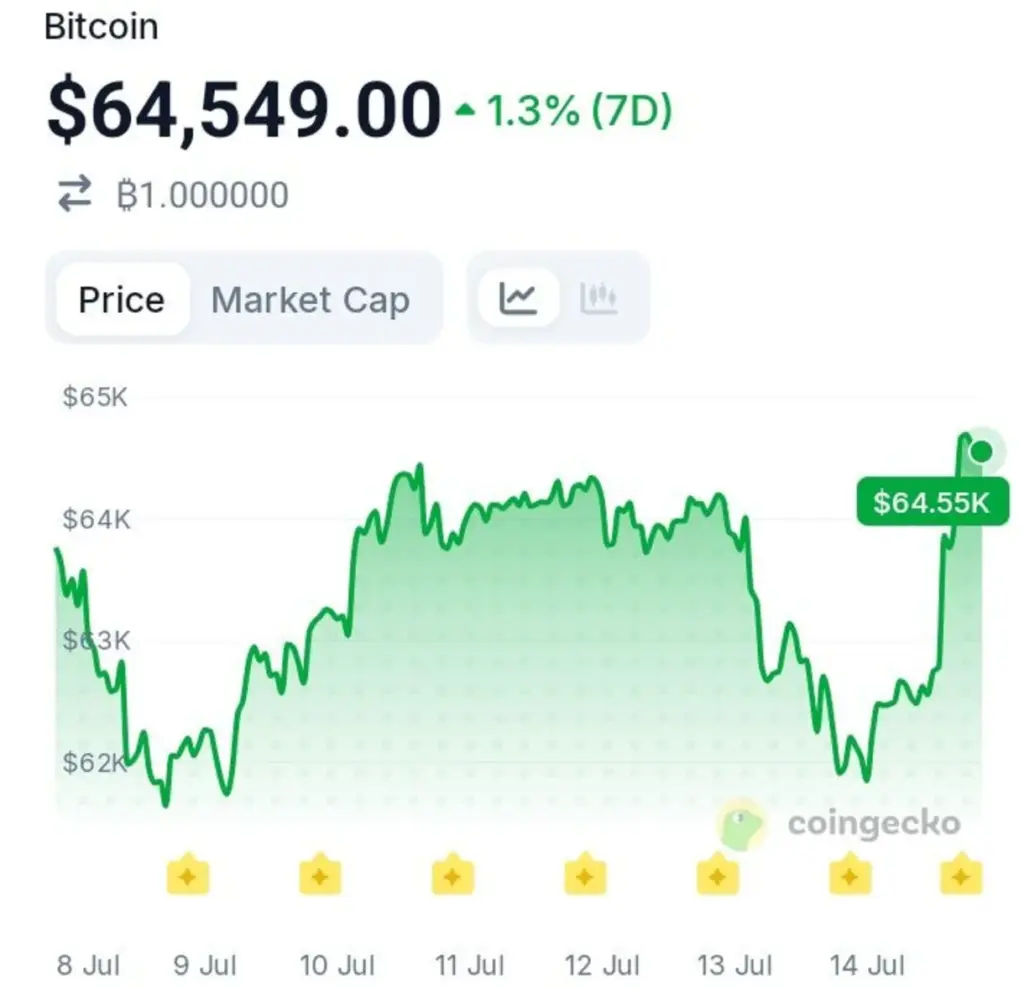
Data pulled from CoinGecko on July 14, 2026 at approximately 8:53 UTC shows Bitcoin trading at $64,549.00, up 1.3% over seven days. The weekly chart shows a market that ground between $62K and $64K from July 8 through July 13, then broke sharply higher on July 14 — pushing above $64.5K in a clean, late-week move. 

A $150 Bitcoin Miner Just Pulled Off the Impossible
BTCUSD Weekly Chart. Source: CoinGecko.

The timing means this solo miner found their block on the same day Bitcoin broke to its highest level in over two weeks. At current prices, a solo block reward of 3.125 BTC is worth approximately $201,700 — earned by a device that cost less than a monthly gym membership.

What This Moment Represents

Beyond the extraordinary mathematics, this find carries a message about what Bitcoin was designed to be. The network’s proof-of-work system was never meant to be the exclusive domain of warehouse-scale mining operations. It was meant to be open — participatory in a way that anyone with hardware and electricity could access. 

Industrial mining dominates in practice. But the protocol itself has no minimum entry requirement, and moments like this are the living proof of that design philosophy. Someone spent $150, plugged in a device the size of a small book, and earned $200,000 in Bitcoin. The odds said it was impossible. The blockchain said otherwise.

OKX Re-enters Nigeria as Demand for Crypto On-Ramp Services Grows

Summary

  • OKX’s return highlights Nigeria’s strong crypto demand.
  • Competition among exchanges is increasing.
  • Regulation and user trust remain key challenges.

The return of OKX to the Nigerian cryptocurrency market has generated significant interest across Africa. It also highlights the resilience of Nigeria’s crypto ecosystem, demonstrating that demand for digital assets remains strong despite regulatory uncertainty.

When it comes to peer-to-peer (P2P) cryptocurrency transactions, Nigeria consistently ranks among the world’s leading markets. Due to prevailing economic realities, cryptocurrencies have evolved beyond speculative investments. For many Nigerians, they serve as practical tools for cross-border payments, savings, remittances, and business transactions. Even during periods of tighter regulation, demand for crypto services has remained remarkably resilient.

OKX Re-enters Nigeria as Demand for Crypto On-Ramp Services Grows
OKX Re-enters Nigeria as Demand for Crypto On-Ramp Services Grows. Source / Cryptosignals : Google Images

Nigeria Emerges as a Prime Destination for Global Crypto Exchanges

As growth opportunities become more limited in mature markets, global cryptocurrency exchanges are increasingly shifting their attention to regions where digital asset adoption remains strong and traditional financial systems still leave room for innovation.

Nigeria stands out as one of the most attractive markets, thanks to its large population, tech-savvy youth, and vibrant entrepreneurial culture. However, the crypto landscape that exchanges are returning to has changed considerably. During the absence of several major platforms, Nigeria’s digital asset ecosystem has matured significantly.

Today, numerous local and international providers offer reliable fiat on-ramp and off-ramp services. Fintech companies, payment processors, stablecoin platforms, and peer-to-peer marketplaces have all expanded their capabilities. As a result, centralized exchanges can no longer rely solely on brand recognition or deep liquidity. Instead, they must compete by delivering superior products, services, security, and user experiences.

OKX Re-enters Nigeria as Demand for Crypto On-Ramp Services Grows
OKX Re-enters Nigeria as Demand for Crypto On-Ramp Services Grows. Source / Cryptosignals : Google Images

The Future of P2P Trading in Nigeria

Any cryptocurrency exchange seeking to re-enter the Nigerian market must also prioritize user confidence while successfully navigating the country’s evolving regulatory landscape.

The renewed focus on peer-to-peer (P2P) trading is particularly noteworthy. P2P platforms have long been among the most resilient pillars of Nigeria’s crypto ecosystem. Even when access to traditional banking channels became restricted, users adapted by relying on decentralized transaction methods and trusted community-driven networks.

If OKX strengthens its presence through P2P services, it could intensify competition among exchanges seeking to capture this highly active market. However, any resurgence in P2P trading should be viewed with measured optimism rather than excessive enthusiasm.

Regulatory uncertainty remains an important consideration. Nigerian authorities continue to monitor issues such as capital flows, currency speculation, and financial crime. Consequently, exchanges pursuing long-term growth must balance expansion with regulatory compliance by working closely with policymakers while offering products that meet evolving legal and financial standards.

Nigeria: The Next Battleground for Crypto Exchanges

Ultimately, OKX’s return underscores just how attractive the Nigerian cryptocurrency market has become. It also demonstrates that temporary regulatory setbacks have not diminished the country’s demand for alternative financial solutions such as cryptocurrencies.

Looking ahead, competition is likely to intensify as more centralized exchanges follow OKX’s lead in re-establishing their presence in Nigeria. The country remains one of the world’s most important crypto frontiers, and the race to capture market share is far from over.

Avalanche (AVAX) Maintains Its Gradual Uptrend

Summary:

  • AVAX is recovering, rising above $6.50 after bouncing from $5.50.
  • Momentum is improving, but the token remains below the 9-day EMA.
  • Potential targets: $8 and $10 if the uptrend continues.

On-chain activity on the Avalanche blockchain has continued to increase steadily. This growth has coincided with a gradual rise in AVAX’s price, even as the broader cryptocurrency market experiences a pullback.

Studying the Avalanche 24-Hour Chart

The AVAX/USDT market rebounded from around the $5.50 support level and has since climbed above $6.50. Despite this recovery, the latest bullish candlestick remains below the 9-day Exponential Moving Average (EMA), indicating that the market has yet to fully regain short-term bullish momentum.

Avalanche's Positive Fundamentals Remain SupportiveThe AVAX/USDT market has maintained its upward trajectory since rebounding from the $5.50 support level in mid-June
Avalanche (AVAX) Maintains Its Gradual Uptrend. Source / Cryptosignals : TradingView

Meanwhile, the Moving Average Convergence Divergence (MACD) indicator remains below the equilibrium level, with its signal lines moving sideways. Although the MACD histogram bars remain above the equilibrium line, they are gradually weakening, suggesting that bullish momentum is still developing.

AVAX Traders Remain Optimistic

The Avalanche market appears to be in the early stages of a recovery. While buying pressure has increased, price action has not yet broken above the key resistance represented by the 9-day EMA.

Similarly, the MACD lines have moved closer to the equilibrium level but continue to trend sideways below it. The histogram bars remain slightly positive, indicating that bullish momentum is still present, although it has yet to strengthen significantly. Overall, the current setup suggests the potential for a medium-term continuation of the uptrend.

Avalanche (AVAX) Maintains Its Gradual Uptrend
Avalanche (AVAX) Maintains Its Gradual Uptrend. Source / Cryptosignals : YouTube

Avalanche’s Positive Fundamentals Remain Supportive

The AVAX/USDT market has maintained its upward trajectory since rebounding from the $5.50 support level in mid-June. Despite short-term technical resistance, the broader trend remains constructive.

Combined with the continued growth of the Avalanche ecosystem, the market appears well-positioned for further gains. As a result, traders may consider targeting the $8.00 and $10.00 price levels as medium-term objectives.