Helium (HNT) Exhibits Strong Bullish Signals—What Is the Next Target?

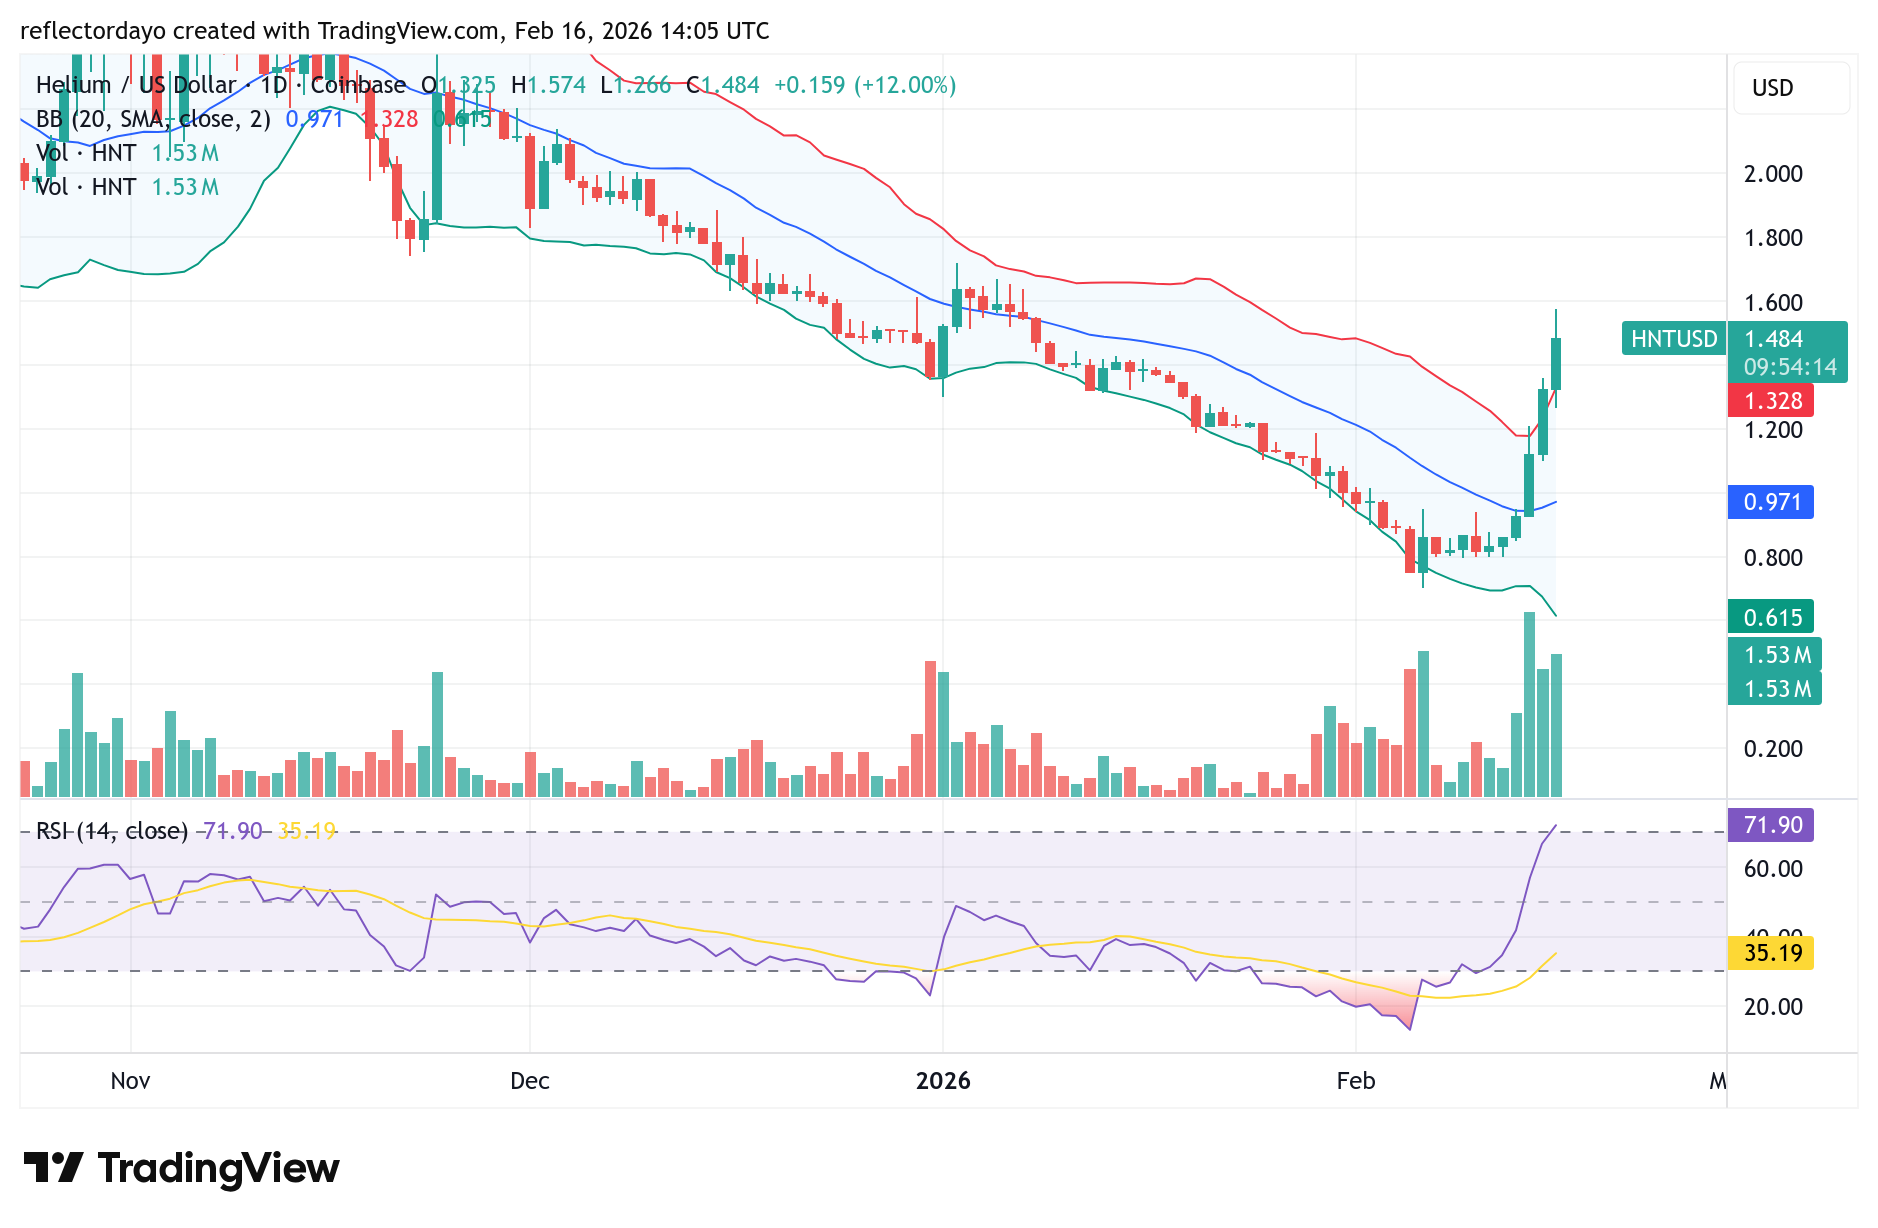
On the daily chart, three consecutive bullish candlesticks highlight growing buying pressure in the Helium (HNT) market. Although each candlestick features an upper shadow—indicating some profit-taking and cautious selling near higher levels—bullish sentiment still appears to outweigh bearish pressure.

The presence of these upper wicks suggests that sellers are attempting to resist further upside, but buyers continue to maintain control overall. Will this upward momentum persist? Let us delve deeper into the analysis.

Helium (HNT/USD) Market Data

  • HNT/USD Price Now: $1.5
  • HNT/USD Market Capitalization: $288 million
  • HNT/USD Circulating Supply: 186 million HNT
  • HNT/USD Total Supply: 288 million HNT
  • HNT/USD CoinMarketCap Ranking: #147

HNT 150% Rally, Next Targets? HNT coin price prediction

The Helium market established a pivotal support base just below the $0.80 level, which served as the launching pad for the current upside move. Following this shift in the first week of February, buying interest steadily increased as more traders positioned themselves on the bullish side, resulting in a decisive change in market structure.

Within just two weeks, the asset has posted an impressive gain of nearly 100%, reflecting strong momentum and renewed investor confidence. Based on the video analysis, the next major resistance level appears to be positioned around the $2.00 price zone.

Key Levels to Monitor

  • Resistance: $1.60, $1.70, $1.80
  • Support: $1.00, $0.90, $0.80

Helium (HNT) Exhibits Strong Bullish Signals—What Is the Next Target?

Helium (HNT) Analysis: Technical Viewpoint

The Helium market has demonstrated a clear transition from a bearish phase to a bullish cycle. The emergence of three classic bullish candlesticks signals strengthening buying momentum. Although each candlestick features a noticeable upper shadow—indicating some profit-taking at higher levels—the overall structure still supports the development of a potential bullish trend.

Additionally, the trading volume histograms show strong participation, reinforcing the ongoing upward price action. This surge in volume in the crypto signal suggests that the rally is being supported by active market involvement, increasing the reliability of the current move.

Helium’s Growing Deflationary Pressure

A recent post on X highlights a development that many market participants may be overlooking: Helium (HNT) has become increasingly deflationary. According to the commentary, the amount of HNT being burned daily now exceeds the volume being minted—by a widening margin. This dynamic suggests a tightening supply environment, which could have long-term implications for price stability and upside potential if demand continues to expand. With token burns outpacing new issuance, the structural supply shift reinforces the evolving bullish narrative surrounding the Helium ecosystem.

Helium (HNT) Technical Viewpoint (Continued)

However, despite these positive signals, the widening Bollinger Bands warrant caution. While expanding bands typically reflect increasing volatility—often accompanying strong trends—they can also precede short-term pullbacks.

At present, the $1.60 level stands as a significant resistance zone that may challenge further upside momentum. On the downside, support around $1.50 could help sustain the recovery if the market experiences a temporary retracement.

Helium (HNT) Exhibits Strong Bullish Signals—What Is the Next Target?

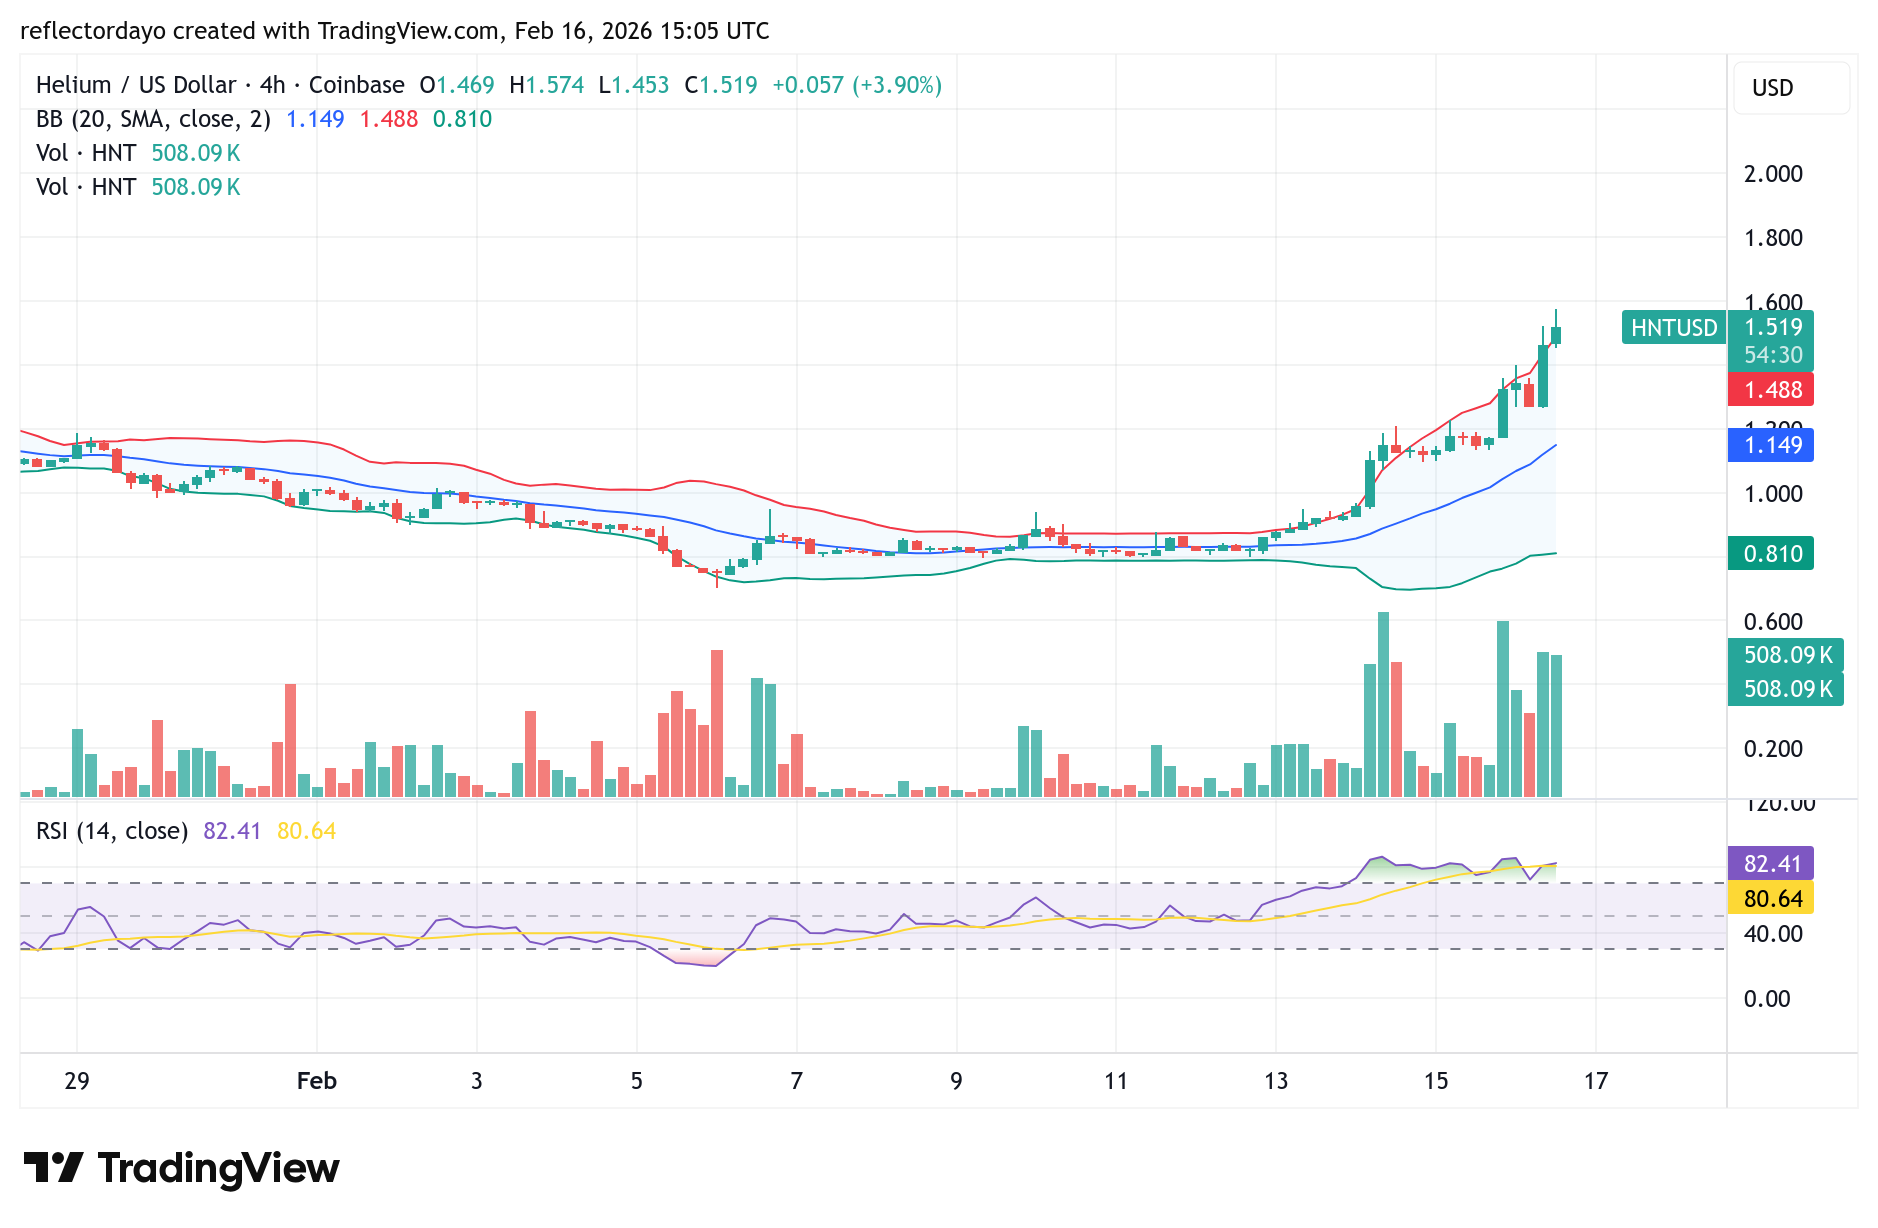
HNT/USD 4-Hour Chart Outlook

From the 4-hour chart perspective, the Helium market is beginning to show signs of caution as price approaches the $1.60 resistance level.

The most recent bullish candlestick, formed near this resistance zone, lacks substantial trading volume. It is relatively small and features an upper shadow, indicating that buying pressure weakened after testing the resistance, leading to a mild pullback. This suggests that sellers are actively defending the $1.60 level.

Although overall trading volume remains elevated, the market now appears to be in a short-term demand-versus-supply standoff. If this consolidation persists without a decisive breakout above resistance, both trading volume and volatility could gradually decline as price stabilizes within a tighter range.

Trade crypto coins on BYBIT

BNB Price Navigates Critical Demand: Can the $600 Floor Halt the Bearish Slide?

In line with the overall market decrease, the BNB price has dropped 1.96% to $618.13 during the past day. Currently, this seems to be a selling pressure driven by beta that is directly related to the 2.04% decline in Bitcoin. Given that the greed and fear indicator is at 12, this indicates a general risk-averse attitude among investors.

Bitcoin has to establish strong support around $68,000 in the near future; if not, it might undergo a more severe fall and possibly revisit the February low of $580.

Currently, BNB trades at $616.85 with more than 31k traded volumes on the daily timeframe.

BNB Price Navigates Critical Demand: Can the $600 Floor Halt the Bearish Slide?
BNBUSDT – Daily Chart

Technical Indicators

Major Resistance Levels: $632, $650, and $730

Major Support Levels: $600, $570, and $530

Technical Analysis

The current market sentiment for BNB against Tether is navigating a serious Strong Sell technical situation across short-to-medium timeframes. This appears to have started after a sharp decline from its October 2025 highs. The BNB price is currently navigating a descending channel and stabilizing around the $610–$620 zone. However, though the long-term outlook remains cautiously optimistic due to ecosystem utility, the Stochastic RSI (SRSI) suggests an impending downside movement is on the horizon as the lines extend into the extreme overbought zone without significant changes in the price.

To this end, if the $600 psychological level fails to hold, $570 may be the next target; conversely, a move above $632 would invalidate this analysis.

BNB Tanking: $545 Target in View

In recent times, BNB has remained bearish across different timeframes. The hourly chart shows rejection from oversold levels; meanwhile, the daily chart faces resistance at the 5-day moving average. As it stands, the weekly and monthly indicators reflect downward momentum and worsening MACD histograms. This shows the BNB price is projected to drop toward the $545 and $513 price targets, except if market fundamentals change.

BNB Price Slump Hits a Wall: Reversal or Just a Pitstop?

After a sharp downward move, BNB/USDT on the 4-hour chart shows the pair is near a local support zone, attempting to hold above the zone. However, the BNB price is still below the cluster of moving averages acting as dynamic resistance, especially the $620 level.

Beneath the chart, the Stochastic RSI appears to be suggesting increased optimism about the token. As it stands, the lines are currently at the bottom of the range, indicating an oversold condition. However, a bullish crossover has been spotted, giving out an early signal that the downward momentum is exhausting and a relief rally or reversal is likely. To this end, a move above $622 would open the path to the $674 resistance zone; otherwise, a continued downtrend might be seen.

BNB Price Navigates Critical Demand: Can the $600 Floor Halt the Bearish Slide?
BNBUSDT – 4H Chart


You can purchase crypto coins here. Buy Crypto

Dogecoin (DOGE) Price Prediction: DOGE/USDT Retreats Toward the $0.1000 Baseline

Date: February 16, 2026

The Dogecoin market had previously experienced some notable upward movement. However, the market has since seen a pullback and, as such, now threatens the recent upward trajectory.

DOGE/USDT Long-Term Trend — Bearish (Daily Chart)

Key Price Levels

Resistance: $0.1100, $0.1250, $0.1400

Support: $0.1000, $0.0900, $0.0800

Dogecoin (DOGE) Price Prediction: DOGE/USDT Retreats Toward the $0.1000 Baseline

The last two price candles on the chart are bearish. While the bearish momentum was stronger in the previous session, the ongoing session has only provided modest progress to that trend, considering the appearance of the corresponding price candle in the current session. Nevertheless, trading activity remains above the 9-day Exponential Moving Average (EMA). Meanwhile, the Stochastic Relative Strength Index (SRSI) lines are in the overbought zone and have delivered a downward crossover.

Dogecoin (DOGE) Price Prediction: DOGE/USDT May Edge Lower

With price activity leaning toward lower levels, the Dogecoin market continues to assume a more vulnerable stance. Although the last price candle here has a small appearance and suggests reduced bearish pressure, price activity on the token’s daily chart still stands above the 9-day EMA curve.

Contrary to this is the fact that the SRSI indicator lines have delivered a downward crossover from elevated levels. The ensuing lines of the indicator, as of the time of writing, now maintain a more sideways trajectory but may continue to decline if bearish sentiment strengthens, which could also result in steeper dips in price action.

Dogecoin (DOGE) Price Prediction: DOGE/USDT Bears Seem to Be Hitting the Brakes

By progressing to a smaller timeframe of 4 hours, one can see that price activity has descended below the 9-day EMA curve. However, bearish progress here appears somewhat restrained. Recent price candles can be seen to be relatively small, presenting the impression that bearish forces are losing momentum.

Dogecoin (DOGE) Price Prediction: DOGE/USDT Retreats Toward the $0.1000 Baseline

Meanwhile, the SRSI indicator lines have dropped to lower levels of the indicator. The terminals of the lines are now heading toward convergence. This aligns with the impression that bearish forces are slowing down, and the market may rebound toward the $0.1200 level once more.

Get Dogecoin (DOGE) here. Buy DOGE 

IMF Warns Stablecoin Market Concentration May Threaten Global Financial Stability

Fear and uncertainty are rising across global markets after the International Monetary Fund issued a strong IMF stablecoin warning. In its recent report, the Washington-based institution explained that the stablecoin market concentration has deepened, with the sector increasingly tied to short-term U.S. government liability. The institution reportedly highlighted that crypto tied to the U.S. dollar is not replacing the dollar. Instead, they are creating a private channel for distributing it.

The total stablecoin market has grown beyond $300 billion, almost doubling in recent years. Traders, remittance providers, and payment platforms have widely adopted these digital tokens. As a result, regulators and central banks worldwide are now paying closer attention.

IMF Stablecoin Warning Highlights Market Concentration Risks

Under the IMF stablecoin warning, officials reportedly observed that about 97% of all stablecoins are pegged to the U.S. dollar. They added that over 90% of the market value is concentrated in Circle’s USDC and Tether’s USDT.

IMF Warns Stablecoin Market Concentration May Threaten Global Financial Stability

The IMF explained that these major issuers hold large amounts of Treasury bills and repurchase agreements. Due to this condition, stablecoins now interact directly with traditional financial systems. From this report, it can be deduced that this creates competition for bank deposits, affects cross-border payments, and may influence financial stability in the future.

The IMF also warned that dollar-backed stablecoins could increase currency substitution in countries with weak monetary systems. It reportedly stated that in nations facing high inflation or low trust in local currencies, families and businesses may shift toward dollar stablecoins. This shift, the Fund cautioned, could weaken central banks’ control over capital flows and fragment payment systems.

Debate Grows Over Banking Stability and Financial Inclusion

Meanwhile, after these risks, the IMF acknowledged possible benefits. Officials reportedly said that with proper regulation in place, stablecoins could expand financial inclusion, reduce payment costs, and promote competition. The fund holds the notion to be true, especially in developing economies where mobile finance already leads.

Meanwhile, historians Niall Ferguson and Manny Rincon-Cruz argued that concerns about banking instability may be overstated. As it stands, they are of the opinion that fiat-backed stablecoins are payment tools, different from volatile cryptocurrencies like Bitcoin. To this end, they added that adoption has accelerated since the GENIUS Act, showing stablecoins may evolve alongside banks rather than take their place.


In order to place winning trades with us via Bybit, you can open an account here.

SEC Crypto Reform Agenda Gains Momentum as Market Awaits Clear Digital Asset Standards

The Securities Exchange Commission (SEC) crypto reform agenda is advancing as the U.S. moves to clarify how digital assets are classified within federal securities laws. Speaking after the 2026 Securities Regulation Institute in Coronado, California, Division of Corporation Finance Director James Moloney explained that the agency is preparing formal recommendations aimed at reducing uncertainty in the crypto market.

Moloney said the Division is developing interpretive guidance that will provide a clear taxonomy for crypto assets and a structured method for determining when a token qualifies as an investment contract. He explained that these recommendations will be submitted to the Commission to create reliable standards for market participants. According to him, the goal is to replace confusion with predictable rules that investors and companies can understand before taking action.

SEC Crypto Reform Agenda to Deliver Clear Crypto Asset Taxonomy Guidance

Under the proposed guidance, the SEC will explain how existing securities laws apply to digital tokens. Moloney stated that the division intends to outline when crypto assets fall within an investment contract analysis. He further noted that for tokens meeting this definition, the agency is working on a proposal to establish a practical regulatory framework for their offer and sale.

SEC Crypto Reform Agenda Gains Momentum as Market Awaits Clear Digital Asset Standards

This effort forms part of Chairman Paul Atkins’ initiative known as “Project Crypto.” The project aims to define when a token initially sold to raise capital may later operate outside securities regulations. Officials emphasized that the guidance will clarify registration, disclosure, and compliance requirements tailored to crypto-based securities offerings.

From Enforcement to Predictable Digital Asset Securities Framework

As it stands, Moloney has indicated that the SEC seeks to move away from what he described as enforcement-driven ambiguity. In lieu of that, the Commission aims to introduce clear, forward-looking standards. Meanwhile, running side-by-side are the rulemaking efforts, as the Division has issued staff statements and no-action letters addressing token distributions, broker-dealer activities, tender offers involving crypto securities, and Section 13(d) issues in blockchain transactions.

To this end, the SEC affirmed that it will continue monitoring innovation while supporting capital formation and protecting investors. Together, the planned taxonomy guidance and regulatory proposal represent a decisive step in defining how digital asset markets fit within the U.S. securities framework.


In order to place winning trades with us via Bybit, you can open an account here.

Chainlink Price at a Crossroads: An Institutional Accumulation or Bear Trap?

In recent times, Chainlink price has risen by 1.75% to $9.12, slightly outperforming the broader market’s 1.32% gain. As it stands, this increase shows that this is a beta-driven recovery trailing Bitcoin’s modest ascent as market sentiment moved away from extreme fear. Additionally, it appears that the current uptick is happening without a specific catalyst, as LINK/USDT benefited from a technical relief bounce after settling above an oversold region.

Right now, the near-term outlook depends on LINK maintaining its 7-day SMA above $8.68. Also, if Bitcoin stays above $70,000, the token could target the $9.83 Fibonacci level. However, losing current support may trigger a retest of the $7.32 swing low.

Currently, Chainlink trades at $9.08 with more than 1.28 million traded volumes on the daily timeframe.

Chainlink Price at a Crossroads: An Institutional Accumulation or Bear Trap?
LINKUSDT – Daily Chart

Technical Indicators

Major Resistance Levels: $9.15, $10.93, and $12.50

Major Support Levels: $9.75, $8.00, and $7.50

Technical Analysis

After a sharp drop in early February, the Chainlink price has flattened out near the $9.00 psychological level. This suggests a temporal halt in the bears’ action. However, a reversal has not formed yet.

Meanwhile, the signal given by the Stochastic RSI shows the price looks low in momentum with an overextended overbought condition. This suggests that the recent small bounce may be running out of steam, and we might see a pullback or further sideways grinding before a real breakout can occur.

As it stands, the price is still operating under the moving averages, with the immediate resistance around $9.47; However, a close above this level would suggest an attempt at a breakout, but the near-100 momentum level signals a pullback might be necessary.

The Road Ahead for Chainlink Price: Institutional Accumulation or Bear Trap?

The analysis from @TheTopBlasterr shows Chainlink ($LINK) is currently positioned within a historic support zone between $7.50 and $10.00. This is a level that has historically anchored the price across multiple market cycles. Following years of range consolidation, Chainlink price action suggests a period of institutional accumulation rather than random volatility. Ultimately, this price analysis views this retest of long-term support as a significant technical milestone that may precede major trend shifts for the token.

LINK/USDT Analysis: What to Expect

LINK/USDT on the 4-hour timeframe shows the price is recovering, tending towards $9.15, where the 100-period moving average is located. However, the upside pressure has been shown to be waning by the stochastic oscillator with declining lines. As it stands, there might be a need to cool down towards $8.75 in the near term before another leg up as momentum tilts in favor of the bears.

Chainlink Price at a Crossroads: An Institutional Accumulation or Bear Trap?
LINKUSDT – 4H Chart


You can purchase crypto coins here. Buy Crypto

Top Five Trending Coins for February 15: WARD, OPn, PEPE, DOGE, WMTX

Today’s focus on CoinMarketCap’s top trending markets reveals a mix of market sentiments. Warden has climbed to the top position at the time of writing. Meanwhile, OPN, being newly launched, is experiencing a strong upward pump, largely driven by speculative interest. The remaining trending assets are also showing notable bullish recovery over the past 24 hours.

Let us now delve into the analysis of each market one after the other.

Warden (WARD)

Major Bias: Bearish

This is a newly launched market that captured significant attention last week and in the days that followed. It delivered an impressive upward surge, defying the broader bearish sentiment that weighed heavily across the crypto market.

However, this week tells a different story. The Warden market has printed a notable swing low, highlighting increased volatility and a shift in short-term momentum. The heightened social media activity and online buzz surrounding the asset may have contributed to these sharp price fluctuations.

Despite these headwinds, the market has established support around the $0.045 price level. This zone may be attracting accumulation, as traders potentially position themselves in anticipation of a rebound from this area.

Current Price: $0.0469

Market Capitalization: $11.9 million

Trading Volume: $151 million

Top Five Trending Coins for February 15: WARD, OPn, PEPE, DOGE, WMTX

TOubor POol OPINION_Market (OPn)

Major Bias: Bullish

On the CoinMarketCap platform, this asset appears to be a new entrant into the crypto space, as reflected by the limited historical data available on its chart. Despite this, the market has delivered an impressive performance so far, likely fueled by strong speculative hype.

The token opened around $0.00078 and surged sharply to above $0.20 before profit-taking pressure triggered a correction, pulling the price back toward the $0.17 region.

At this stage, it may not be the most strategic time to chase the ongoing bullish momentum. Instead, traders may want to monitor the market’s behavior around key support levels and wait for clearer confirmation of its next directional move.

Current Price: $0.179

Market Capitalization: $219 million

Trading Volume: $84 million

Top Five Trending Coins for February 15: WARD, OPn, PEPE, DOGE, WMTX

Pepe (PEPE)

Major Bias: Bullish

What we are witnessing today is a significant bullish recovery that has decisively reclaimed key levels, particularly around the $0.0000045 zone. This is a major technical level, and the market’s performance over the past 24 hours suggests a possible shift in momentum.

Although the large bullish candlestick signals heightened volatility—which may prompt traders to tread carefully—there is a strong possibility that the $0.0000045 level could now act as support.

All eyes are currently on this zone. If the level holds firmly, the market may have a solid foundation for continued upside movement in the near term.

Current Price: $0.0000048

Market Capitalization: $1.9 billion

Trading Volume: $830 million

Top Five Trending Coins for February 15: WARD, OPn, PEPE, DOGE, WMTX

Dogecoin

Major Bias: Bullish

The Dogecoin market is exhibiting behavior similar to that of Pepe. Over the past 24 hours, increased buying pressure has driven the price higher, breaking through the $0.10 and $0.11 levels.

However, above the $0.11 mark, in this crypto signal, price action has begun to flatten, suggesting a temporary equilibrium where demand matches supply. “What’s next for the market?” is likely the question on many traders’ minds. For now, patience may be required as participants observe how price develops in the upcoming trading sessions.

The RSI currently sits around the midpoint of the indicator, reinforcing the idea of market balance. This positioning leaves room for further upside, but it also suggests the potential for consolidation above the recently reclaimed levels.

Current Price:  $0.1108

Market Capitalization: $18.7 billion

Trading Volume: $1.6 billion

Top Five Trending Coins for February 15: WARD, OPn, PEPE, DOGE, WMTX

World Mobil Token (WMTX)

Major Bias: Indecision

The prevailing sentiment in this market is one of indecision, following a notable bullish run. The price rallied sharply from around the $0.06 level and surged to test above $0.10 before profit-taking pressure emerged.

This pullback has brought the market into a consolidation phase between the $0.09 and $0.10 range. While the broader structure remains bullish, the momentum has become more cautious. Buyers were unable to sustain aggressive upward pressure, leading the market to stabilize within this short-term trend channel.

The volume indicator supports this observation, as declining histogram bars suggest weakening momentum. Such behavior typically signals consolidation, as the market pauses to determine its next directional move.

Current Price: $0.0873

Market Capitalization: $69 million

Trading Volume: $1.7 billion

Top Five Trending Coins for February 15: WARD, OPn, PEPE, DOGE, WMTX

Trade crypto coins on BYBIT

XLM/USD Rebounds from $0.1310 Demand Zone as Bulls Attempt Recovery

XLM/USD Price Analysis – February 13, 2026

Stellar Lumens (XLM/USD) has generated a notable reaction from the major weekly demand zone near $0.1310. The price is climbing back toward the $0.1716 area as buyers re-enter the market. The asset is currently attempting to establish higher lows following an extended decline that tested critical support levels.


XLM/USD Daily Chart (Daily Key Levels):

Support Zones: $0.1319, $0.1000
Resistance Zones: $0.2164, $0.2647

XLM/USD Rebounds from $0.1310 Demand Zone as Bulls Attempt Recovery

XLM/USD Long-Term Trend – Bullish (Daily Chart)

XLM/USD is presently trading at $0.171430, up 4.27% during the current session following a strong bounce from lower support levels. The daily Money Flow Index (MFI) has climbed to 47.26, indicating improving capital inflows and suggesting that buying interest is beginning to return after an extended period of weakness.

What is XLM/USD Market Outlook?

The Awesome Oscillator (AO) has shifted to negative 0.033408, though the recent histogram bars show narrowing red columns transitioning toward green. This pattern typically emerges when bearish momentum begins to wane and reversal setups start to materialize, particularly when price is bouncing from historically significant support zones.

After declining from peaks near $0.4730 in earlier periods, Stellar found strong support at the $0.1310 weekly demand zone, an area that has historically produced explosive recoveries. The recent price action demonstrates textbook demand zone behavior, with price rejecting sharply from this level and printing a series of higher lows.

Volume patterns show expanding participation on the bounce, suggesting genuine accumulation rather than a temporary short squeeze. The critical question now centers on whether bulls can reclaim the $0.2164 resistance level with authority. Historical data from this demand zone indicates that once XLM establishes a base here, subsequent rallies often target the $0.2647 area or higher.

XLM/USD Rebounds from $0.1310 Demand Zone as Bulls Attempt Recovery

XLM/USD Short-Term Trend – Bullish (4 Hour Chart)

Examining the 4 Hour timeframe, XLM/USD has established a clear uptrend structure following the bounce from $0.1310. Price is currently consolidating around $0.1710 after the initial thrust higher, displaying healthy retracement behavior.

The Money Flow Index on this compressed interval reads 71.20, reflecting strong buying pressure at shorter timeframes. This elevated reading suggests capital is flowing into the asset as participants recognize the opportunity presented by the major demand zone test. The Awesome Oscillator sits at positive 0.009063, confirming that bullish momentum has taken hold on intraday charts.

XLM/USD Market Statistics
Current Price: $0.1716
Market Capitalization: $5.1 Billion
24H Trading Volume: $285 Million

You can purchase Stellar here. Buy XLM

Did Bitcoin Bottom at $60K? Poll Suggests More Downside Ahead

Bitcoin’s sharp decline to $60,000 earlier this month has sparked intense debate across the crypto market. While some investors believe the worst may be over, a recent community poll suggests that a majority expects further downside before a true bottom is established.

The leading cryptocurrency traded above $126,000 in early October, marking a fresh all-time high during the post-halving rally. However, that momentum reversed quickly. A violent liquidation cascade on October 10 erased billions in leveraged positions and triggered a broader market downturn.

Although Bitcoin initially managed to stay above six figures, it eventually lost the $100,000 level in November and failed to reclaim it. The asset closed 2025 in negative territory — the first post-halving year to end in the red — shaking long-term bullish confidence.

Crypto Community Questions the $60K Bottom

A recent poll conducted by crypto analyst Ali Martinez reveals that most participants do not believe Bitcoin has found its cycle low yet.

The survey results show that only 22.7% of voters believe $60,000 marked the bottom. Meanwhile, the largest group — 30.4% — predicts a drop toward $38,000. If that scenario unfolds, it would represent another steep correction from current levels near $70,000.

The poll reflects a cautious market sentiment. Despite Bitcoin already falling more than 50% from its October peak, many traders appear unconvinced that capitulation has fully played out.

Is Bearish Sentiment a Bullish Signal?

Interestingly, widespread pessimism can sometimes signal opportunity. Historically, Bitcoin has formed major bottoms when market confidence was deeply shaken. Sharp drawdowns often precede extended recovery phases, particularly after heavy liquidation events.

Still, macroeconomic conditions, liquidity trends, and broader risk appetite remain key variables. If selling pressure continues, technical support near the $60,000 region could be retested. A breakdown below that level may accelerate downside momentum.

For now, Bitcoin remains at a critical crossroads. Whether $60,000 proves to be a long-term bottom — or merely a pause before another leg lower — will likely depend on market structure and investor conviction in the weeks ahead.

Make money without lifting your fingers: Start using a world-class auto trading solution.

EightCapyour trusted Partner in CFDs, Cryptocurrencies and Stocks.