Crypto Clarity Bill Urgency: Bessent Pushes Swift Passage as Markets Turn Emotional

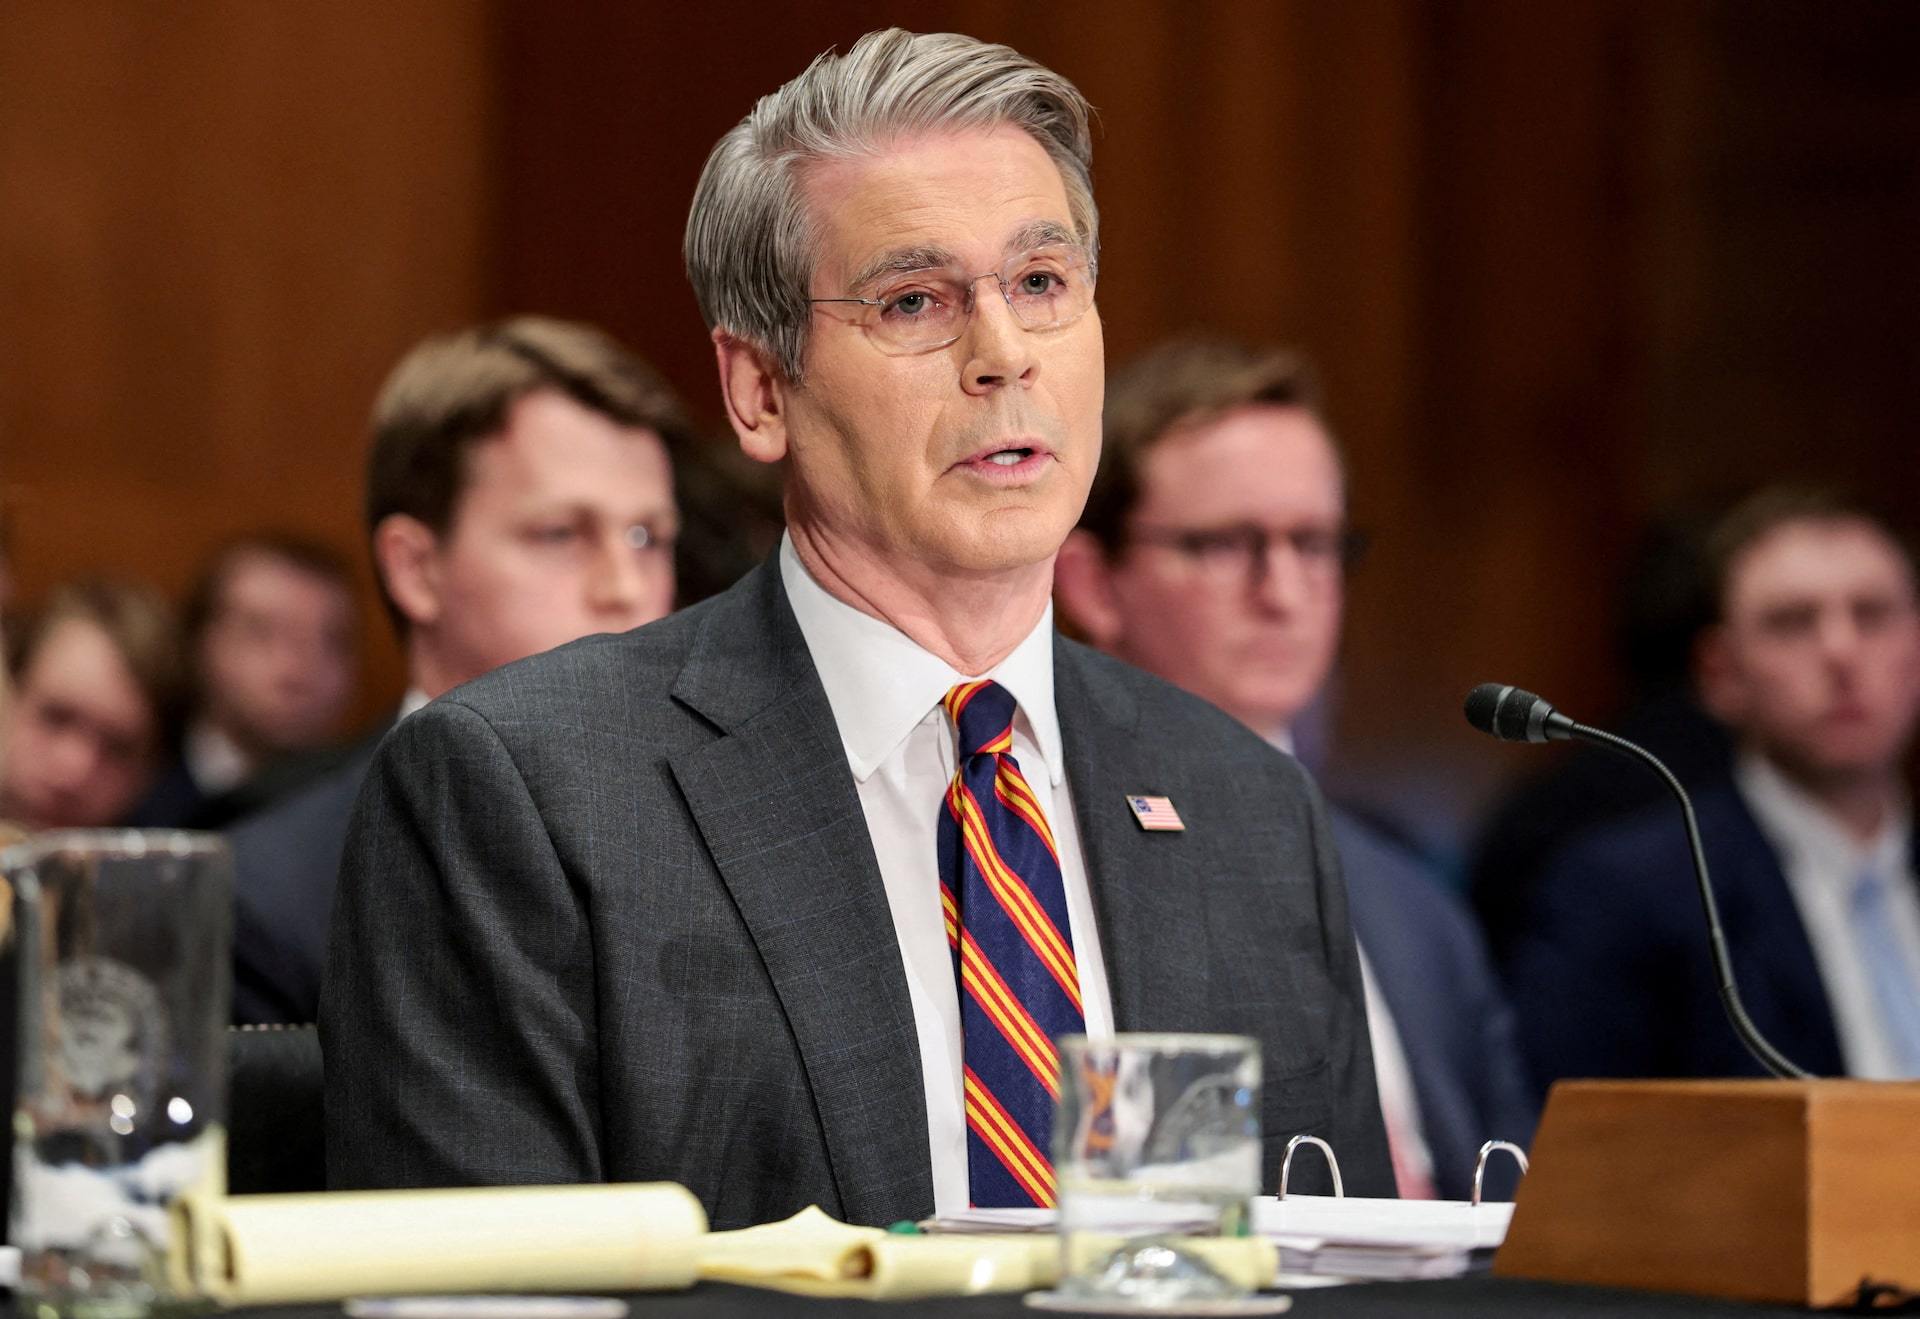
Crypto Clarity Bill’s urgency has intensified after Scott Bessent urged lawmakers to quickly pass the proposed market structure legislation this spring. He reportedly said that clearer rules under the Clarity bill would “give great comfort to the market” and encouraged Congress to move the proposal to the president’s desk without delay.

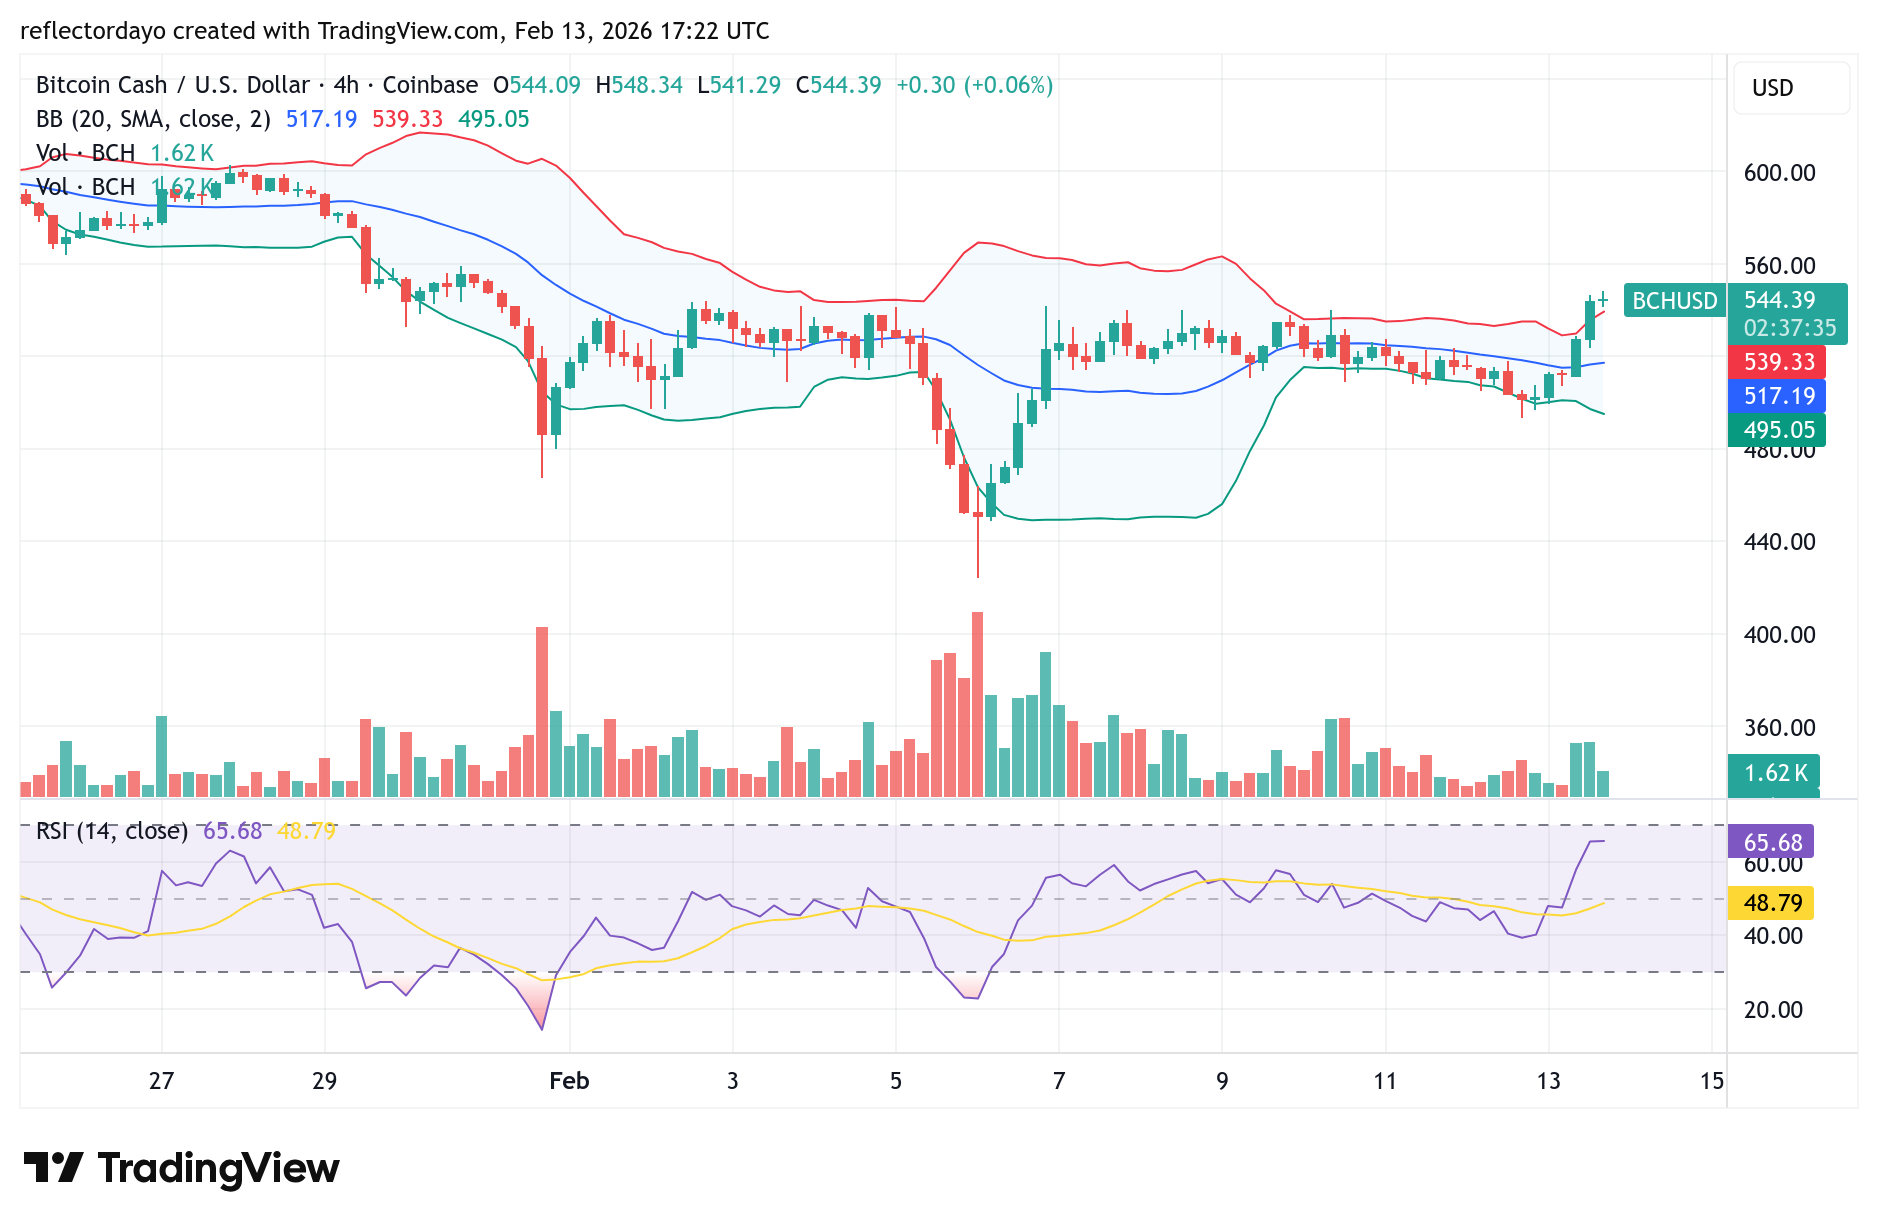
His comments came as Bitcoin dropped more than 29% in the past month, a fall he partly attributed to internal resistance within the crypto industry toward regulation. According to him, uncertainty has shaken investor confidence at a time when the market is already emotionally fragile.

Crypto Clarity Bill Urgency Deepens Amid Industry Divisions

Bessent reportedly explained that while some Democrats were willing to cooperate with Republicans to advance a crypto market structure bill, certain crypto firms had obstructed progress. He suggested that this opposition had not benefited the broader digital asset community. His tone was said to be calmer than in earlier remarks, when he described dissenting companies as “recalcitrant actors” and argued that firms unwilling to operate under regulation could relocate abroad.

Crypto Clarity Bill Urgency: Bessent Pushes Swift Passage as Markets Turn Emotional
Scott Bessent at the Senate Banking, Housing and Urban Affairs Committee hearing in financial Stability oversight council’s annual report. Capitol Hill in Washington, D.C., U.S. Source Reuters

Meanwhile, Coinbase withdrew its backing of the bill due to provisions limiting stablecoin yield offerings to retail customers. Its chief executive, Brian Armstrong, reportedly stated that the company would rather see no legislation than accept a flawed version. Bessent also warned that the upcoming midterm elections could disrupt negotiations if congressional control shifts. He further claimed that policies under the previous administration nearly triggered an “extinction event” for parts of the sector. As it stands, prediction platform Polymarket currently estimates a 62% chance that the Clarity Act becomes law by the end of 2026.

Gold Rally vs Bitcoin: Fear Shapes Investor Behavior

At the moment, market emotion has intensified as gold surged above $5,000 per ounce. Bitwise Chief Investment Officer Matt Hougan reportedly said that rising demand for assets outside government control, combined with fading regulatory clarity, marked a decisive moment for crypto markets. He added that geopolitical tensions, internal divisions at the Federal Reserve, and a US naval deployment toward Iran had pushed investors toward traditional safe havens.

Hougan reportedly observed that the current flight to safety had bypassed Bitcoin in favor of tangible commodities. He explained that until geopolitical uncertainty declines or liquidity conditions improve, Bitcoin may remain perceived as a high-risk asset in a world seeking protection.


In order to place winning trades with us via Bybit, you can open an account here.

POL (Prev. MATIC) Price Prediction: POL/USDT Bulls Are Rising to Prominence

Date: February 14, 2026

After price action in POL (Prev. MATIC) hit the $0.0900 baseline, it seems this has signaled a re-entry for bulls. As such, they are rising to the occasion and pushing the market back above the $0.1000 price level.

POL/USDT Long-Term Trend — Bullish (Daily Chart)

Key Price Levels

Resistance: $0.1000, $0.1150, $0.1300

Support: $0.0900, $0.0850, $0.0800

POL (Prev. MATIC) Price Prediction: POL/USDT Bulls Are Rising to Prominence

Although upside momentum appears to have reduced, POL (Prev. MATIC) keeps moving upward. The last price candle on this chart can be seen standing above the 9-day Exponential Moving Average (EMA) line and remains green. The lines of the Stochastic Relative Strength Index (SRSI) are still rising into the overbought region. The lead line is already above the 90 mark of the indicator, while the lagging one remains just above the 60 mark.

POL/USDT Price Prediction: POL (Prev. MATIC) Bulls Keep Their Edge (Daily Chart)

In the daily POL (Prev. MATIC) market, one can see that price activity is pushing its way higher. Over the past two sessions, upside forces have been prevalent. However, one can notice a gradual shift in the market’s momentum.

Nevertheless, the market remains above the 9-day EMA curve and stays green. The rise of the Stochastic RSI indicator lines seems exaggerated but decisive. Also, the distance between the lead and lagging lines of the indicator appears quite notable. This suggests volatility that may cause upside forces to weaken quickly.

POL/USDT Price Prediction: POL (Prev. MATIC) Bulls Stay Consistent Despite Weakness (4-Hour Chart)

In the short term, price activity continues pushing upward. The latest price candle remains green and stays above the 9-day EMA curve. However, the last price candle appears to be under some pressure.

POL (Prev. MATIC) Price Prediction: POL/USDT Bulls Are Rising to Prominence

At the same time, the SRSI indicator lines are already at the 100 level and are moving sideways in that region. This indicates that upside forces are still trying to remain relevant but are getting tired. If the market does not reverse, the $0.1100 level may act as sufficient resistance.

Get POL (prev. MATIC) here. Buy POL  

January CPI Inflation Cools to 2.4% as Core CPI Holds at 2.5%

The latest January CPI inflation report released on February 13 by the U.S. Bureau of Labor Statistics delivered cautious optimism to households and investors. Officials reported that headline inflation rose 0.2% in January and 2.4% compared with a year earlier, coming in below analyst projections.

Core inflation, which excludes food and energy, increased 0.3% for the month and stood at 2.5% annually. While this figure matched forecasts, it remained above the Federal Reserve’s 2% objective.

As it stands, economists noted that the 2.4% annual rate represents the lowest level since May 2025. They explained that declining energy costs and favorable comparison effects from last year helped push inflation lower. Energy prices fell 1.5% during the month, largely because gasoline prices dropped 3.2%.

January CPI Inflation Shows Cooling Trend, but Core CPI Remains Elevated

Although January CPI inflation slowed, certain categories continued to exert pressure. Shelter costs rose 0.2% in January and were up 3.0% from a year earlier. Food prices also increased 0.2% month over month and 2.9% annually. Services such as medical care and recreation recorded additional gains, keeping core inflation firm.

At the moment, market reaction is reflecting relief rather than excitement. As a result, the stock futures initially declined before moving higher, signaling measured confidence. Also, major equity indexes traded unevenly, while the cryptocurrency market showed mixed results among leading digital assets. Meanwhile, gold prices climbed 1.6% to $4,998.61 per ounce, and silver also advanced, indicating that investors continued seeking safe-haven assets.

The report followed months in which inflation remained above target throughout 2025. It was also released after a short delay caused by a partial government shutdown. Officials stated that updated seasonal adjustments and prior-year revisions were included, but they emphasized that no significant trend changes emerged.

Post from @BullTheoryio stating the actual and expected CPI

Federal Reserve Policy Outlook and Consumer Impact

According to market data from the CME Group FedWatch tool, traders currently assign a 90.3% probability that the Federal Reserve will maintain its benchmark rate at the upcoming meeting.

January CPI Inflation Cools to 2.4% as Core CPI Holds at 2.5%
CME Group FedWatch tool

Meanwhile, the policymakers suggest patience needs to be applied, noting that a careful look into potential development is needed.


In order to place winning trades with us via Bybit, you can open an account here.

Is Bitcoin Cash (BCH) About to Pump? Price Breaks Key $540 Resistance

The $540 price level has been a critical inflection point for the Bitcoin Cash (BCH) market. It has consistently acted as a strong resistance zone, rejecting multiple bullish recovery attempts in recent sessions. A review of the daily chart shows that several upward price movements stalled at this level, reinforcing its technical significance.

However, in today’s trading session, price action delivered a notable shift in momentum. Bitcoin Cash printed a strong bullish engulfing candlestick and successfully broke above the key $540 resistance level. This decisive move suggests growing buying pressure and a potential change in short-term market structure.

The key question now is whether this breakout will hold and confirm a sustained bullish reversal or if it will prove to be a temporary move above resistance. Traders will likely watch for a strong daily close above $540 to validate continued upside momentum.

Bitcoin CASH (BCH/USD) Market Data

  • BCHUSD Price Now: $544
  • BCH/USD Market Capitalization: $10.5 billion
  • BCH/USD Circulating Supply: 19.99 million BCH
  • BCH/USD Total Supply: 19.99 million BCH
  • BCH/USD CoinMarketCap Ranking: #10

Bitcoin Cash Approaches a Pivotal Breakout Zone

In the embedded analysis, the presenter reviews Bitcoin Cash (BCH) trading around $527, up roughly 4.8% on the day after rebounding from the $494 support region, which had previously been identified as a minimum downside target. Despite the bounce, initial skepticism remained due to relatively light volume and the formation of a lower high, suggesting the possibility of another pullback toward the $480–$465 zone—an 8–13% correction from current levels. The analyst noted that a failure to break convincingly above $540–$542 on a daily closing basis would likely keep downside risks in play.

Short-term technical indicators, however, began to present a more constructive outlook. On the 1-hour and 4-hour timeframes, the MACD and Stochastics reflected improving bullish momentum, while the RSI hinted at a breakout from its prior lower-high structure. The critical downside invalidation level was placed around $511, with sustained closes below that mark potentially opening the door for a deeper retracement toward the mid-$400s.

Shifting to the daily timeframe, momentum signals appeared even more encouraging. The RSI displayed a double-bottom pattern near the 40 level—historically a supportive zone—while price action showed signs of breaking out of a broader lower-high formation. These developments prompted the analyst to pivot toward a bullish bias, contingent on confirmation above the $540–$542 resistance zone.

If upside continuation is confirmed, projected targets extend toward the $620–$650 range, with expectations that the bulk of the move could develop in the coming week rather than over the typically quieter weekend sessions. Overall, the structure is described as a potentially decisive breakout phase for Bitcoin Cash, especially if the monthly candle closes firmly above $600—an outcome that would signal a strong bullish reversal within its multi-month consolidation range.

Key Levels to Monitor

  • Resistance: $550, $560, $570
  • Support: $500, $450, $400

Is Bitcoin Cash (BCH) About to Pump? Price Breaks Key $540 Resistance

Bitcoin Cash (BCH) Analysis: Technical Viewpoint

The bullish recovery in the Bitcoin Cash market has pushed the price above the critical $540 resistance zone. So far, price action has remained stable above this level, showing resilience and withstanding emerging bearish pressure.

However, there is reason for caution. The volume indicator, reflected by relatively small recent histogram bars, suggests that the current breakout may lack strong participation. Although the move above $540 appears encouraging, the limited trading volume raises concerns about whether the bullish momentum can be sustained at this level.

ParityUSD Progress Update Signals Growing DeFi Development on Bitcoin Cash

In a recent post on X, Bitcoin Cash (BCH), via the account BitcoinCashOG, shared an encouraging message highlighting progress on ParityUSD. The update, tagged with #DeFi and #ParityUSD, emphasized that “good things come to those who wait,” suggesting steady development behind the scenes.

This progress update points to continued expansion within the Bitcoin Cash ecosystem, particularly in the decentralized finance (DeFi) sector. Advancements like ParityUSD could enhance BCH’s utility beyond simple peer-to-peer transactions, potentially strengthening network adoption and long-term value propositions.

Technical Viewpoint (Continued)

On the other hand, if the market maintains its buoyancy in the coming sessions, increased confidence could attract additional buyers. Stronger participation would help reinforce the breakout and support the continuation of the broader bullish recovery.

Is Bitcoin Cash (BCH) About to Pump? Price Breaks Key $540 Resistance

BCH/USD 4-Hour Chart Outlook

On the lower timeframe chart, bullish sentiment remains evident in the market. However, as the price approaches the critical $550–$560 zone, upward momentum appears to be slowing, suggesting that sellers are actively defending this resistance area.

If bullish pressure continues to outweigh bearish sentiment, even marginally, the recovery could extend toward the $560 level. A decisive break above this zone may open the door for consolidation above $560, which would strengthen the case for a sustained move higher.

Trade crypto coins on BYBIT

BTC/USD Consolidates Near $67,260 as Market Digests Recent Volatility

BTC/USD Price Analysis – February 12, 2026

Bitcoin (BTC/USD) is navigating a period of consolidation around the $67,264 level following a volatile trading session that saw price test lower support zones before recovering. The asset is currently positioned between critical technical levels as participants assess whether recent weakness represents temporary distribution or the beginning of a deeper correction.


BTC/USD Daily Chart (Daily Key Levels):

Support Zones: $62,206, $55,000
Resistance Zones: $73,998, $83,130

BTC/USD Consolidates Near $67,260 as Market Digests Recent Volatility

BTC/USD Long-Term Trend – Bearish (Daily Chart)

BTC/USD is presently trading at $67,250, up 0.30% during the current session after recovering from earlier lows. The daily Money Flow Index (MFI) registers 38.87, indicating subdued capital inflows and positioning the asset in territory where buying conviction remains notably weak.

What is BTC/USD Market Outlook?

The Awesome Oscillator (AO) has climbed to positive 4,598.5, suggesting that short-term momentum has shifted bullish following the recent bounce. However, the histogram displays diminishing green bars compared to previous rallies, a pattern that often emerges when recovery attempts lack conviction.

After reaching peaks near $123,350 in earlier periods, Bitcoin has entered a consolidation phase characterized by volatile swings and inability to establish a clear directional bias. The recent price action shows repeated tests of the $62,206 support level, which has so far held but displays weakening buying absorption with each successive probe.

The critical question revolves around whether bulls can reclaim the $73,998 resistance zone with authority. A decisive break above this level accompanied by expanding volume would challenge the bearish narrative and could unlock movement toward $83,131 or higher.

BTC/USD Consolidates Near $67,260 as Market Digests Recent Volatility

BTC/USD Short-Term Trend – Neutral (4 Hour Chart)

Examining the 4 Hour timeframe, BTC/USD has stabilized around $67,260 following a sharp intraday reversal that saw price bounce from lower levels. The short-term structure reflects choppy action with neither bulls nor bears establishing clear control.

BTC/USD Market Statistics
Current Price: $67,264
Market Capitalization: $1.33 Trillion
24H Trading Volume: $48.5 Billion

Place winning BTC trades with us. Get BTC here

BCH/USD Retreats to $511.00 as Bearish Momentum Intensifies Following Recent Breakdown

BCH/USD Price Analysis – February 11, 2026

Bitcoin Cash (BCH/USD) has encountered renewed selling activity, driving price down to the $511.00 area after failing to sustain gains above the $520.00 psychological level. The asset has broken down from recent consolidation patterns, with bearish forces regaining control across multiple timeframes.

BCH/USD Daily Chart (Daily Key Levels):

Support Zones: $446.57, $384.67
Resistance Zones: $520.07, $612.90

BCH/USD Retreats to $511.00 as Bearish Momentum Intensifies Following Recent Breakdown

BCH/USD Long-Term Trend – Bearish (Daily Chart)

BCH/USD is presently trading at $511.60, down 0.81% during the current session. The daily Money Flow Index (MFI) sits at 51.68, indicating relatively neutral capital flows but with a declining trajectory that suggests buying interest is gradually waning.

What is BCH/USD Market Outlook?

The Awesome Oscillator (AO) has turned decisively negative at -44.52, confirming that bearish momentum has accelerated following the recent breakdown. The histogram displays expanding red bars, a pattern that typically emerges when selling pressure intensifies and buyers retreat from defending support levels.

After reaching peaks near $650.00 in earlier periods, Bitcoin Cash has entered a distribution phase characterized by successive failures at overhead resistance and methodical erosion of support zones. The recent price action shows a clear violation of the $520.00 level, which had previously acted as a pivot point. This breakdown represents a structural shift, as the asset is now forming lower swing lows with minimal buying absorption on pullbacks.

The immediate focus centers on whether the $446.50 support zone can provide meaningful resistance to the decline. If this level fails to attract accumulation and price continues to deteriorate, the next logical target emerges around $384.67.

BCH/USD Retreats to $511.00 as Bearish Momentum Intensifies Following Recent Breakdown

BCH/USD Short-Term Trend – Bearish (4 Hour Chart)

Transitioning to the 4 Hour perspective, BCH/USD remains entrenched in bearish territory with price consolidating around $511.20. The intraday structure continues to reflect weakness, with periodic bounces being quickly absorbed by renewed waves of distribution.

The Money Flow Index on this compressed timeframe reads 39.96, reflecting subdued buying interest at shorter intervals. This reading indicates that capital inflows remain anemic, with participants hesitant to initiate long positions in the current environment. The Awesome Oscillator sits at negative 6.88, confirming that bearish momentum persists across intraday sessions without meaningful signs of reversal.

BCH/USD Market Statistics
Current Price: $511.27
Market Capitalization: $10.1 Billion
24H Trading Volume: $425 Million

Place winning BCH trades with us. Get BCH here

Chiliz (CHZ/USDT) Shows Bearish Trend Reversal After Rejection at Resistance

CHZ/USDT Price Analysis: CHZ/USDT Reacts and Breaks Through Three Order Blocks

CHZ/USDT reversed with a strong bearish move, breaking below three Order Blocks (OB) at price levels $0.0510, $0.0430, and $0.0350. This signals the market is not making a corrective move but beginning a new bearish trend.

CHZ/USDT Key Levels

Support Levels: $0.0340, $0.0290
Resistance Levels: $0.0460, $0.0600

Chiliz (CHZ/USDT) Shows Bearish Trend Reversal After Rejection at Resistance

On the daily timeframe, there is a Change of Character (CHoCH) that led to a bearish move. After the rejection from the order block region at price level $0.0510, price broke below short-term support at price level $0.0430. The support becomes resistance, where the market retests and continues the downtrend.

On the daily timeframe, the Moving Average Convergence Divergence (MACD) indicator remains below the zero line, and the MACD line is not making any cross above the signal line, signalling this is a bear-dominated market.

Chiliz (CHZ/USDT) Shows Bearish Trend Reversal After Rejection at Resistance

Market Expectation

On the 4-hour timeframe, price remains below the 200 Moving Average from 29 January to February, confirming the bearish market trend. Price also forms a bearish descending channel. The recent pullback appears corrective rather than a full reversal. Price is likely to make another Break of Structure and likely break through the support zone at level $0.0340.

You can purchase Lucky Block here.  Buy LBLOCK

Note: Cryptosignals.org is not a financial advisor. Do your research before investing your funds in any financial asset or presented product or event. We are not responsible for your investing results.

Compound (COMP/USDT) Extends Bearish Momentum After Support Breakdown

COMP/USDT Price Analysis: COMP/USDT Continues Downtrend After Breaking Three Support Levels

COMP/USDT remains in a strong bearish trend, although the market is reacting to the support at price level $15.90. Despite this reaction, price is still expected break below support.

COMP/USDT Key Levels

Support Levels: $15.90, $13.50
Resistance Levels: $19.00, $23.50

Compound (COMP/USDT) Extends Bearish Momentum After Support Breakdown

On the daily timeframe, the market formed a bearish head and shoulders chart pattern from October to November, which led to the sell-off that followed. The market reacted to support levels at $23.54 and $18.97 and still broke out following this trend. Given that there is no spike in volume at the support level of $15.90, it is likely to break below this support, as the volume from buyers is not strong enough to reverse the trend.

On the daily timeframe, the market pulled back from the support to the discount zone of the Fibonacci Retracement (0.5%), where it continued its bearish trend, which is likely to lead to another Break of Structure (BOS). Price remains below the 200 Moving Average, confirming the overall bearish direction of the market.

Compound (COMP/USDT) Extends Bearish Momentum After Support Breakdown

Market Expectation

On the 4-hour timeframe, price is forming a descending triangle chart pattern at the support level, signalling that buyers are trying to resist, but sellers are gaining momentum. Any upward movement at this stage is expected to be corrective unless price reclaims and holds above major resistance levels.

You can purchase Lucky Block here.  Buy LBLOCK

Note: Cryptosignals.org is not a financial advisor. Do your research before investing your funds in any financial asset or presented product or event. We are not responsible for your investing result.

Cardano Price Consolidation or Relief: Preparing for the Next Move?

Cardano’s price over the last 24 hours has risen by 1.48% to $0.263. This shows the Cardano market is currently outperforming a declining crypto market, as gains stem from a recovery after hitting intense selling conditions.

As it stands, ADA needs to maintain $0.262 and clear the $0.267 resistance for a space within the $0.269–$0.302 range as community sentiment remains bullishly high. However, failure to break through risks a retest of the $0.226 support level.

Currently, Cardano trades at $0.2620 with over 15 million traded volumes on the daily chart.

Cardano Price Consolidation or Relief: Preparing for the Next Move?
ADAUSDT- Daily Chart

Technical Indicators

Major Resistance Levels: $0.2717, $0.3010, and $0.3320

Major Support Levels: $0.2520, $0.2450, and $0.2200

Technical Analysis

Despite the slight gains recorded by Cardano against Tether in recent times, the market remains bearish, with the price completely trading under the clusters of the set of Exponential Moving Averages (EMAs). At the moment, the long-period EMAs are compressing, signaling that the downward momentum is stalling and a potential trend change or period of consolidation is approaching.

However, the Stochastic RSI signals that Cardano price hasn’t moved up significantly; meanwhile, the momentum indicator appears maxed out, suggesting that a brief pullback or sideways consolidation is likely before ADA can attempt to break the $0.3010 resistance level. To this end, if the blue line crosses back below the orange line while in this upper zone, a continued downtrend may be triggered.

Elliott Wave Analysis as Cardano Price Prepares for the Next Move

Cardano is currently testing a micro support zone between $0.233 and $0.258. While there has been a minor bounce, the movement appears to be a corrective three-wave pattern rather than a bullish breakout. As it stands, the CPI data is looming, but momentum remains low, and the risk of further downside is high. Unless ADA successfully completes a five-wave impulsive move and breaks key resistance at $0.305, further downside is likely.

On the larger timeframe, Cardano price has been correcting for over a year and seems to be approaching its 2023 lows. As it stands, no definitive bottom has been confirmed. Though a reversal could happen at any time, the current structure remains fragile.

ADA/USDT Analysis: Where from Here?

ADA/USDT on the 4-hour chart is showing a bearish configuration with the sets of EMAs sloping downward, acting as dynamic resistance alongside. As it stands, the pair is scraping the bottom as a recent attempt at recovery seems to be thinning out.

Additionally, this lack of buying interest is further amplified by the dropping momentum oscillator with directionless lines. To this end, if momentum fails to return and the price fails to reclaim $0.2700 short-term resistance, a move towards $0.2400 may be triggered.

Cardano Price Consolidation or Relief: Preparing for the Next Move?
ADAUSDT-4H Chart


You can purchase crypto coins here. Buy Crypto