Solana (SOL) Price Prediction: SOL/USDT Heads Towards the $75 Mark

Date: February 13, 2026

It is a bear market, and the cryptocurrency sector is feeling the pressure. Price action in the Solana market has continued to decline toward lower levels. The market is already trading below key levels, and headwinds may continue to weigh on it.

Long-Term Trend — Bearish (Daily Chart)

Key Price Levels

Resistance: $80, $85, $90

Support: $75, $70, $65

Solana (SOL) Price Prediction: SOL/USDT Heads Towards the $75 Mark

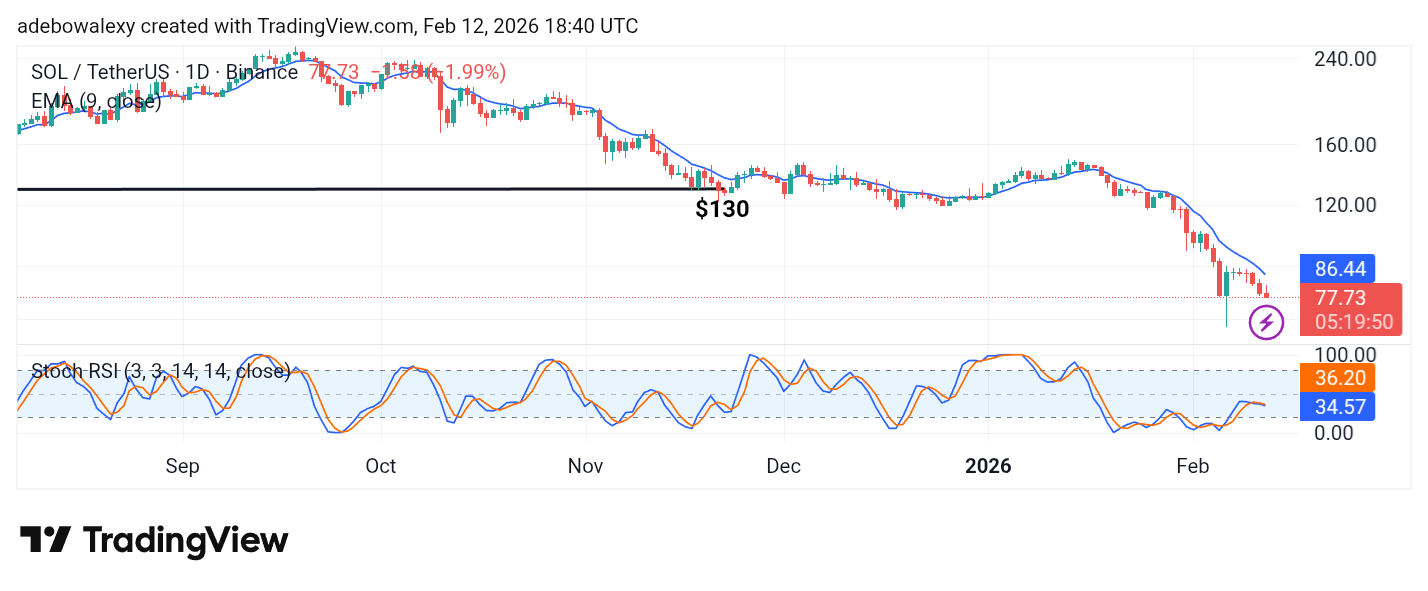
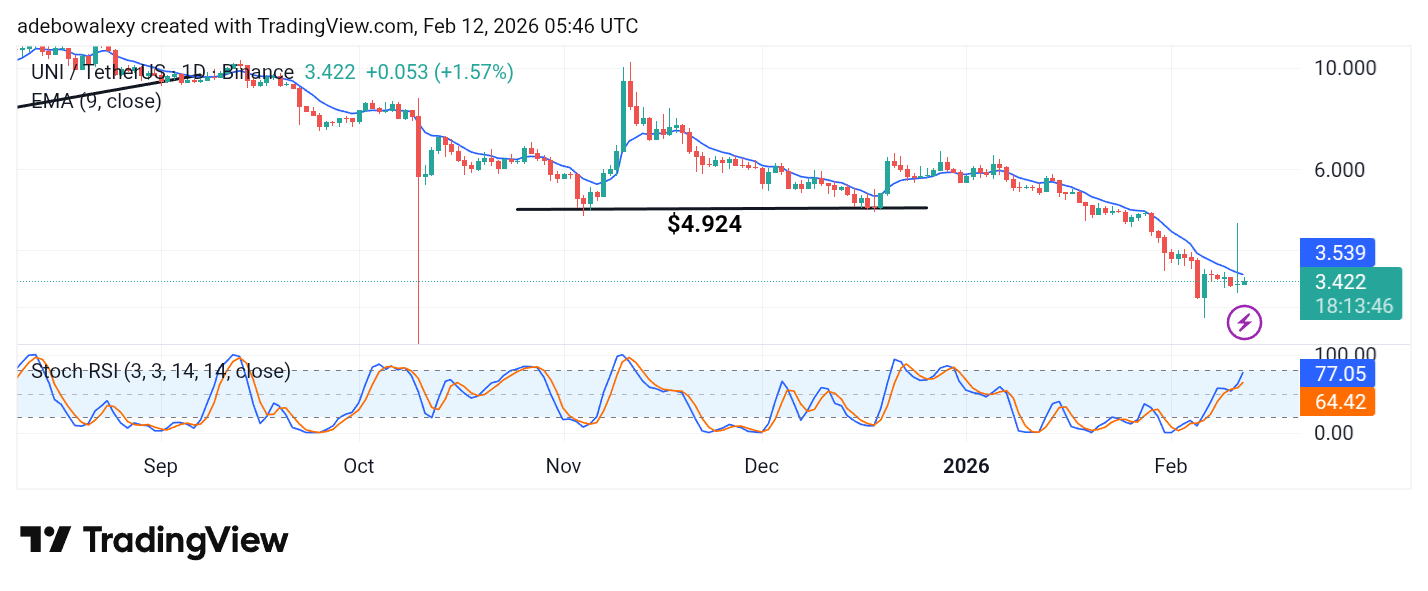
The Solana market has been in the red for six consecutive sessions. As such, prices have been moving toward lower levels below the 9-day Exponential Moving Average (EMA) line. The current session is represented by a red price candle that appears to be pushing the token further below the 9-day EMA curve.

The lines of the Stochastic Relative Strength Index (SRSI) indicator are largely moving sideways but show a slight downward tilt toward the end.

Solana (SOL) Price Prediction: SOL Remains Prone to Further Declines

The ongoing session maintains bearish momentum in the Solana market. The EMA lines form a strong resistance barrier above price activity. This keeps bearish sentiment firmly in control.

Additionally, the movement of the SRSI indicator suggests that price action remains subdued and may continue to trend lower under persistent headwinds.

SOL Price Prediction: SOL/USDT Heads Towards the $75 Mark (4-Hour Chart)

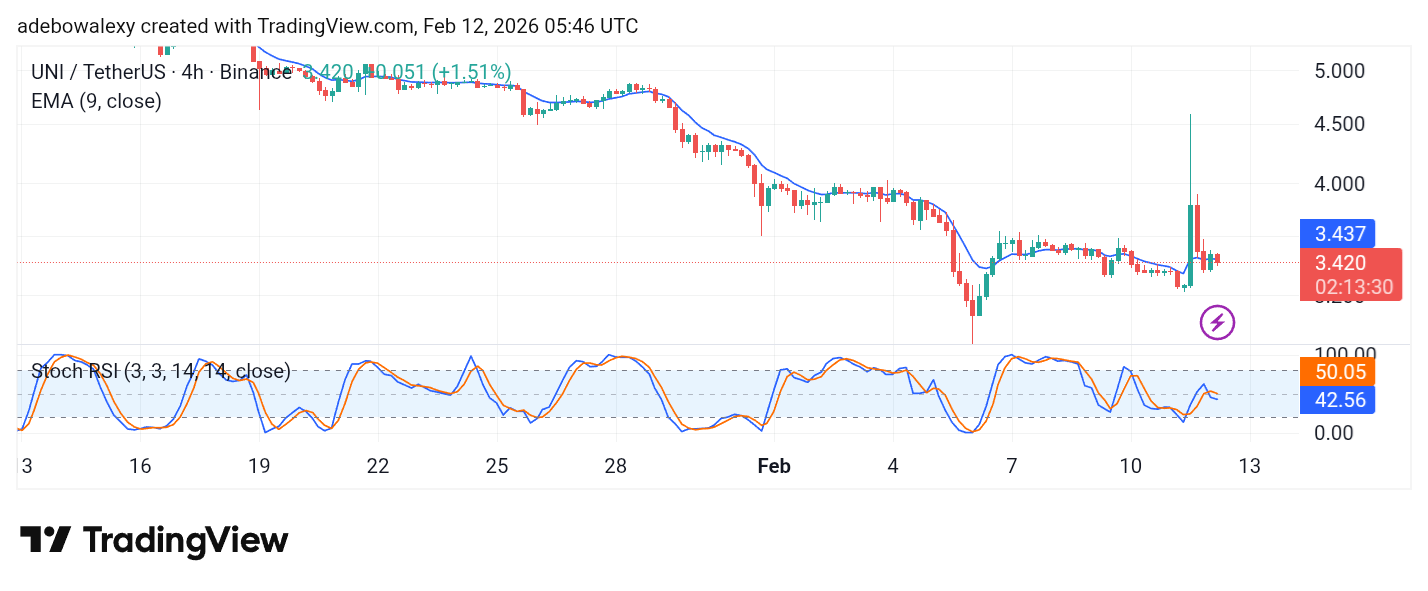
On the SOL/USDT 4-hour chart, price action remains under strong bearish pressure. The latest price candle is red with a prominent body and has pushed trading activity below the 9-day EMA curve.

Solana (SOL) Price Prediction: SOL/USDT Heads Towards the $75 Mark

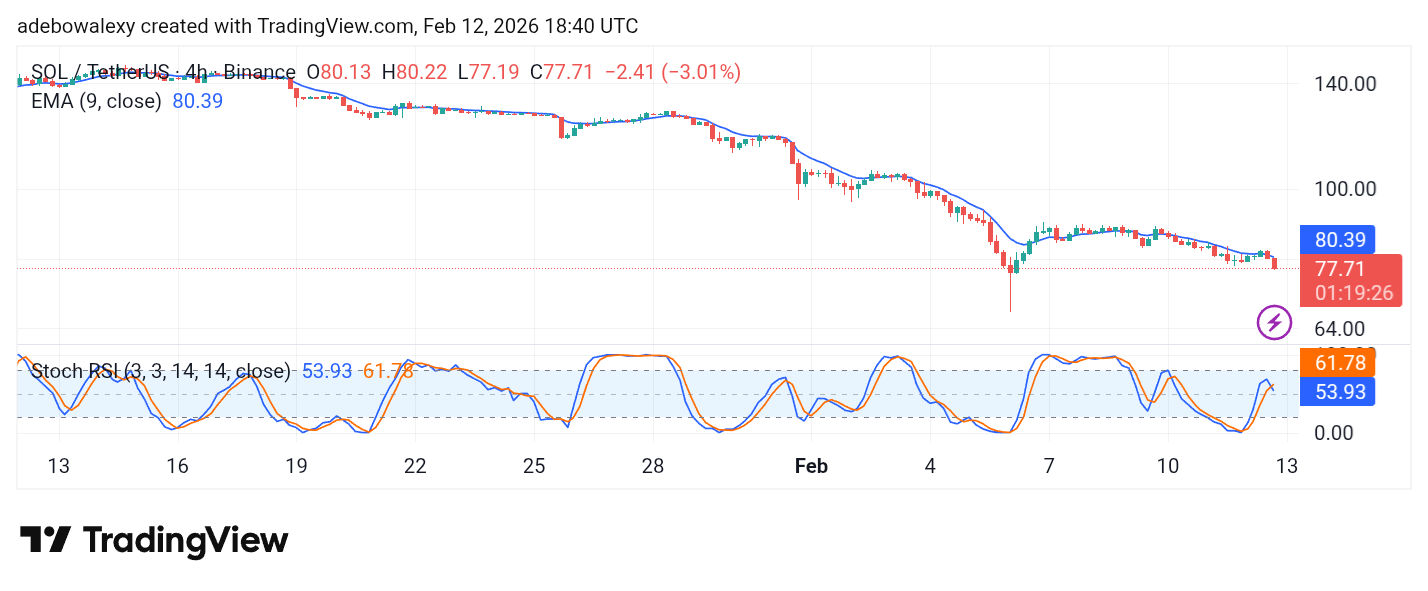
Furthermore, the Stochastic Relative Strength Index (SRSI) indicator has just delivered a downward crossover, although its lines are still largely moving sideways. Nevertheless, the market remains positioned for lower price levels and may approach the $75 mark.

Get Solana (SOL) here. Buy SOL

XRP Bullish Momentum Gains Strength as Leadership Reaffirms Central Role

XRP’s bullish momentum intensified after Ripple’s top executives publicly restate the digital asset’s importance to the company’s long-term plans. On Feb. 10, Ripple CEO Brad Garlinghouse shared messages on X linked to XRP Community Day and Ripple’s broader direction. He emphasized that XRP remains deeply tied to Ripple’s vision of creating an Internet of Value.

Responding to concerns raised online about whether Ripple was still prioritizing XRP as a bridge asset, Garlinghouse stated on Feb. 9 that he was pleased the message was “finally even clearer.” He went further by stating that the “XRP family has and always will be top of mind for Ripple.” His comments were seen as a direct response to discussions questioning the company’s consistency as institutional decentralized finance activity on the XRP Ledger expands.

Ripple XRP Strategy Reinforces XRP Bullish Momentum

Garlinghouse explained that recent developments are not a change in direction but the execution of long-standing plans. He recalled earlier remarks from October, when he said XRP stands at the center of everything Ripple builds. According to him, as Ripple develops solutions aimed at enabling seamless value transfer worldwide, XRP remains fundamental.

XRP Bullish Momentum Gains Strength as Leadership Reaffirms Central Role

This focus was underlined further at XRP Community Day, which took place on February 11 and 12, 2026, across EMEA, the Americas, and APAC via X Spaces. Ripple’s leadership stated the conversations focused on the XRP Ledger’s role in institutional strategy. Topics included integrating XRP into regulated financial products such as spot exchange-traded funds and expanding its use in large-scale financial systems.

Institutional DeFi Framework Positions XRP at the Core

Other Ripple executives echoed similar confidence. Reece Merrick, Ripple’s managing director for the Middle East and Africa, stated on X that XRP would continue to position at the core of Ripple’s vision.

Ripple’s recently published Institutional DeFi framework outlined how XRP supports payments, liquidity management, collateral use, and on-ledger credit markets. As it stands, the framework explained that XRP enables real-time settlement, facilitates transaction fee burns, supports reserve requirements, and powers auto-bridging across foreign exchange, stablecoins, and tokenized assets.

In conclusion, these developments appear to have enhanced XRP’s upside momentum, renewing confidence among investors, developers, and the broader crypto community alike.


In order to place winning trades with us via Bybit, you can open an account here.

Immutable X (IMX/USD) Breaks Out to the Upside—Is a 50x–100x Rally Possible?

The Immutable X (IMX/USD) market has established solid support around the $0.15 level following an extended period of consolidation. After stabilizing within this range, price action has now broken out to the upside, signaling the early stages of a potential bullish recovery.

However, despite this upward breakout, IMX remains deeply positioned within the broader bearish structure on the higher timeframes. This suggests that while momentum is beginning to shift, the market has not yet fully transitioned into a confirmed bullish trend.

The current price movement indicates cautious optimism among traders. Although bulls are attempting to regain control, selling pressure remains evident, leaving bears with a relative advantage for now. A sustained move above key resistance levels would be necessary to confirm a stronger bullish reversal.

Immutable X (IMX/USD) Market Data

  • IMX/USD Price Now: $0.1642
  • IMX/USD Market Capitalization: $316 million
  • IMX/USD Circulating Supply: 1.98 billion
  • IMX/USD Total Supply: 2 billion
  • IMX/USD CoinMarketCap Ranking: #105

Why Some Analysts Believe Immutable X Could Deliver 50x–100x Growth

The YouTube video highlights Immutable X (IMX) as a high-potential crypto gaming project that could generate significant long-term returns, possibly in the 50x–100x range. Immutable X is a Layer-2 scaling solution built on Ethereum, powered by advanced zero-knowledge (zk-rollup) technology that enables fast transactions with zero gas fees for users. The platform is designed specifically for blockchain gaming and NFTs, allowing developers to launch play-to-earn games where each title functions as its own mini digital economy. By holding the IMX token, investors gain exposure to the broader Immutable X ecosystem, which could benefit from the success of multiple games built on the network. The video compares this potential to the massive revenues generated by traditional gaming giants—such as Pokémon Go, Fortnite, and Warzone—arguing that if blockbuster-level games successfully launch on Immutable X, demand for IMX could increase significantly over time.

Key Levels to Monitor

  • Resistance: $0.18, $0.20, $0.25
  • Support: $0.13, $0.10, $0.09

Immutable X (IMX/USD) Breaks Out to the Upside—Is a 50x–100x Rally Possible?

Immutable X (IMX) Analysis: Technical Viewpoint

In today’s trading session, there appears to be a slight bearish divergence developing in the Immutable X market. The candlestick representing today’s price action is significantly larger than yesterday’s, suggesting strong upward movement. However, the corresponding trading volume does not reflect the same level of strength, indicating that the breakout may lack solid conviction.

Although the market has broken above the consolidation zone around the $0.15 level, caution is beginning to emerge in the crypto signal. The weak volume behind this breakout raises concerns that the bullish recovery may struggle to extend toward the next major resistance at $0.18.

If buying pressure does not increase and bullish momentum fails to strengthen, the price could retreat and return to the $0.15 range, potentially re-entering consolidation.

Immutable X (IMX/USD) Breaks Out to the Upside—Is a 50x–100x Rally Possible?

IMX/USD 4-Hour Chart Outlook

Shifting focus to the 4-hour chart provides a clearer and more detailed view of the market structure. From this timeframe, we can observe that the candlestick for the ongoing session is relatively small compared to the previous bullish candles, indicating a slowdown in momentum.

Additionally, trading volume has declined, further confirming a reduction in buying pressure. This weakening momentum suggests that the market could retrace and return to the $0.15 range.

However, if the price manages to maintain support around the $0.16 level, the bullish recovery could regain strength and potentially attempt another upward move.

Trade crypto coins on BYBIT

Ethereum Price Records Slight Uptick and ABC Wave Structure Amid Strong Sell-Off

The Ethereum price in the last 24 hours has risen by 1.14% to $1,969.83, outperforming the broader market. This movement appears to be primarily driven by capital outflow from Bitcoin into higher-beta altcoins. This is evidenced in the rising altcoin market capitalization, the technical bounce from oversold conditions, and improving sentiment in the altcoin market.
Looking ahead, Ethereum needs to hold above the current position to potentially test the higher levels, as a drop below the $1,749 support level could occur.
Currently, Ethereum trades at $1,959.81 with more than 105,000 traded volumes on the daily timeframe.

Ethereum Price Records Slight Uptick and ABC Wave Structure Amid Strong Sell-Off
ETHUSDT – Daily Chart

Technical Indicators

Major Resistance Levels: $2,000, $2,390, and $2,850

Major Support Levels: $1,900, $1,850, and $1,700

Technical Analysis

Technically, the Ethereum price is in a sharp downward trend. The token appears on the daily chart to be trading well below its major moving averages (20, 50, 100, 200). At the moment, the recent high volume suggests intense selling pressure. Meanwhile, the Stochastic RSI beneath the chart appears to be rising from oversold levels, indicating a potential V-shaped short-term relief bounce. However, the overall structure remains bearish due to the positioning of the price below the $2,390 short-term moving average.

To this end, even with the recent bullish development, the market remains in a fragile state. However, a break above the 20-day SMA would confirm a bullish setup, but for now, caution is necessary.

Ethereum Elliott Wave Update

Ethereum remains in a selloff mode even with the recent 24% bounce off the 78.6% retracement level. As it stands, the recovery still lacks a clear five-wave impulsive structure without a definitive bottom. Though the move remains speculative until key resistance is broken, the current outlook suggests a potential ABC corrective rally toward $3,500.

From another angle, it appears that a bearish five-wave decline may be forming, risking a drop to the $1,600 area. However, a three-wave corrective move signals that further lows should be the main target of the investors at the moment, as a five-wave impulsive advance would favor a more bullish recovery.

ETH/USDT Analysis: Is Ethereum Ready for a Major Reversal?

Similar to the daily chart, ETH/USDT on the 4-hour chart is showing a downtrend. The pair has experienced a free fall in the recent session. However, following a dramatic fall, the price action suggests an attempt to recover the short-term 20-period MA while stabilizing close to local lows.

To this end, the Stochastic RSI is suggesting a possible short-term rescue rebound with a bullish from an oversold condition. Meanwhile, the buying volume seems to be low, and the overhead resistance around $2,100 indicates that any upward rise might not last long.

Ethereum Price Records Slight Uptick and ABC Wave Structure Amid Strong Sell-Off
ETHUSDT – 4H Chart


You can purchase crypto coins here. Buy Crypto

Uniswap (UNI) Price Prediction: UNI/USDT Buyers Get Pushed Back

Date: February 12, 2026

The Uniswap market on the daily chart saw a strong price increase in the previous session. However, this was followed by a heavy contraction after the spontaneous surge. Even now, downward forces remain dominant.

UNI/USDT Long-Term Trend — Bearish (Daily Chart)

Key Price Levels

Resistance: $3.50, $4.00, $4.50

Support: $3.00, $2.50, $2.00

Uniswap (UNI) Price Prediction: UNI/USDT Buyers Get Pushed Back

As of the time of writing, the Uniswap daily chart shows that trading remains in the green. However, price action is still below the 9-day Exponential Moving Average (EMA) line. Additionally, recent price candles on the chart are quite small. Despite this, the lines of the Stochastic RSI (SRSI) indicator are rising steeply into the overbought region.

Uniswap Price Prediction: UNI Buyers Are Trying to Stay Relevant

Although downward forces have been significantly resisted, it can be seen that sellers are still fighting back. The last two price candles on the Uniswap daily chart are still red despite the recent pushback.

Additionally, they are positioned below the 9-day EMA curve. The SRSI indicator lines are still rising upward. This suggests that upside forces are attempting to regain control but are currently facing strong downward pressure.

Uniswap Price Prediction: UNI/USDT Bears Look Threatening in the Short Term (4-Hour Chart)

Even in the near term, the Uniswap market has been declining during the ongoing session. The latest price candle on the 4-hour chart is red and has pushed prices below the 9-day EMA curve.

Uniswap (UNI) Price Prediction: UNI/USDT Buyers Get Pushed Back

Meanwhile, the SRSI indicator lines are taking a slight downward trajectory around the 50 threshold. However, price action can still be seen hovering around the 9-day EMA curve, suggesting that the market may currently be undecided. Nevertheless, traders may keep the $3.50 level as a short-term target.

Get Uniswap (UNI) here. Buy UNI 

SUI/USDT Stabilizes Near $0.9250 as Momentum Indicators Signal Potential Exhaustion

SUI/USDT Price Analysis – February 10, 2026

Sui (SUI/USDT) has undergone significant price compression, settling around the $0.9250 level after an extended period of distribution. The asset is currently trading within a narrow consolidation band following a prolonged decline from higher levels.

SUI/USDT Daily Chart (Daily Key Levels):

Support Zones: $0.5809, $0.4500
Resistance Zones: $1.2841, $2.0220

SUI/USDT Stabilizes Near $0.9250 as Momentum Indicators Signal Potential Exhaustion

SUI/USDT Long-Term Trend – Bearish (Daily Chart)

SUI/USDT is currently priced at $0.9250, down 3.84% during the present session. The daily Stochastic oscillator has declined to 20.84, positioning the asset deep in oversold territory where selling pressure typically begins to diminish and reversals can materialize.

What is SUI/USDT Market Outlook?

The MACD configuration highlights the prevailing weakness. The MACD line sits at negative 0.0189 while the signal line rests at negative 0.1687, with the histogram reading negative 0.1498. This arrangement confirms that downward momentum has been persistent, though the narrowing gap between the lines suggests the rate of decline may be decelerating.

After peaking near $3.70 in earlier periods, Sui has embarked on a systematic markdown characterized by successive failures at resistance and persistent breakdowns through support levels. The price structure displays a clear pattern of lower highs and lower lows, with each rally attempt being met with renewed selling. Recent candle formations show diminishing range and volume, patterns that often emerge when trends approach exhaustion.

The critical question now revolves around whether support near $0.5800 can provide a base for stabilization. If this level fails to attract meaningful buying interest and price continues its descent, the next logical downside target appears around $0.4500.

SUI/USDT Stabilizes Near $0.9250 as Momentum Indicators Signal Potential Exhaustion

SUI/USDT Short-Term Trend – Bearish (4 Hour Chart)

Examining the 4 Hour timeframe, SUI/USDT remains confined within bearish territory with price hovering around $0.9250 key level. The intraday action continues to reflect subdued activity, with periodic bounces lacking conviction and quickly fading.

The Stochastic indicator on this compressed interval reads 12.72, reflecting deeply oversold conditions at shorter timeframes. This reading typically signals that immediate selling pressure may be nearing exhaustion, though it doesn’t guarantee an immediate reversal. The MACD remains negative with the histogram displaying bearish bars, confirming that downward momentum persists across intraday sessions.


SUI/USDT Market Statistics
Current Price: $0.9254
Market Capitalization: $2.7 Billion
24H Trading Volume: $195 Million

Place winning SUI trades with us. Get SUI here

Pepe (PEPE/USDT) Continues Bearish After Pullback to Previous Support

PEPE/USDT Price Analysis: PEPE/USDT Returns Back to Its Bearish Move After a String Rally

PEPE/USDT remains under strong bearish pressure after price swept liquidity below the support zone and failed to sustain a recovery. After the sweep, price reacted into a bearish order block and was rejected, pushing the market back into continuation of the downtrend structure.

PEPE/USDT Key Levels

Support Levels: $0.00000320, $0.00000295
Resistance Levels: $0.00000400, $0.00000640

Pepe (PEPE/USDT) Continues Bearish After Pullback to Previous Support

On the daily timeframe, the market consolidated twice at price levels $0.00000640 and $0.00000400. Price swept liquidity before breaking above consolidation at $0.00000400 with huge momentum. This shows bulls’ attempts to reverse the market.

On the daily timeframe, the downtrend from January to February shows a falling flag chart pattern at price level $0.00000500. The market fails to make a higher high, and the market breaking below the flag pattern signals this price move is not just a corrective move but a bearish move that leads to the breakout of support at price $0.00000400.

Pepe (PEPE/USDT) Continues Bearish After Pullback to Previous Support

Market Expectation

On the 4H timeframe, the Moving Average Convergence Divergence (MACD) from August to February shows the signal line and MACD line are both below the zero line, meaning this is a strong bearish move. The volume indicator shows increased activity during the support breakout, confirming participation from bears.

You can purchase Lucky Block here.  Buy LBLOCK

Note: Cryptosignals.org is not a financial advisor. Do your research before investing your funds in any financial asset or presented product or event. We are not responsible for your investing result.

Enjin Coin (ENJ/USDT) Key Support Level Becomes Resistant

ENJ/USDT Price Analysis: ENJ/USDT Sees Surge in Volume as Price Tests Support Zone

ENJ/USDT price is forming near the overbought region of the Stochastic Relative Strength Index (Stoch RSI) at the $0.0240 level. This gives room for a possible move to the downside.

ENJ/USDT Key Levels

Support Levels: $0.0240, $0.0220
Resistance Levels: $0.0280, $0.0295

Enjin Coin (ENJ/USDT) Key Support Level Becomes to Resistance

On the daily timeframe, a rising flag pattern inside the downtrend channel shows buyers attempted to break above resistance at the $0.0360 level. There was also a volume spike and a long-wick candlestick, signalling increased seller presence at that area. The market Breaks below then retested and continued in a downtrend.

On the daily timeframe, price remains in a downtrend structure within a descending channel. The volume indicator shows a spike as price reached the $0.02350 support level, meaning more bears entered the market at that area, signalling the breakout that followed.

Enjin Coin (ENJ/USDT) Key Support Level Becomes to Resistance

Market Expectation

Zooming in on the 4-hour timeframe, previous support has become resistant at the $0.0240 level. Price formed a double top pattern at that area, and the neckline was broken, signalling that bears remain in control of the market. No trend reversal is expected soon, as price is still likely to continue breaking bearish structure.

You can purchase Lucky Block here.  Buy LBLOCK

Note: Cryptosignals.org is not a financial advisor. Do your research before investing your funds in any financial asset or presented product or event. We are not responsible for your investing results.

Uniswap (UNI) Stages Bullish Recovery—Why You Need to Learn Uniswap

The Uniswap market (UNI) has just staged a significant bullish recovery, breaking out of its consolidation phase around the $3.50 price level. Despite this upward move, the market remains within a broader bearish zone. During today’s trading session, traders initially rushed in with strong buying pressure, helping to propel the recovery. Over the course of the session, the price surged to a peak of $4.50 before profit-taking activities triggered a correction. Due to heightened market volatility, the price was unable to sustain momentum above the crucial $4.00 level, putting the recent gains at risk of being eroded.

Uniswap (UNI/USD) Market Data

  • UNI/USD Price Now: $3.8
  • UNI/USD Market Capitalization: $2.45 billion
  • UNIUSD Circulating Supply: 634.25 million
  • UNI/USD Total Supply: 898.9 million
  • UNI/USD CoinMarketCap Ranking: #32

Why You Need to Learn Uniswap

If you want to understand the world of decentralized finance (DeFi), one of the first platforms you should learn about is Uniswap—the leading decentralized exchange. Uniswap allows investors and project founders to create and trade tokens without relying on a centralized exchange.

Instead of traditional market-making companies facilitating trades, buying and selling activities on Uniswap are powered by liquidity providers. These liquidity providers deposit funds into pools, enabling seamless token swaps for traders.

The relationship between liquidity providers and traders is mutually beneficial. Traders pay transaction fees, and those fees are distributed directly to the liquidity providers who supply the capital. In this way, the rewards go to active participants within the ecosystem rather than centralized intermediaries.

This structure allows Uniswap to operate as a truly decentralized exchange that can sustain itself over time. Today, many DeFi applications either integrate Uniswap directly or replicate aspects of its automated market maker (AMM) model to enable efficient token trading.

Key Levels to Monitor

  • Resistance: $4.0, $4.5, $5.0
  • Support: $3.25, $3.00, $2.25

Uniswap (UNI) Stages Bullish Recovery—Why You Need to Learn Uniswap

Uniswap (UNI) Analysis: Technical Viewpoint

Since mid-January, the Uniswap market (UNI) has been in a sustained downtrend. Initially, the price action moved sideways around the $5.50 level. This zone acted as a secondary support above the primary support at $5.00, which had held firm since November of last year. Typically, a breakdown below such a long-standing support level attracts strong bearish pressure, and this dynamic drove the market lower until it eventually found solid footing near the $3.00 level.

UniswapX Integrates BlackRock’s BUIDL Fund Through Securitize

Uniswap has announced a strategic integration in collaboration with Securitize to enable trading of BlackRock’s USD Institutional Digital Liquidity Fund (BUIDL) via UniswapX. This development marks a significant step in bridging traditional finance with decentralized finance (DeFi), as one of the world’s largest asset managers expands its presence within the on-chain ecosystem. By leveraging Securitize’s tokenization infrastructure and UniswapX’s trading capabilities, institutional-grade digital assets like BUIDL can now access deeper liquidity and more efficient execution within the DeFi landscape.

Technical Viewpoint (Continued)

The subsequent rebound was pivotal, pushing the market upward. However, because the price failed to sustain momentum above the $4.00 resistance level, there are growing concerns that the recent gains above $3.50 could soon be erased if bearish pressure resurfaces.

Uniswap (UNI) Stages Bullish Recovery—Why You Need to Learn Uniswap

UNI/USD 4-Hour Chart Outlook

In the previous 4-hour trading session, there was a noticeable surge in trading volume, highlighting the strength of demand during today’s market activity. Although the Uniswap market was unable to sustain its bullish momentum above the $4.00 level—an outcome that may dampen sentiment—the price is now retracing toward that same level.

However, the $4.00 zone is likely to act as resistance, particularly given that the Uniswap market remains within a broader bearish trend.

Trade crypto coins on BYBIT