Pump.fun price has dropped 5.19% to $0.00186 over the last 24 hours. The market has been underperforming in a broadly declining market. As it stands, this bearish price action is primarily driven by a sector-wide rotation as investors shift capital away from high-beta, riskier altcoins during periods of intensified market stress.
Meanwhile, this downturn is further increased by a Bitcoin-led decline and extreme fear sentiment, amplifying local selling pressure. To this end, the token eyes support near $0.0018; a failure to stabilize at this level could trigger a deeper correction toward the $0.0015 level.
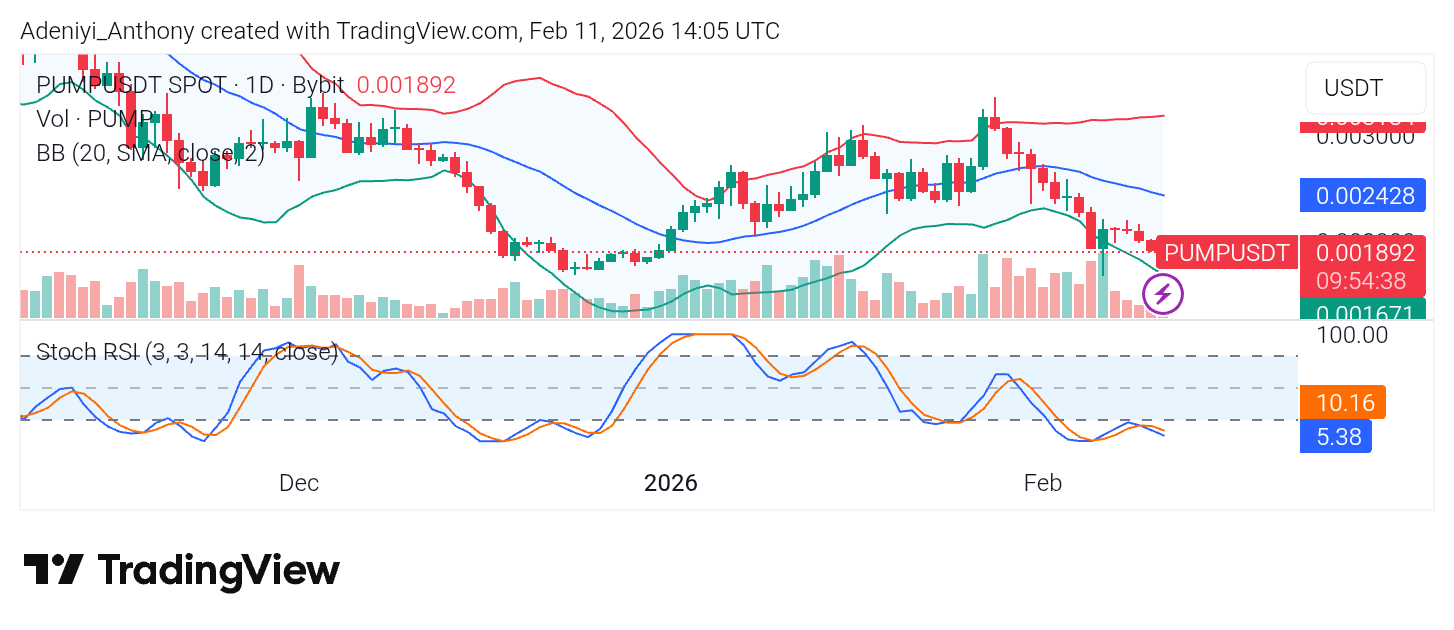
Major Resistance Levels: $0.002130, $0.002428, and $0.003100
Major Support Levels: $0.001850, $0.001670, and $0.001230
Technical Analysis
Currently, the overall structure of the Pump.fun against Tether shows a bearish reversal following a peak in late January. At the moment, the price is in a clear short-term downtrend, characterized by lower highs and lower lows over the recent days. Right now, the price is riding the lower Bollinger Band, which typically indicates strong downward momentum.
Additionally, the SRSI beneath the chart appears to be confirming the oversold condition as the lines now operate deep around the 10-mark level. However, this may suggest a relief bounce in the near term, but the price needs to stabilize for such to happen, as the bands expand to signal an extended downtrend.
To this end, without a clear signal from the SRSI and a move above the middle Bollinger limit around $0.002428.
PUMP/USDT Analysis: What’s Next?
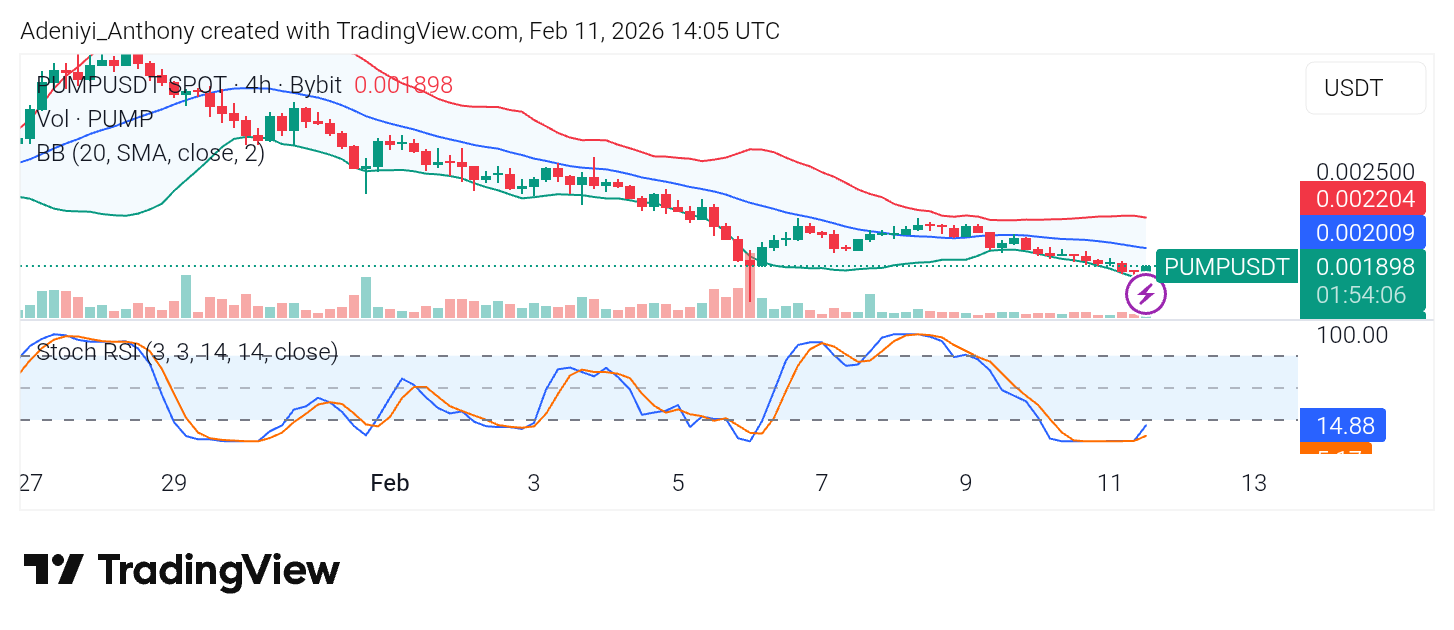
The PUMP/USDT on the 4-hour chart shows a persistent bearish trend, with price action consistently making lower highs and lower lows, which is not different from the daily chart. As it stands, the bands are narrowing, indicating a decrease in volatility, while the price hugs the lower band, signaling of strong downward pressure.
However, at the bottom, the Stochastic RSI is currently in the oversold zone. A bullish crossover is beginning to form, suggesting a potential short-term relief bounce or consolidation. However, without a significant spike in volume or a break above the blue midline ($0.002009), the overall bias remains firmly bearish.
The Polkadot market appears to be mirroring the broader market movement, a retreat led by Bitcoin as the coin drops 3.81% over the 24 hours. Primarily, this decline is driven by extreme fear sentiment and a lack of enthusiasm to decouple DOT/USDT from the prevailing risk-off condition.
Technically, DOT is in the oversold zone, battling its way around a critical low level, as the hope of an impending upside move lingers.
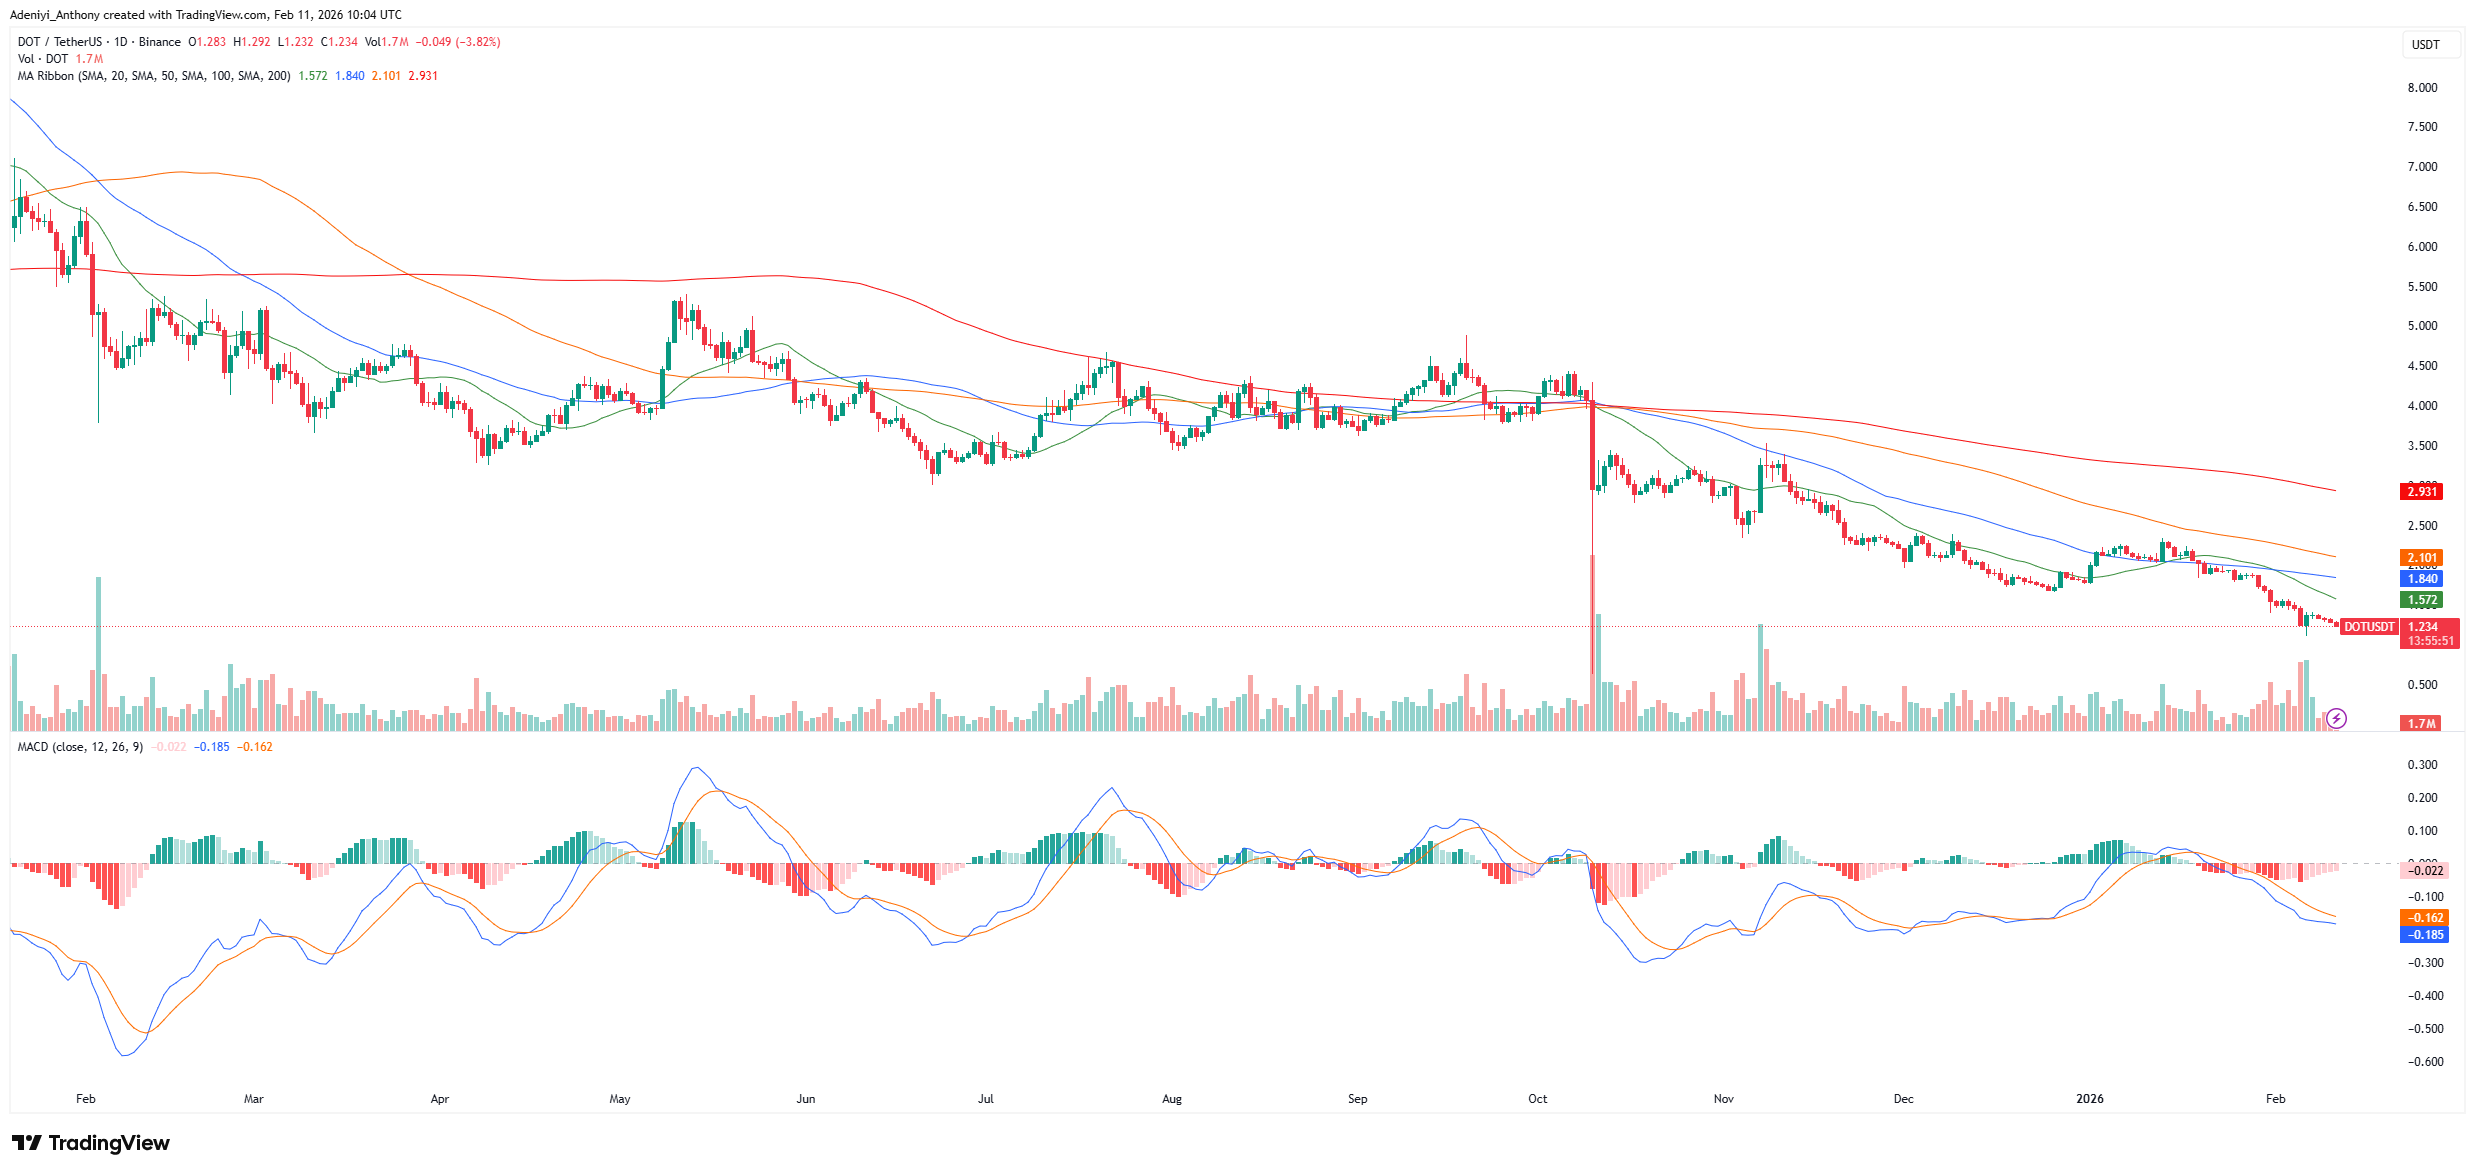
Major Resistance Levels: $1.380, $1.470, and $1.750
Major Support Levels: $1.200, $1.150, and $1.110
Technical Analysis
On the daily chart, Polkadot against Tether is displaying a sustained bearish trend with the price hovering near a critical support level around $1.23. However, it appears the token has been showing little signs of a reversal as it remains operational below the 20, 50, 100, and 200-day lines.
Beneath the chart, the MACD (Moving Average Convergence Divergence) is currently in the negative territory, with the signal line trending downward. This suggests that bearish momentum is still firmly in control, as the spike in volume at the current moment indicates aggressive selling compared to buying interest. To this end, without a significant surge in volume and a break above the immediate resistance at $1.50, the pathway remains downwards.
Polkadot Price Prediction: Is DOT Reaching for Another Low?
Polkadot has entered a full capitulation phase, breaking below previous support floors. This downswing has invalidated prior technical levels, leaving the token without a clear bottom as dominance from the bears continues.
As it stands, Polkadot’s price reversal depends on a reversal and holding above the $1.56 resistance zone. To this end, after establishing well above this point, a move towards $2.78 will be next, but for now, Polkadot heads towards $1.00.
DOT/USDT Analysis: Is a Reversal Possible?
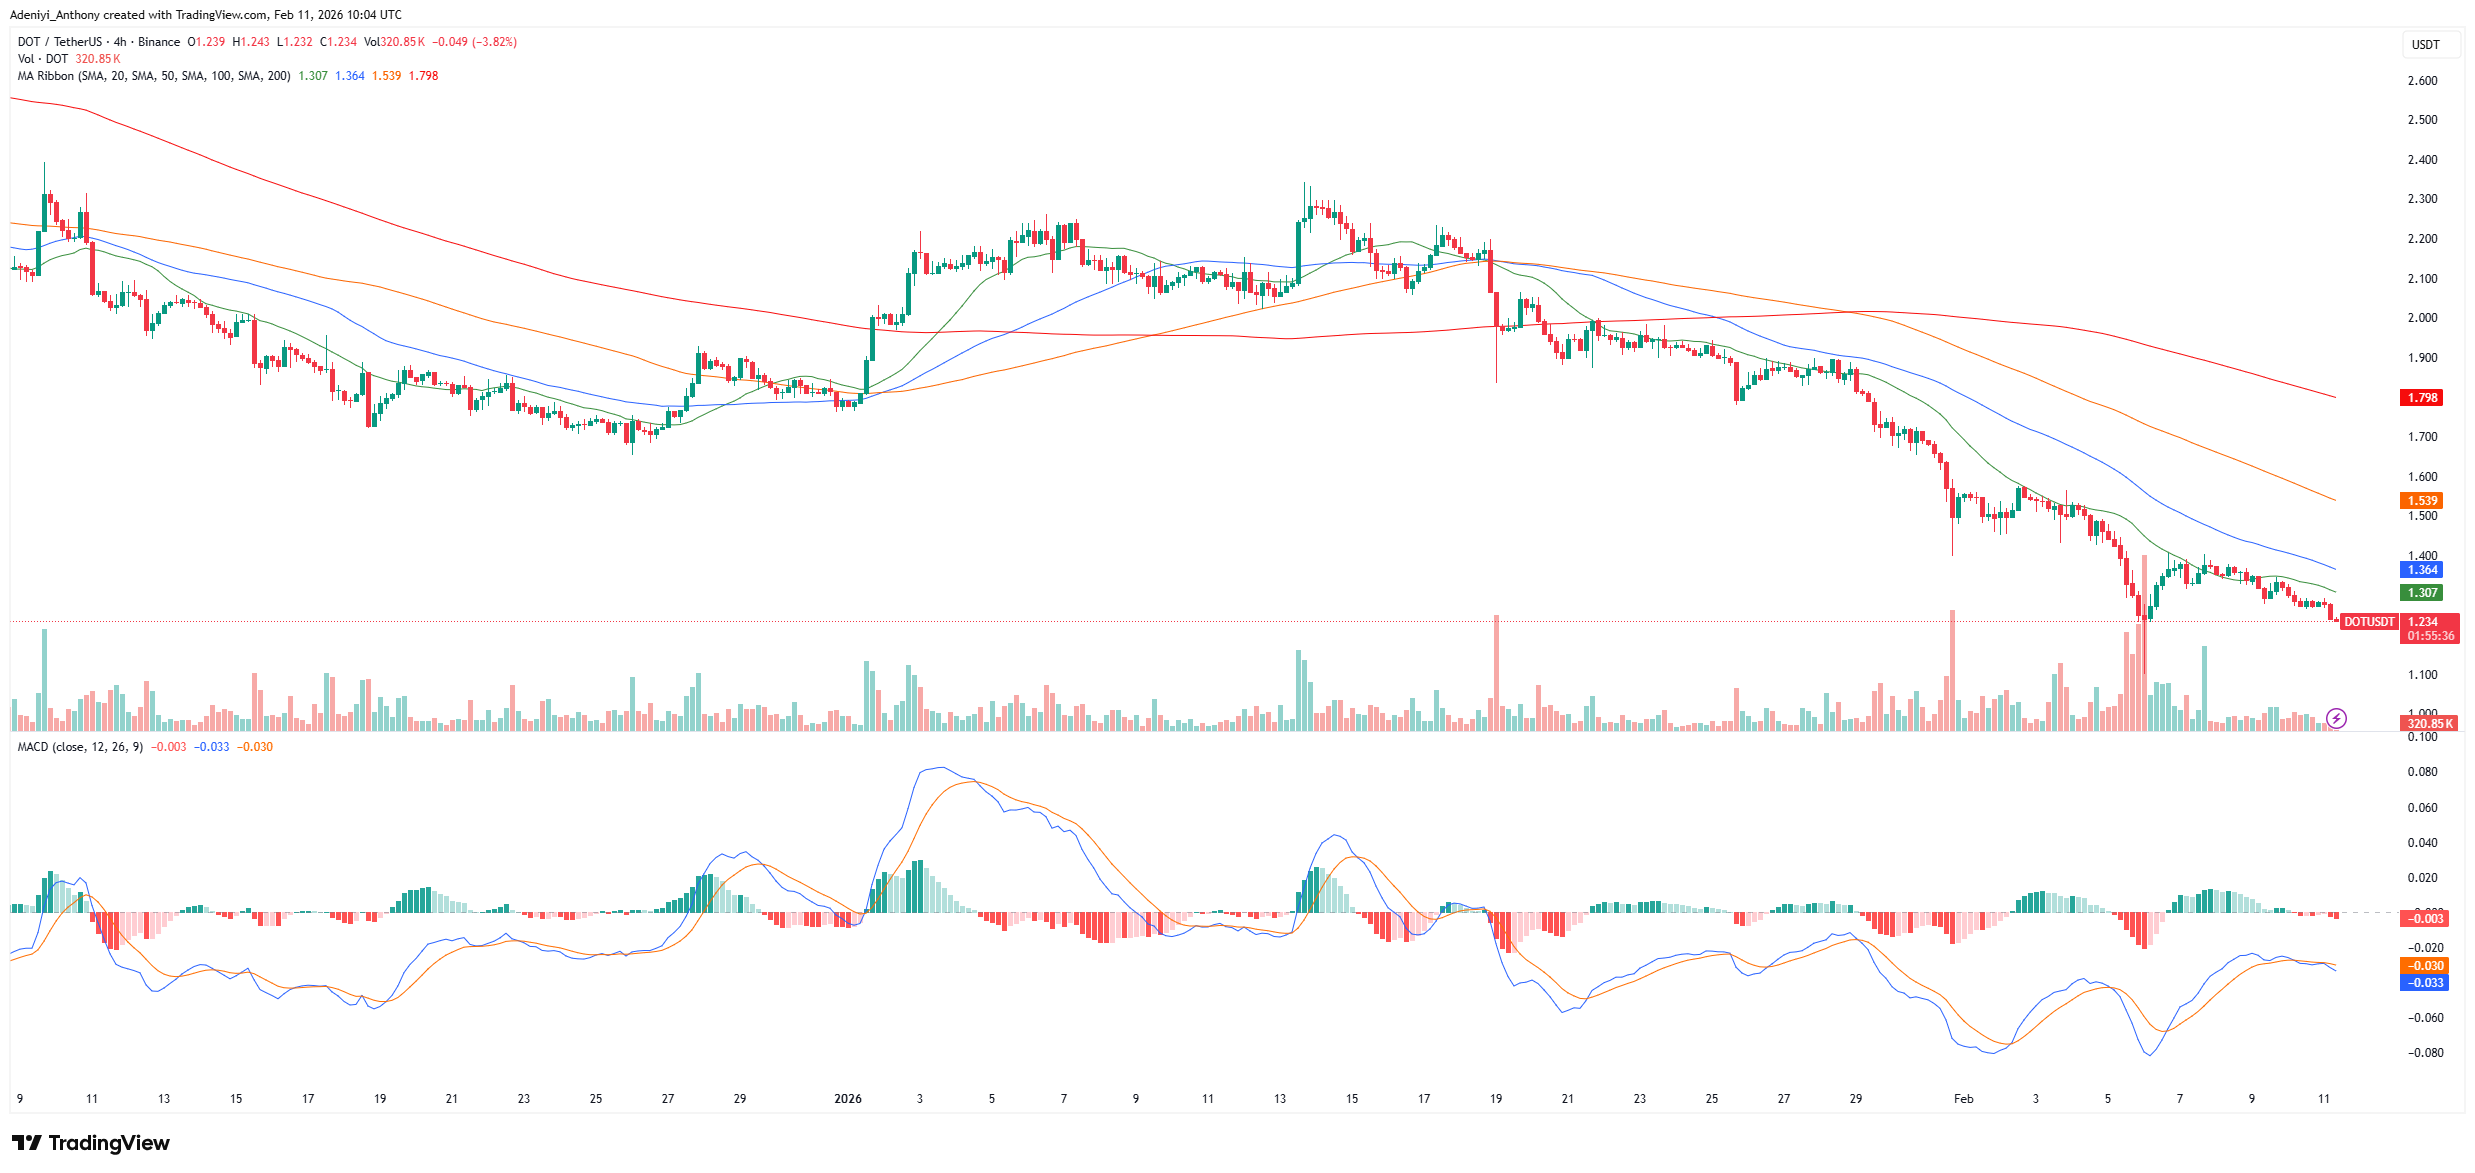
The 4-hour chart for DOT/USDT appears to be characterized by a series of lower highs and lower lows, with the price currently trading well below its major SMAs. Meanwhile, recent price action indicates a failed attempt to recover near the $1.40 level, followed by a consolidation phase that suggests the bears are still firmly in control.
As it stands, the MACD further supports this negative outlook with the lines hovering around point zero. Though the momentum is showing very little bullish divergence, and the histogram shows weakened momentum, the buying interest appears insufficient to drive a meaningful bullish trend. To this end, DOT would need to reclaim the immediate resistance levels and see the MACD signal line cross decisively above the zero threshold; Otherwise, the path of least resistance remains toward the downside.
Price action in the Bitcoin market has been facing strong headwinds for several weeks. At this point, bearish forces are expected to remain dominant and continue pressuring prices lower.
BTC/USDT Long-Term Trend — Bearish (Daily Chart)
Key Price Levels
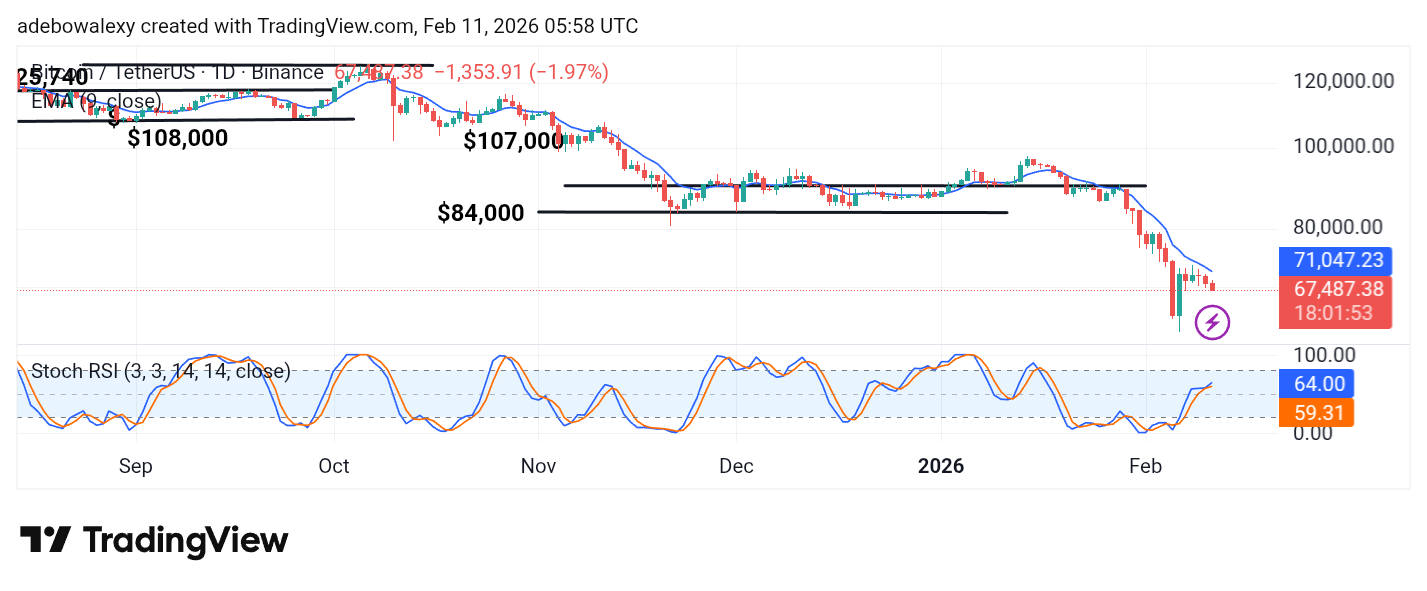
Resistance: $69,000, $72,000, $74,500
Support: $66,000, $65,000, $63,000
The Bitcoin market has recorded another downward dip in the ongoing session. The current session is represented by a red price candle trading below the 9-day Exponential Moving Average (EMA). Meanwhile, the Stochastic Relative Strength Index (SRSI) lines can be seen rising upward after aborting a previous downward crossover above the 50 threshold level.
Bitcoin Price Prediction: BTC/USDT Shows Mixed Indications on the Daily Chart
Although the Bitcoin market maintains a clear downward trajectory on the price chart, there are some signals that contradict this outlook. For nearly two weeks, price action in the BTC/USDT market has remained below the 9-day EMA curve. The ongoing session has dipped further while still trading beneath this indicator.
However, the SRSI lines are pointing upward even as price action continues along a bearish path. This creates some confusion in the technical outlook. Nevertheless, the market’s EMA positioning remains predisposed toward further declines.
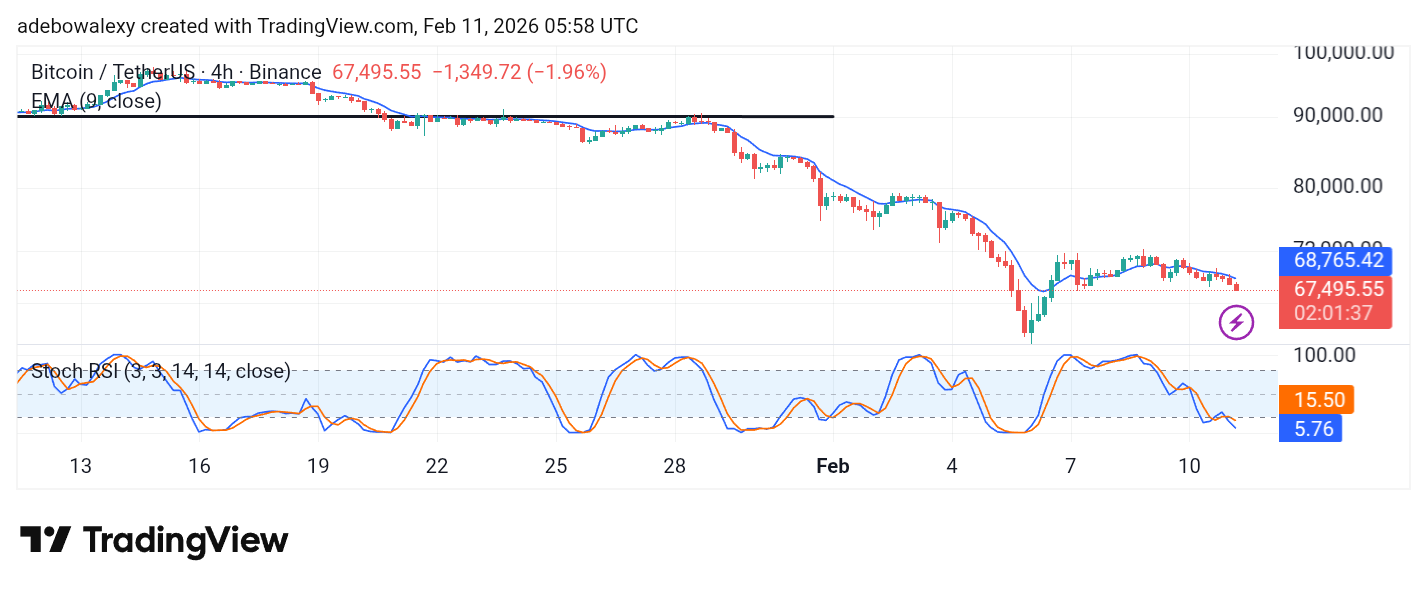
The Bitcoin 4-hour chart mirrors the trajectory seen on the daily timeframe. This consistency suggests that bearish momentum may still strengthen in the near term. The current session remains bearish and continues to trade below the 9-day EMA curve.
Unlike the daily chart, the SRSI lines on the 4-hour timeframe are descending toward the lower threshold in the oversold region. As a result, the bearish outlook appears firm, with price action potentially testing the $67,000 and $66,000 levels soon. This will happen only if the trend stays protected.
Tron (TRX/USD) has broken through critical support at $0.27020, establishing a fresh bearish range that reinforces the downtrend across multiple timeframes. Price is currently hovering around $0.2769 after sellers decisively violated the prior low, signaling continued distribution.
TRX/USD Daily Chart (Daily Key Levels):
Support Zones: $0.2690, $0.2600 Resistance Zones: $0.2790, $0.3080
TRX/USD Long-Term Trend – Bearish (Daily Chart)
TRX/USD is trading at $0.27694, down 0.14% during the present session. The daily Stochastic oscillator has declined to 36.61. This indicates subdued momentum and positioning the asset in territory where selling pressure often persists before exhaustion sets in.
$TRXUSD Outlook
Price has continued to move bearish as it broke the low at 0.27020 giving us another bearish range , so we will be looking at the exetreme zone and decisional zone for bearish reaction and see what happens pic.twitter.com/5L6mCOQ1lM
The MACD configuration highlights the prevailing bearish sentiment. The MACD line sits at 0.00069 while the signal line rests at negative 0.00020, with the histogram reading negative 0.00089. This crossover pattern confirms that negative momentum continues to dominate, and bulls have been unable to mount a sustainable defense.
Following the breakdown below $0.27020, Tron has entered a new phase of price discovery on the downside. The violation of this support level represents a structural shift, as previous attempts to hold this zone were met with temporary stabilization. Now that this floor has given way, the path of least resistance points lower, with candle formations displaying consistent closes near session lows and minimal buying absorption.
The critical question revolves around whether the $0.2690 support can provide meaningful resistance to the decline. If this level fails to attract buyers and price continues to deteriorate, the next logical target emerges around $0.2600 or potentially lower. On the other hand, a reversal above $0.2795 with expanding volume and follow-through would begin to repair the damaged structure and could spark short-covering toward $0.3085.
TRX/USD Short-Term Trend – Bearish (4 Hour Chart)
Examining the 4 Hour chart, TRX/USD remains locked in bearish mode with price consolidating around $0.27690. The intraday structure continues to reflect weakness, with periodic bounces being quickly absorbed by fresh waves of selling.
The Stochastic indicator on this compressed timeframe reads 80.51, showing a temporary overbought condition within the broader downtrend. This reading often precedes renewed selling pressure as short-term rallies exhaust themselves. The MACD remains negative with the histogram printing red bars, confirming that bearish momentum persists at shorter intervals.
TRX/USD Market Statistics Current Price: $0.2769 Market Capitalization: $24.0 Billion 24H Trading Volume: $520 Million
CoinMarketCap 20 Index Price Analysis – February 09, 2026
CoinMarketCap 20 Index has experienced significant selling pressure, driving the benchmark down to $144.50 after failing to maintain ground above $154.00 level. The index, which provides diversified exposure to the top 20 cryptocurrencies in a single token, is currently navigating a compressed consolidation zone following a dramatic selloff. Technical indicators reveal weakening momentum across both daily and intraday timeframes.
CMC20 Index Daily Chart (Daily Key Levels):
Support Zones: $120.33, $97.40 Resistance Zones: $154.43, $176.97
CMC20 Index Long-Term Trend – Bearish (Daily Chart)
The CMC20 Index is presently valued at $144.50, down 0.21% during the current trading period. The daily Stochastic oscillator registers 35.52, positioning the index in territory where momentum typically begins to stabilize after extended declines.
.@reserveprotocol‘s CMC20 Index provides diversified exposure to the top 20 cryptocurrencies in a single token
The MACD indicator reveals the depth of the bearish pressure. The MACD line sits at 2.48 while the signal line rests at negative 12.76, with the histogram printing a deeply negative reading of -10.28. This configuration confirms that downward momentum has been severe, with bulls unable to mount meaningful resistance during the recent decline.
Following a peak near $227, the index has carved out a methodical series of lower swing highs and lower swing lows. The selloff accelerated dramatically in early February, with price collapsing from the $176.000 area through multiple support levels. Candle structures display extended bearish bodies with minimal lower wicks, patterns characteristic of aggressive liquidation and weak buying interest.
The immediate focus centers on whether support near $120.33 can provide a floor for the decline. If this level fails to attract meaningful accumulation and the index continues to deteriorate, the next logical downside target emerges around $97.40. Conversely, a recovery above $154.40 with expanding volume and sustained follow-through would begin to challenge the bearish thesis and could unlock movement toward $176.97 or higher resistance levels.
CMC20 Index Short-Term Trend – Bearish (4 Hour Chart)
Transitioning to the 4 Hour perspective, the CMC20 Index remains entrenched in bearish territory with price consolidating around $144.50. The intraday structure continues to reflect weakness, with periodic bounces being quickly absorbed by renewed selling waves.
The Stochastic indicator on this compressed timeframe reads 73.43, showing a temporary overbought condition within the broader downtrend. This reading often precedes renewed selling pressure as short-term rallies exhaust themselves without establishing sustainable support. The MACD remains in negative territory with the histogram displaying red bars, confirming that bearish momentum persists at shorter intervals.
CMC20 Index Market Statistics Current Price: $144.55 Market Capitalization: $480 Billion 24H Trading Volume: $32 Billion
PI/USDT Price Analysis: PI/USDT Extends Downtrend After Two Ascending Triangles Were Formed.
PI/USDT remains under strong bearish move after breaking below two ascending triangle chart patterns at price levels $0.2750 and $0.2140. Price moves aggressively after each breakout.
PI/USDT Key Levels
Support Levels: $0.1520, $0.1400 Resistance Levels: $0.1800, $0.2140
On the daily timeframe, price reaching the resistance zone at price level $0.2140 twice can also be seen as a Double Top pattern. The neckline of the pattern was broken, signalling the bearish move that follows. A large volume spike was at the breakout zone, signalling more sellers come in at that point.
On the daily timeframe, Moving Average Cross (Cross MA) right at the breakout shows 9 MA crossing the 21 MA. This is also a bearish signal. The candlestick forms are below both 9 and 20 MA, meaning the trend is not shifting anytime soon.
Market Expectation
Zooming in on the 4-hour timeframe, price pulled back to a support zone at price level $0.1530, which is both an old high and at the discount zone of the Fibonacci retracement (0.618 level), and the market reversed from the area. Price is still around the lower band of the Stochastic Relative Strength Index, signalling that a pullback may happen soon.
Note:Cryptosignals.org is not a financial advisor. Do your research before investing your funds in any financial asset or presented product or event. We are not responsible for your investing results.
Warden Protocol (WARD) has emerged as one of the fastest-moving new tokens in the crypto space, driven by its positioning at the intersection of blockchain infrastructure and artificial intelligence. Launched in early 2026, Warden is a modular Layer-1 blockchain built to support a global economy of autonomous AI agents—software that can execute tasks across multiple blockchains on behalf of users—with tools for cross-chain interoperability, data access, and automated execution.
The recent surge in WARD’s price and trading volume has been fueled by major exchange listings, including Binance Alpha and BingX, alongside airdrop events and strong community interest in AI-driven Web3 utility. These developments have placed Warden into the spotlight, as traders and investors react to both the project’s narrative—simplifying complex blockchain interactions via AI agents—and the potential growth of an “agent-centric” layer of decentralized finance and automation.
Warden (WARD/USD) Market Data
WARD/USD Price Now: $0.124
WARD/USD Market Capitalization:$31.25 million
WARD/USD Circulating Supply: 250 Million WARD
WARD/USD Total Supply: 1 billion WARD
WARD/USD CoinMarketCap Ranking: #525
Warden Crypto Review—Should Hit $0.50 (Currently $0.12)
Warden has surged to the top of CoinMarketCap’s trending list, driven largely by its recent launch and unusually strong trading volume for a small-cap asset. While this early attention is notable, a deeper look reveals a more balanced mix of opportunity and risk. The token launched around $0.13 and saw only a brief push toward $0.16 before consolidating. Still, early listings on platforms such as Binance Alpha and MEXC leave room for additional spot and perpetual listings on major exchanges, which could act as future price catalysts.
Positioned within the rapidly expanding AI agent sector, Warden aims to support the emerging “agent economy.” The protocol provides tools and standards that allow AI agents and autonomous applications to operate across multiple blockchains, simplifying access to liquidity data and cross-chain functionality. Its user-facing app acts as a multi-chain crypto co-pilot, enabling AI-driven token swaps, bridging, research aggregation, and portfolio management while abstracting technical complexities like gas fees and wallet switching.
Central to Warden’s architecture is SPEX, a statistical verification layer designed to assess the freshness, reliability, and uniqueness of agent outputs. By sampling multiple data sources rather than relying on a single provider, SPEX seeks to improve confidence in the accuracy and relevance of AI-generated responses—an increasingly important feature in a crowded AI-focused crypto market.
That said, on-chain metrics raise concerns. Despite claims of broad ecosystem adoption, the number of token holders remains extremely low, with supply heavily concentrated among top wallets. While transaction counts are high, much of this activity appears protocol-driven rather than reflective of widespread user participation. In addition, only a portion of the total token supply is currently in circulation, with limited public clarity on future distribution.
Overall, Warden captures the momentum of the AI agent narrative, supported by strong volume and the potential for further exchange listings. This could allow the token to retest highs and possibly extend toward the $0.40–$0.50 range under favorable conditions. However, supply concentration, low holder count, and significant overlap with similar AI projects suggest that cautious optimism is warranted rather than outright enthusiasm.
Key Levels to Monitor
Resistance: $0.14, $0.15, $0.16
Support: $0.12, $0.11, $0.10
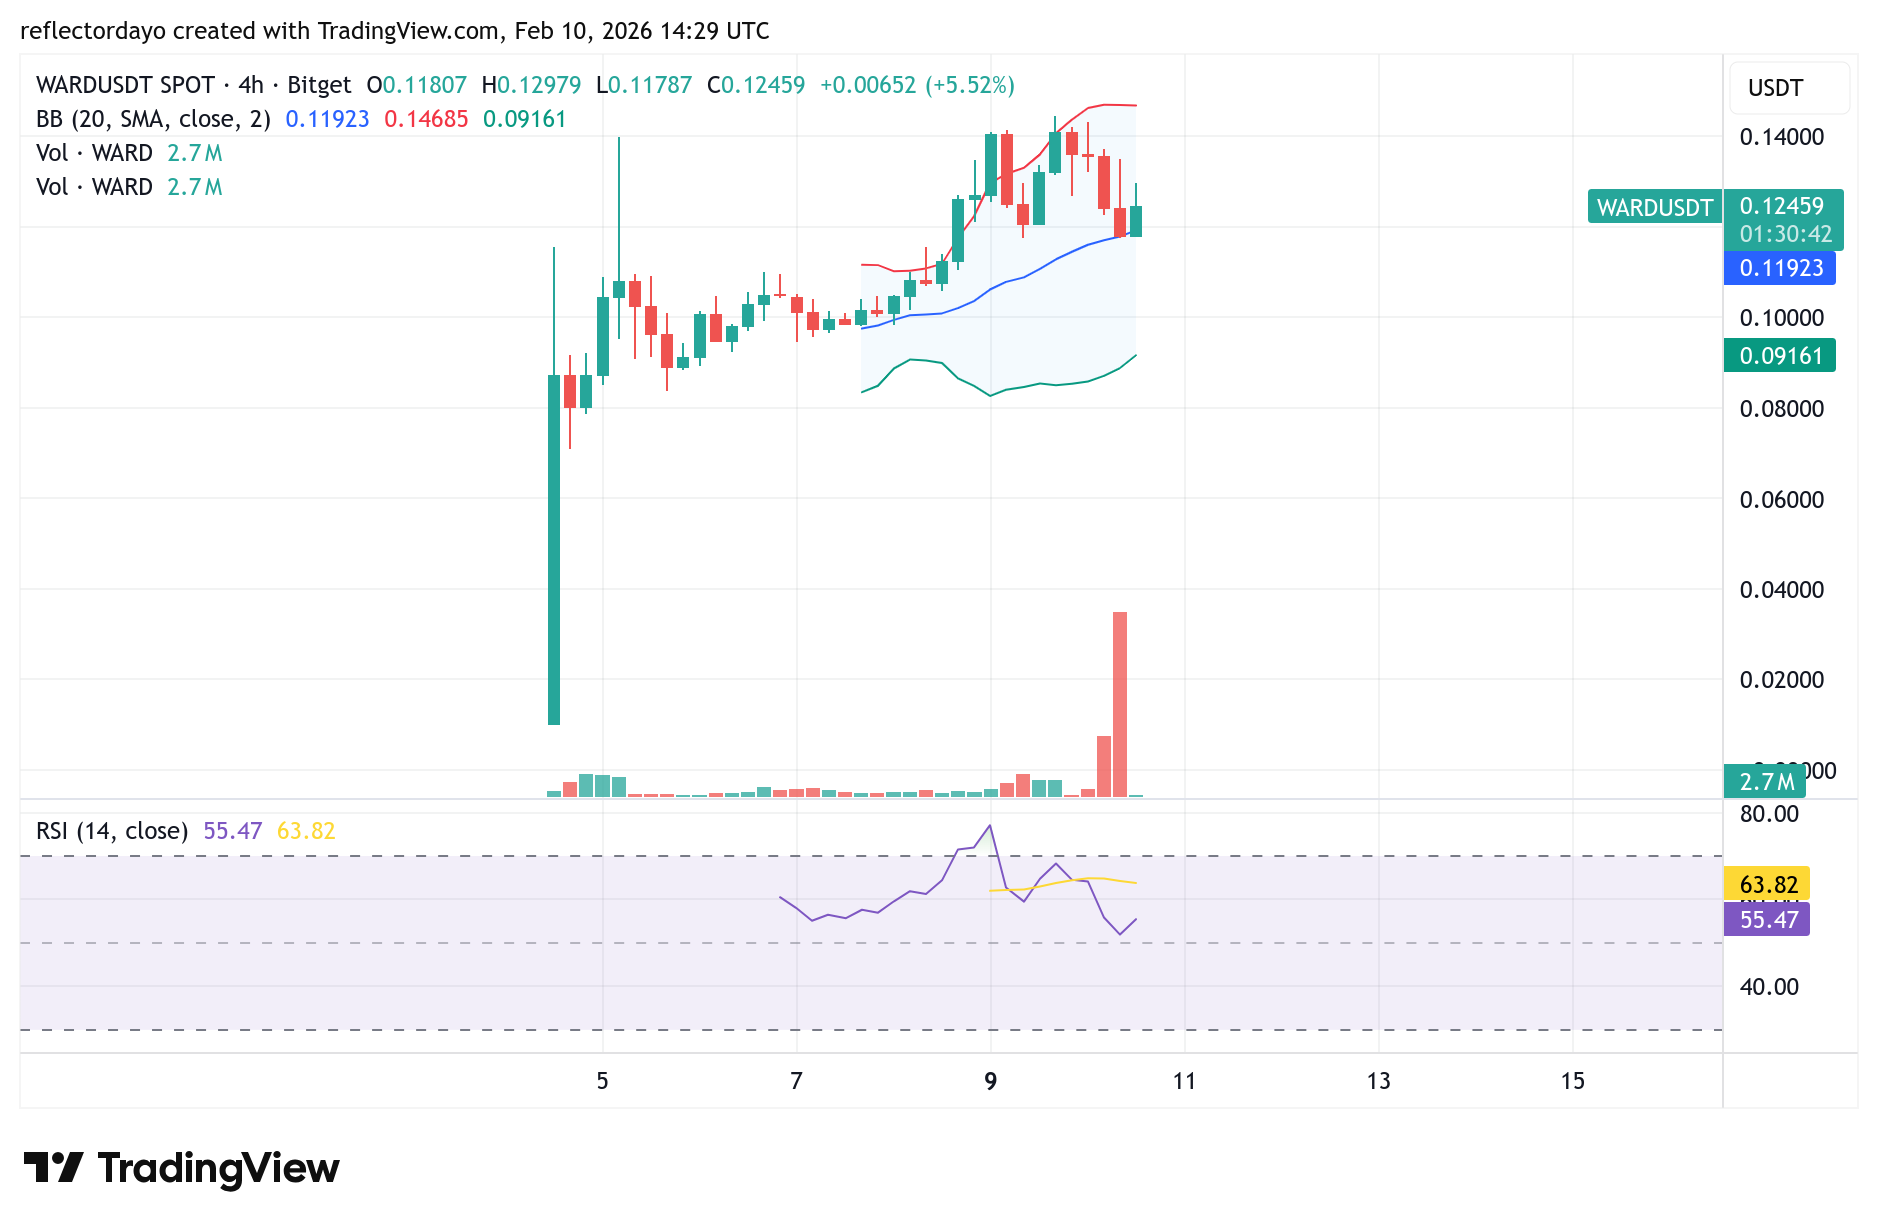
Warden Analysis: Technical Viewpoint
Based on the limited availability of historical trading data, it appears that this market may have been recently launched, with price history traceable only as far back as February 4. The asset began trading around the $0.010 level and, fueled by early speculative interest, surged sharply to close above the $0.08 price threshold. Over time, trading volume gradually increased, suggesting that the market has started to attract broader investor attention.
Warden Introduces Agentic Yield Strategies
At a time when active trading is becoming increasingly demanding, Warden is shifting the focus toward accessibility and efficiency through its newly introduced Strategies feature. The core idea is simple: while trading may not suit everyone, earning yield should remain open to all. With a one-click execution model, Warden allows users to deploy capital into predefined strategies without the need for constant market monitoring or manual trade management. Supporting stablecoins across nearly any blockchain, the platform removes technical friction and complexity, emphasizing execution over speculation. This approach reflects a broader evolution in the crypto market—where the future of trading is less manual and increasingly agentic, driven by automated systems designed to work continuously on behalf of users.
Trading isn’t for everyone, but earning yield should be.
We’ve introduced Strategies on Warden: a one-click way to put your capital to work without active trading.
– Any stablecoin.
– Almost any chain.
– No complexity. Just execution.
In the current trading session, volume has expanded notably, reinforcing this growing interest. Prior to this, the market underwent a corrective phase from its peak near the $0.14 level but successfully found support around $0.12. Price action now suggests a renewed upward move, with the market attempting to reclaim the $0.14 resistance level.
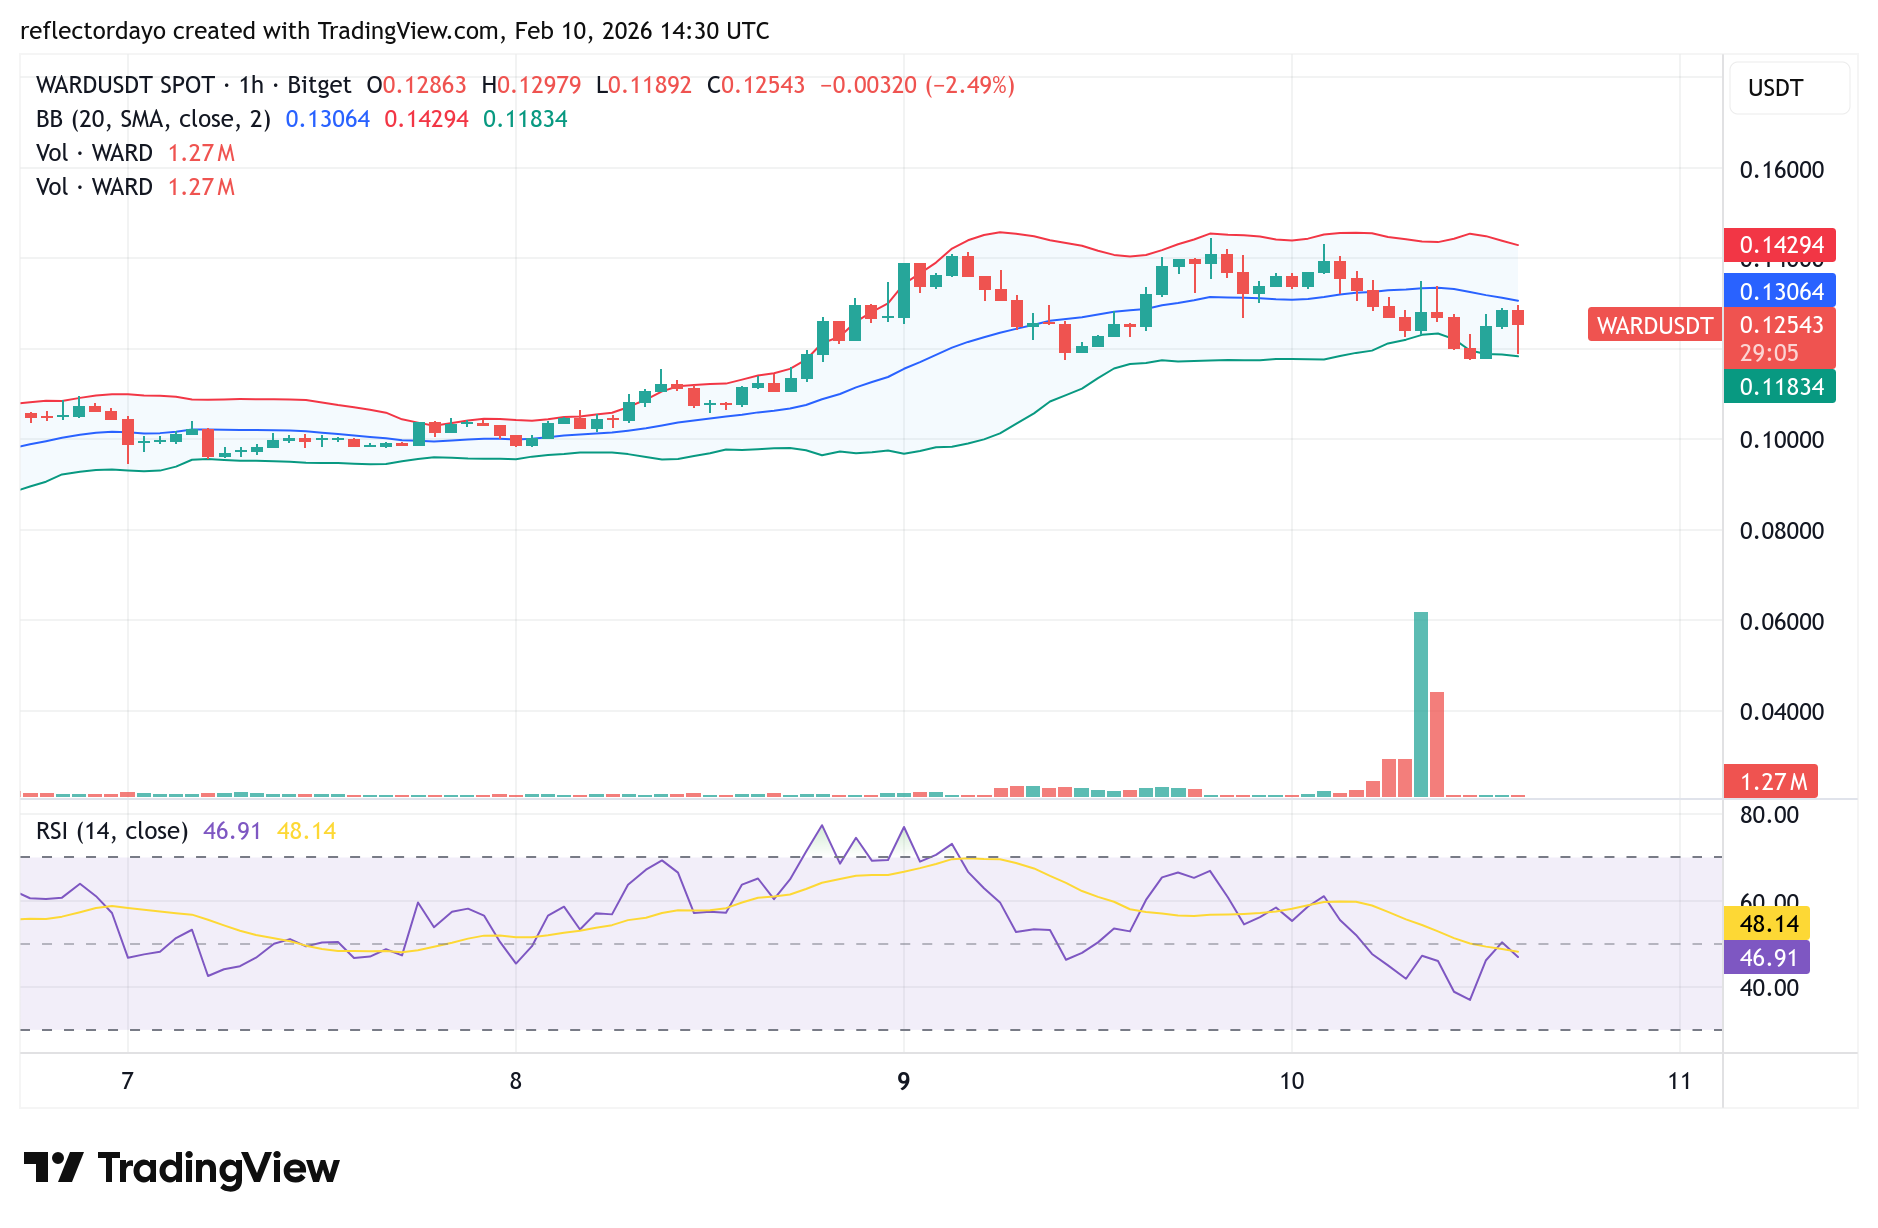
WARD/USD 1-Hour Chart Outlook
While trading volume surged—signaling increased crypto market activity—price action failed to establish a clear directional bias. This led to a consolidation phase, with price moving sideways above the $0.12 support level. Within this horizontal trading range, bearish pressure has dominated, as the price remains below the 20-day moving average. However, bulls continue to defend the $0.12 price threshold in an effort to prevent a downside breakdown from this consolidation zone.
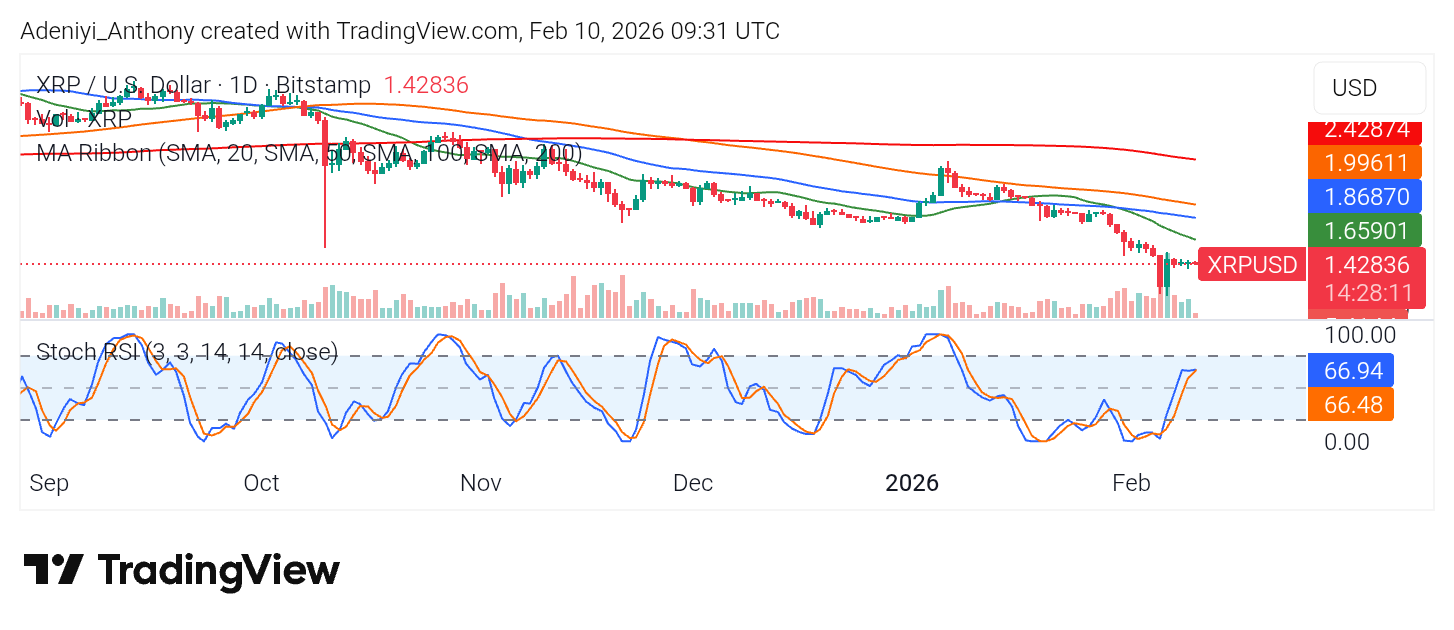
XRP price over the last 24 hours has gone down by 0.66% to $1.44. Though recording a loss, XRP against Tether is still outperforming Bitcoin in a market-wide downturn driven by extreme fear sentiment.
In the near term, XRP will technically face a pivotal moment at the 50-SMA near $1.470. Holding above this level could trigger a retest of $1.50, while a breakdown risks falling to $1.34. To this end, the price action around this level will determine which direction the token is heading.
Currently, XRP trades at $1.428 with more than 85 million traded volumes on the daily timeframe.
XRP USDT -Daily Chart
Technical Indicators
Major Resistance Levels: $1.470, $1.660, and $1.860
Major Support Levels: $1.400, $1.350, and $1.200
Technical Analysis
On the daily chart, XRP against Tether appears technically bearish, consistently recording a series of lows. As it stands, the XRP price operates below the Simple Moving Averages (SMA) as the significant gap within the SMA suggests strong downward pressure.
Meanwhile, beneath the chart, the Stochastic RSI signals that the price is near an overbought condition with the lines operating in the 60 and 70 range. This suggests that though there is a slight upside push, the momentum may meet with strong resistance soon. As it stands, if the bulls fail to push the price above $1.470 in the current session, another dip may be recorded.
XRP Price Update: Key Levels Before Breakout
XRP is currently in a low-confidence sideways consolidation after the recent swing high. The market has a three-wave decline to the 38.2% retracement level, which offers some hope. However, its lack of a clear five-wave impulsive move upward makes a bullish breakout unconfirmed. As it stands, the market holds technically above $1.19 to keep the primary wave four bottom theory alive.
In terms of direction, XRP needs a break above $1.64, which is required for meaningful bullish confirmation. Without this, the structure remains vulnerable to the sellers with potential downside targets at $0.98. For now, the trend shift is premature and lacks reliable structural backing.
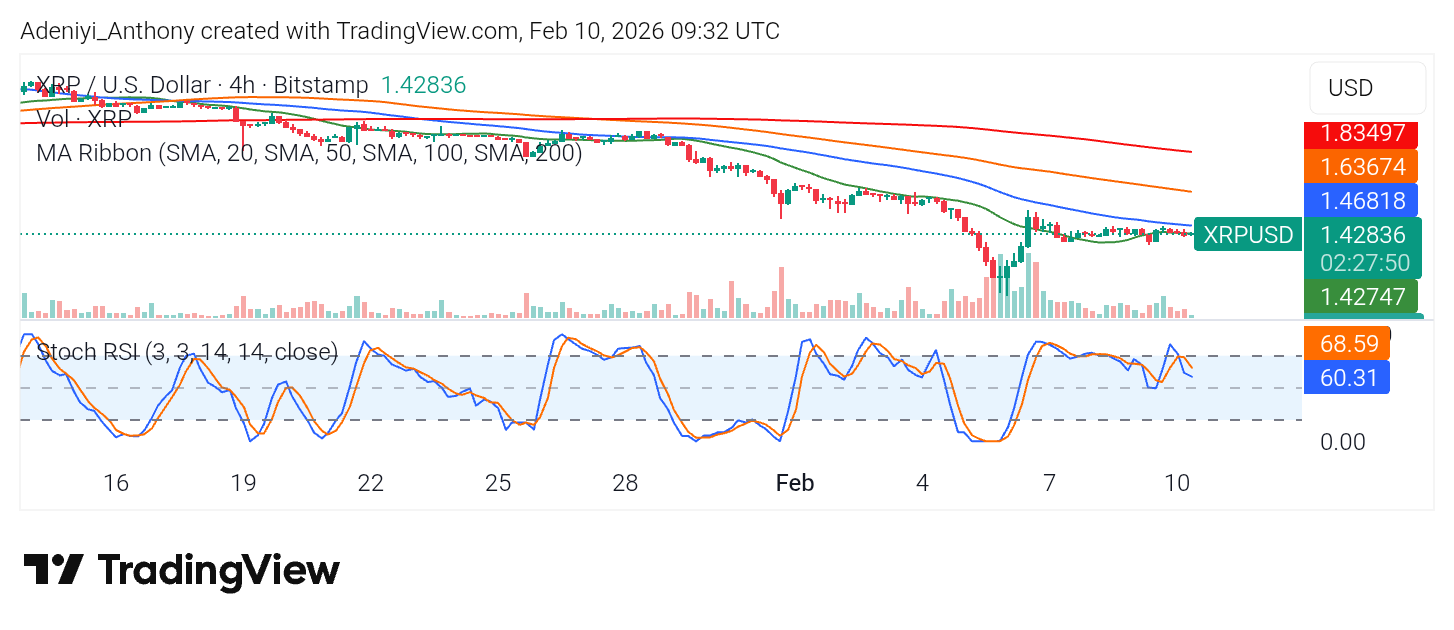
XRP/USDT Analysis: Consolidating—What’s Next?
On the smaller timeframe, XRP/USDT seems to be consolidating around $1.420 as the price appears to be struggling to break above the 20-mark level. Additionally, the momentum oscillator signals that the price is heading towards the 80-mark level. This suggests a short-term pullback may be triggered as the next resistance seems too close.
To this end, if momentum fails to increase above the current level, a lack of high buying pressure may result in further movement towards $1.200.
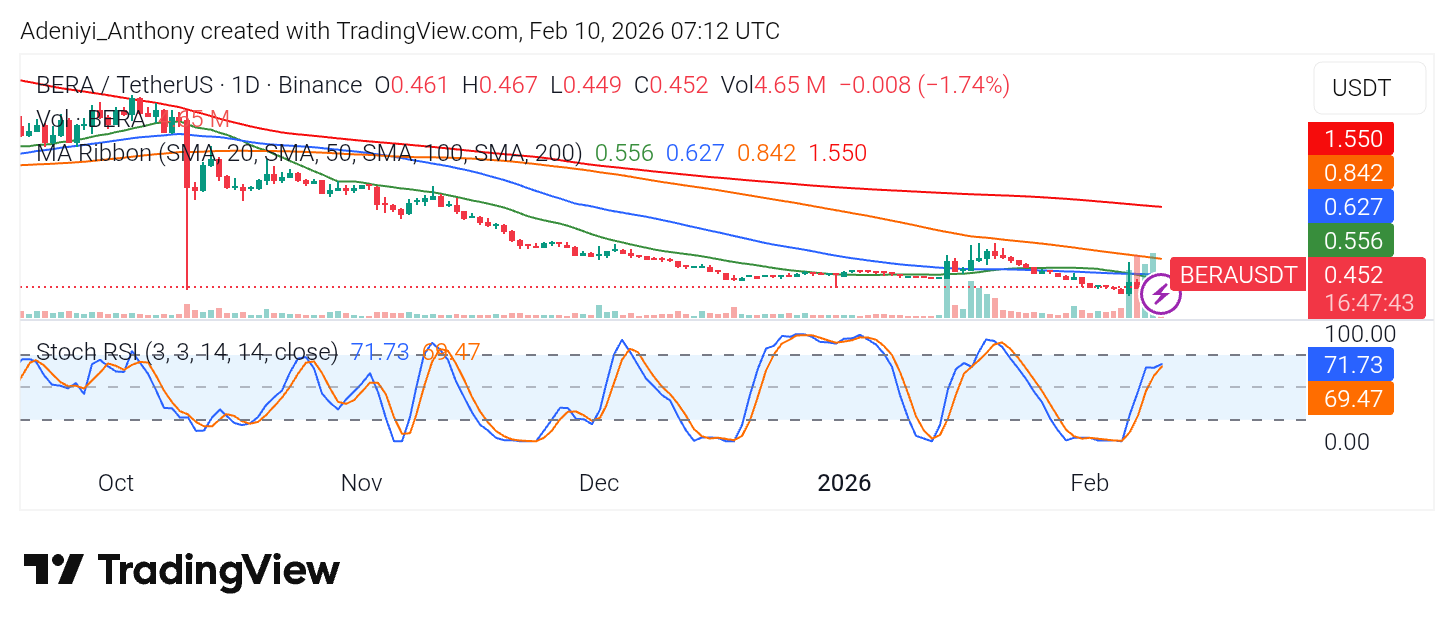
The market for Berachain (BERA) over the last 24 hours has fallen by 4.05%, recording a value of less than $0.456. Notably, this token has underperformed the broader crypto market’s 1.48% decline, as the current drop appears to be driven primarily by the widespread risk-off in the crypto market, as seen with the extreme fear indicator.
As it stands, the stabilization of the Berachain price depends on action above the $0.45 level with strong bullish participation. Should it fail, the price may retest recent lows around $0.40 due to general fear sentiment in the market.
Major Resistance Levels: $0.556, $0.627, and $0.842
Major Support Levels: $0.445, $0.400, and $0.349
Technical Analysis
Technically, in the daily timeframe, the Berachain price is trading well below the cluster of major Simple Moving Averages (SMAs). The price is currently operating under the 20-day SMA at $0.556 with fanned-out ribbons. This typically suggests a strong, sustained sell-off, but if BERA can reclaim and hold above that green line, the downward pressure can be neutralized.
However, beneath the chart, the Stochastic RSI is currently high (at 71.73), pointing to the north. This suggests the pair has limited space to the upside before a pullback or another move, if possible. To this end, the token is at a critical zone; maintaining the current level would see a breakout in the long run.
Berachain Price Forecast 2026
In recent times, Berachain operates around the $0.45 level, signaling a strong bullish breakout driven by renewed buyer demand and high trading volume. This significant move suggests broad market participation, shifting the token’s narrative from stagnant to trendworthy.
As spotted by the analyst, the sustainability of this momentum depends on how the token handles subsequent pullbacks. Meanwhile, maintaining support near current levels during consolidation would confirm robust demand and lay the groundwork for further gains. To this end, it may look like profit-taking may cause volatility, but shallow retracements would indicate that buyers remain in control and ready to defend the upward trend.
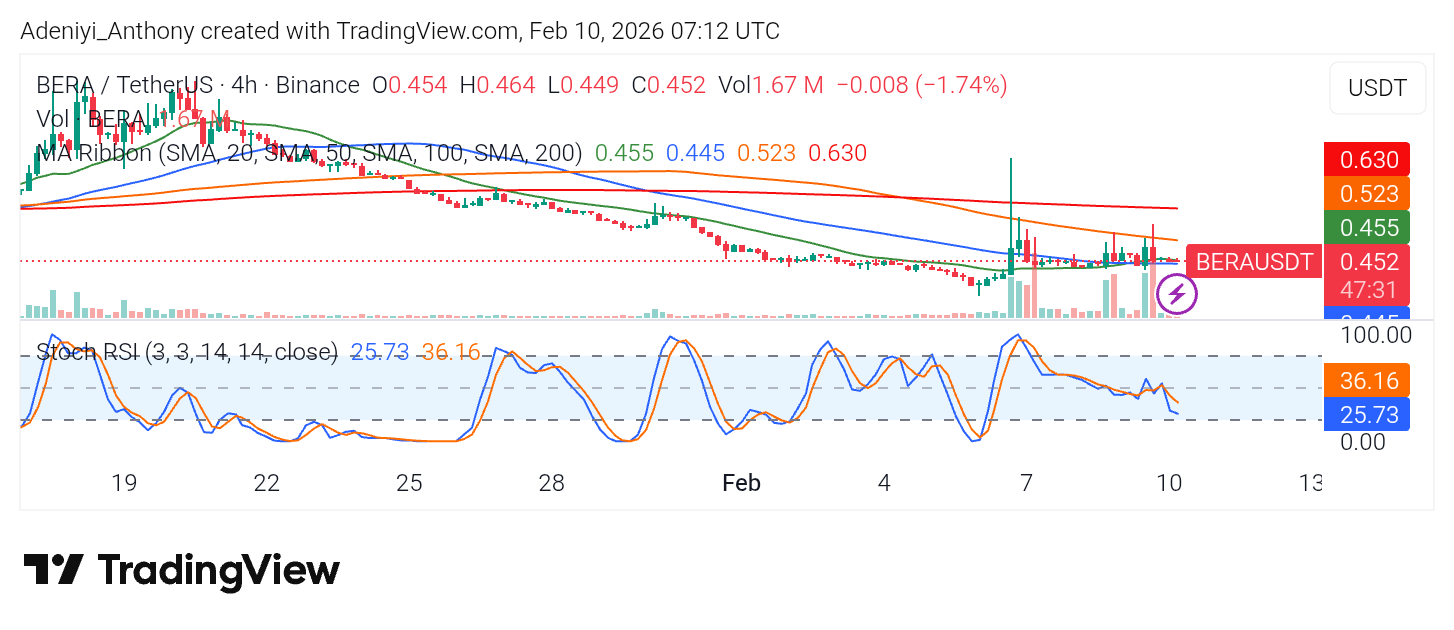
BERA/USDT Analysis: Oscillating; What’s Next?
On the 4-hour chart, it can be observed that the price has made several attempts to pump, but sellers are stepping in immediately to take profits. As it stands, the price is currently oscillating right around the 20 SMA ($0.455) and 50 SMA ($0.445) with converging MA. This sideways movement often precedes a volatile move once the price picks a direction.
To this end, with an oversold momentum oscillator, the token may realize a short-term upside move towards $0.520 if momentum is sustained; otherwise, a break towards $0.445 may be necessary.