Litecoin (LTC) Price Prediction: LTC/USDT Bears Eye the $50 Mark

Date: February 10, 2026

As a market that is highly correlated with Bitcoin, the Litecoin market has also struggled to perform well for some time. As such, price action can still be seen heading toward lower price levels, and it is likely that the market will test those thresholds.

LTC/USDT Long-Term Trend—Bearish (Daily Chart)

Key Price Levels

Resistance: $60, $65, $70

Support: $50, $45, $40

Litecoin (LTC) Price Prediction: LTC/USDT Bears Eye the $50 Mark

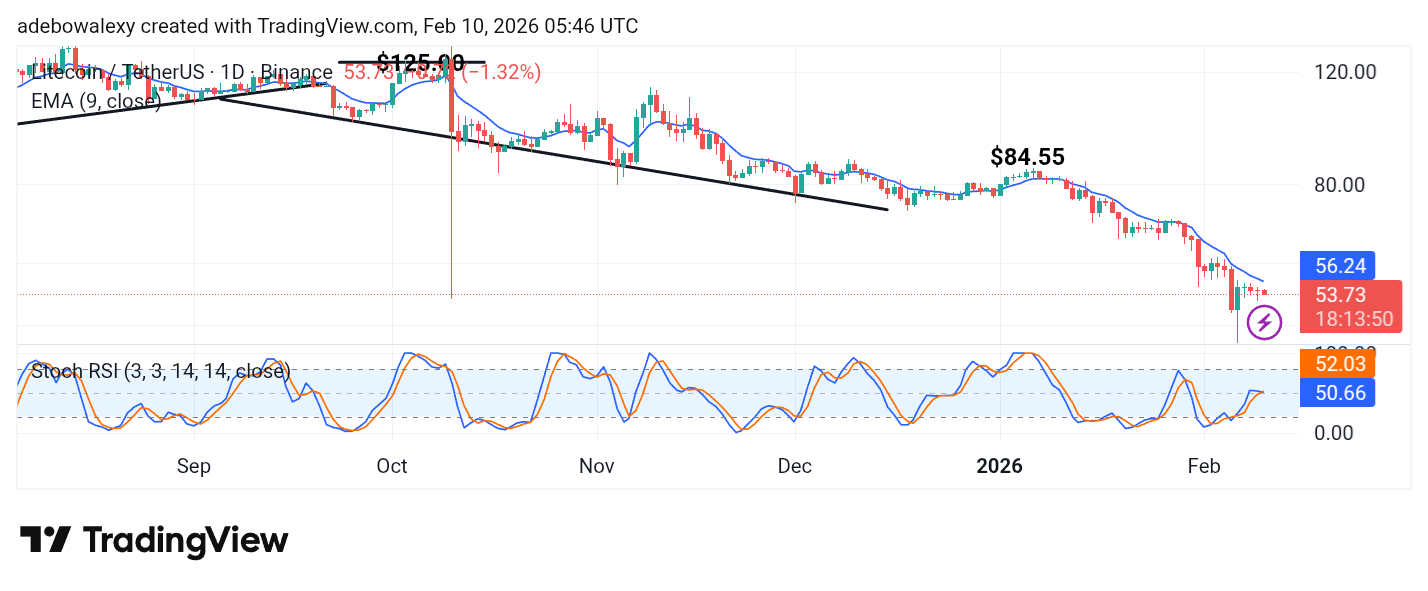
The Litecoin market rebounded downward after hitting what appeared to be resistance at the $84.55 price level. The ongoing session is represented by a red price candle, and since then, price action has continued to slide lower below the 9-day Exponential Moving Average (EMA) curve. Meanwhile, the Stochastic Relative Strength Index (SRSI) indicator lines are moving sideways around the 50 level.

Litecoin (LTC) Price Prediction: LTC/USDT Poised for More Declines

As shown on the Litecoin daily chart, price action is clearly headed toward lower price levels. Over the past two sessions, bears have remained in control of price movement. As a result, the market has been printing modest but consistent downward moves, keeping the token below the 9-day EMA curve.

The SRSI indicator lines continue to move sideways around the 50 mark. This suggests that bearish forces are still influencing the market and may keep price action pointed south.

Litecoin (LTC) Price Prediction: LTC/USDT Maintains a Bearish Bias (4-Hour Chart)

On the Litecoin 4-hour chart, downward pressure remains strong even in the short term. The most recent price candle has retained a bearish posture and continues to trade below the 9-day EMA curve. Likewise, the last three price candles are red.

Litecoin (LTC) Price Prediction: LTC/USDT Bears Eye the $50 Mark

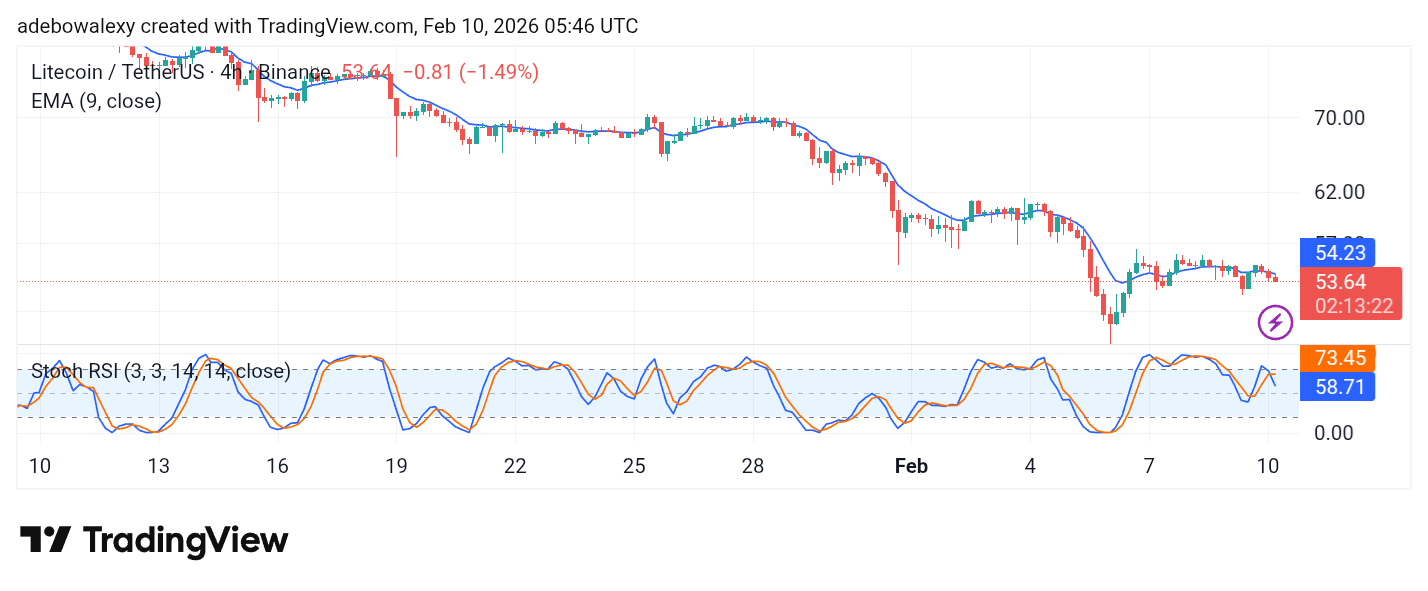
The SRSI indicator lines have crossed and now clearly point downward, indicating that bearish forces are dominant and continue to dictate the trend. Consequently, price action may drift toward the $50 price level.

Get Litecoin (LTC) here. Buy LTC 

Lucky Block (LBLOCK): The Final Washout Before a Monumental Reversal

Lucky Block (LBLOCK) is undergoing a period of intense market cleansing, a phase often witnessed before a significant trend reversal. The current price action, while challenging, is forming what technical analysts recognize as a potential capitulation low. This period of consolidation at a deep historical level is where sustainable rallies are born, offering a strategic window of opportunity.

Daily Chart Analysis: Forming a Historic Base

The daily chart reveals that LBLOCK is engaging with a profoundly significant support zone. The Parabolic SAR indicator, while currently aligned with the downtrend, shows the price trading at a substantial distance from its dots. This extreme separation can often precede a momentum shift. Most notably, the MACD, though deep in negative territory, shows a notable slowing in its downward trajectory on the histogram.

Lucky Block (LBLOCK): The Final Washout Before a Monumental Reversal
LBLOCKUSDT – Daily Chart

This deceleration in bearish momentum is the first critical step toward a potential reversal, suggesting the selling pressure is exhausting itself at this level. The token has established a critical foundational support at 0.000007368. The subsequent support level to monitor is 0.00000500. For any recovery, the initial resistance hurdles will be 0.000009411 and 0.000015050.

4H Chart Analysis: Momentum Stabilizes at an Extreme

The 4-hour chart shows the price action stabilizing after a pronounced decline, entering a phase of compression. The Parabolic SAR continues to reflect the short-term trend, but the price is attempting to base. The MACD on this timeframe, while negative, is also exhibiting a clear flattening pattern.

Lucky Block (LBLOCK): The Final Washout Before a Monumental Reversal
LBLOCKUSDT – 4H Chart

This stabilization in momentum at an extreme low is a classic technical sign that a balance is being found and a floor is being established. Immediate intraday resistance is positioned at 0.000009411. A break above this level would signal the first step in reclaiming bullish territory. The current trading is centered on defending the 0.000007368 support.

Conclusion: Positioning at a Generationally Significant Level

Lucky Block is testing a price level that represents a extreme valuation point. History shows that the most powerful bull markets often ignite from zones of maximum pessimism, where weak hands capitulate and long-term foundations are laid. The current technical picture, characterized by exhausting bearish momentum and price stabilization at deep support, sets the stage for a powerful mean reversion rally. For the strategic investor, this represents a high-conviction accumulation zone before the next major upward cycle.

Invest wisely, and let Lucky Block’s potential work in your favor. You can purchase Lucky Block here.  Buy LBLOCK

Decentraland (MANA/USDT) Breaks Structure and Continues Bearish Trend

MANA/USDT Price Analysis: MANA/USDT Returns to Bearish Trend After Liquidity Sweep and Order Block Rejection

MANA/USDT remains under strong bearish pressure after sweeping liquidity above the Order Block (OB) zone around the $0.1740 level. Price tapped into the OB near $0.1900, which pushed the market into a Break of Structure (BOS) at the $0.1160 level.

MANA/USDT Key Levels

Support Levels: $0.1160, $0.1080, $0.0980
Resistance Levels: $0.1500, $0.1700, $0.1900

Decentraland (MANA/USDT) Breaks Structure and Continues Bearish Trend

On the daily timeframe, price is in a corrective/pullback phase after the bearish expansion. The most likely outcome is for the market to retrace back to the only valid Order Block around the $0.1500 level before continuing its bearish move. The Stochastic Relative Strength Index (Stoch RSI) is hovering near the oversold region around the $0.1160 support level. Any upside movement is likely corrective unless price reclaims higher structure levels.

The Bollinger Bands show price trading close to the lower band, signaling that bears have dominated from October to January. Bulls made an attempt to push price higher, but that move was rejected by the two Order Block zones.

Decentraland (MANA/USDT) Breaks Structure and Continues Bearish Trend

Market Expectation

On the 4-hour timeframe, the recent pullback lacks strong bullish volume, signaling that buyers are still weak. The Fibonacci retracement aligns with rejection near the 0.618 zone, further strengthening the bearish bias. As long as price remains below the Order Block and trendline resistance, the market is likely to continue its downward expansion.

You can purchase Lucky Block here.  Buy LBLOCK

Note: Cryptosignals.org is not a financial advisor. Do your research before investing your funds in any financial asset or presented product or event. We are not responsible for your investing results.

Axie Infinity (AXS/USD) Price Prediction: AXS Coin Major Breakout?

Axie Infinity is currently undergoing a bullish recovery, with price action now at a critical crossroads around the $1.5 level. This zone is acting as a key test for the ongoing rebound, and a decisive breakout above it is crucial for further upside. So far in the daily trading session, bulls have shown notable strength, pushing the market up to the important $1.5 resistance. However, trading activity has become cautious at this level, as mild profit-taking has triggered a short-term pullback.

Axie Infinity (AXS/USD) Market Data

  • AXS/USD Price Now: $1.48
  • AXS/USD Market Capitalization: $216 million
  • AXS/USD Circulating Supply: 168.96 million AXS
  • AXS/USD Total Supply: 270 million AXS
  • AXS/USD CoinMarketCap Ranking: #130

AXS coin Major Breakout? AXS Coin Price Prediction Feb 9, 2026

For several sessions, AXS has been trading firmly within a bearish zone, with price action remaining below two key moving averages. However, over the past 24 hours, the market has posted a strong recovery, gaining approximately 20% so far today and breaking above these moving averages. Despite this rebound, bearish pressure near these levels has significantly slowed upward momentum, preventing the price from making further progress to the upside. Bulls are still actively contending in this zone, which has helped the market remain supported. All eyes are now on the market’s next decisive move.

Key Levels to Monitor

  • Resistance: $1.60, $1.70, $1.80
  • Support: $1.40, $1.35, $1.30

Axie Infinity (AXS/USD) Price Prediction: AXS Coin Major Breakout?

Axie Infinity Analysis: Technical Viewpoint

Today’s market highlights a notable shift in Axie Infinity’s price action, as a bullish recovery emerges after a prolonged bearish trend that began at the $3.00 level. The market had previously surged strongly, with the bull run peaking near $3.00, before giving way to sustained selling pressure in the days that followed. This decline continued until buyers found support around $1.25. As a result, nearly all the gains from the prior bullish run—which initially started near the $1.00 level—have been erased. Currently, bulls are attempting to reclaim the $1.50 price level, and the market’s reaction at this zone is likely to determine the next directional move.

Axie Infinity (AXS/USD) Price Prediction: AXS Coin Major Breakout?

AXS/USD 4-Hour Chart Outlook

Zooming into the 4-hour chart, the market reveals a stalemate between demand and supply at the critical $1.50 price level. The trading volume indicator shows substantial trader interest; however, with neither side in clear control, volume may begin to decline. This equilibrium between buyers and sellers suggests that the market could consolidate around this level before ultimately establishing its next directional move.

Trade crypto coins on BYBIT

BNB Price Feels the Altcoin Chill Amid Macro-Trend Breakdown

The market for BNB against Tether has slipped 3.05% towards $626 over the last 24 hours. As it stands, investors are retreating into the market leader’s relative safety, with capital rotating out of altcoins amidst a climate of extreme market fear.

Technically, the BNB price still maintains its $600 psychological support limit as the price consolidates. However, a dip below this level could trigger a move towards $576. Meanwhile, a shift in the Altcoin season indicator will signal recovery or a prolonged downtrend as the price struggles to hold on to its current level.

Currently, BNB trades at $626 with more than 61,000 traded volumes on the daily chart.

BNB Price Feels the Altcoin Chill Amid Macro-Trend Breakdown
BNBUSDT-Daily Chart

Technical Indicator

Major Resistance Levels: $640, $650, and $680

Major Support Levels: $622, $600, and $580

BNB Displays Calmness; What’s Next?

In a post on X, @TonTraderCom, a BNB analyst, has suggested that BNB is currently compressing, moving sideways around $644. The analyst pointed to a tight range established between $642 and $646 on the 5-minute timeframe, suggesting narrowing volatility and equilibrium.

Additionally, the trader is of the opinion that the bulls are defending the current level, and as the market’s bullish participants continue to defend the support level, anticipation leans towards a breakout.

Technical Analysis

On the daily timeframe, BNB price is moving further south after months of oscillating within the $640 and $680 zone. The Guppy Multiple Moving Averages (GMMA) appears to be confirming this downtrend with diverging sets of exponential moving averages as the price action signals the influence of the sellers.

Beneath the chart, the Stochastic RSI is slightly above the oversold region, though not extremely oversold, but the direction of the lines shows no reversal in play at the moment. To this end, if the bulls can hold the current level, the pair might consolidate before any relief bounce towards $640.

BNB/USDT Analysis: Short-term BNB Price Volatility: What’s Next?

On the 4-hour chart, the BNB price appears to be stabilizing with the EMAs moving sideways after the recent dip. Meanwhile, the stochastic oscillator seems to be heading south, extending towards the 55-mark level, portraying the downtrend on the daily timeframe.

However, as the momentum oscillator approaches the mid-level and the price tends to $615, the bulls may capitalize on this low to revive interest, but volume is still low. To this end, if volume in support of the buyers fails to materialize, the $600 psychological level will be exposed.

BNB Price Feels the Altcoin Chill Amid Macro-Trend Breakdown
BNBUSDT-4H Chart


You can purchase crypto coins here. Buy Crypto

Dogecoin (DOGE) Price Prediction: DOGE/USDT Consolidates Below the $0.1000 Threshold

Date: February 9, 2026

The Dogecoin market has been moving from one lower support level to another. However, this trend is common among most coins lately. As such, this market still appears to be under heavy pressure and may wind up at lower price levels.

DOGE/USDT Long-Term Trend — Bearish (Daily Chart)

Key Price Levels

Resistance: $0.1000, $0.1150, $0.1300

Support: $0.0900, $0.0800, $0.0700

Dogecoin (DOGE) Price Prediction: DOGE/USDT Consolidates Below the $0.1000 Threshold

Recently appearing price candles in the Dogecoin market have been red. The most recent price candle is red but very small. Additionally, price action can be seen trading below the 9-day Exponential Moving Average (EMA) line. In addition, the Stochastic Relative Strength Index (SRSI) lines show a generally upward bias, but with convergence toward a potential bearish crossover near the terminal.

Dogecoin (DOGE) Price Prediction: DOGE/USDT Continues to Tilt Toward a Bearish Path

Although it is clear that price action remains under the influence of headwinds, bearish forces are also encountering some resistance. This appears largely due to a possible loss of bearish momentum at this point.

Nevertheless, the position of price action below the 9-day EMA curve still gives bears an edge. Additionally, the SRSI lines are tilting toward a crossover while remaining generally pointed upward. However, stronger bearish pressure could trigger the crossover, resulting in a more pronounced downward move in this market.

Dogecoin (DOGE) Price Prediction: DOGE/USDT Generally Consolidates but May Descend

Even on shorter market timeframes, such as the 4-hour chart, the Dogecoin market remains consistent with a bearish outlook. Here, price activity stays below the 9-day EMA curve, even as it closely follows this technical level.

Dogecoin (DOGE) Price Prediction: DOGE/USDT Consolidates Below the $0.1000 Threshold

The current session’s price candle is red and places the token’s price below the 9-day EMA curve. Additionally, the SRSI indicator lines are declining toward the 50 level. As it stands, this market may edge toward the $0.0950 price level.

Get Dogecoin (DOGE) here. Buy DOGE 

Brian Armstrong’s Bullish Crypto Outlook Boosts Confidence Amid Market Volatility

The Coinbase Chief Executive Officer, Brian Armstrong, has reiterated a bullish crypto outlook despite the recent dip in market price. As it stands, this signals continued confidence in the long-term growth of digital assets. In a post shared on social media platform X on Feb. 7, Armstrong was reported to have said that sharp market swings remain a familiar feature of crypto markets and do not weaken his broader belief in the sector’s future.

He was quoted as describing recent turbulence, including a notable decline in Bitcoin mining difficulty, as part of a repeating cycle rather than a sign of deeper structural problems. Therefore, he reportedly stated that such periods have occurred many times before and have not altered his long-term conviction that crypto is rapidly reshaping global financial services.

Brian Armstrong’s Bullish Crypto Outlook on Market Cycles

Expanding on his bullish crypto outlook, Armstrong was reported to have said that digital assets are steadily absorbing functions traditionally handled by banks and payment firms. He reportedly argued that innovation in crypto infrastructure continues regardless of short-term investor sentiment. According to his comments, he personally remained optimistic because he viewed crypto as advancing at an exceptional pace across several dimensions of finance.

Armstrong was also reported to have stressed that Coinbase’s strategy remains unchanged during volatile periods. To this, he explained that the company continues to develop products and services through all market conditions, with the broader aim of modernizing outdated financial systems and building confidence.

Regulation, AI, and Coinbase’s Long-Term Crypto Vision

Looking beyond the market sentiment as a result of the direction of the market price, Armstrong was reported to have linked crypto’s future to emerging technologies such as artificial intelligence (AI). He has previously suggested that autonomous AI systems could rely on programmable digital money, including stablecoins and smart contracts, rather than well-known conventional bank custody.

Brian Armstrong’s Bullish Crypto Outlook Boosts Confidence Amid Market Volatility

He was also reported to have embraced the growing regulatory clarity in the United States and the recent legislative developments, alongside expectations of more crypto-friendly leadership at the Securities and Exchange Commission.

However, Armstrong reportedly opposed the current Senate version of the CLARITY Act, arguing that it could worsen existing conditions. He has consistently maintained that clearer legal boundaries between regulators would reduce uncertainty, lower institutional risk, and encourage broader capital participation in the crypto market.


In order to place winning trades with us via Bybit, you can open an account here.

Compound (COMP/USDT) Continues in a Bearish Trend

COMP/USDT Price Analysis: COMP/USDT Continues Lower with Momentum After Breaking Support

COMP/USDT experienced a strong bearish move after breaking below a key consolidation zone around the $23.50 support level. The breakdown came with increased bearish momentum, pushing price into a new lower range and confirming a continuation of the downtrend structure.

COMP/USDT Key Levels

Support Levels: $19.90, $18.30
Resistance Levels: $23.50, $27.50

Compound (COMP/USDT) Continues in a Bearish Trend

On the daily timeframe, a double top chart pattern can be seen at the $27.50 price level. The neckline of the pattern was broken, signaling the breakout of the support at the $23.50 level. Although the market attempted a short-term consolidation, sellers regained control.

On the daily timeframe, the Bollinger Bands expanded to the downside, signaling strong volatility in favor of sellers. At the $19.90 price level, the Stochastic Relative Strength Index (Stoch RSI) is near the oversold region, suggesting that while short-term pullbacks may occur, the market structure remains bearish.

Compound (COMP/USDT) Continues in a Bearish Trend

Market Expectation

On the 4-hour timeframe, price formed a brief rising wedge before breaking downward, confirming continuation of the bearish trend. Current price action is consolidating near the $19.90 support zone. The Moving Average Cross (MA Cross), with the 9MA crossing above the 21MA, shows that there may be a pullback toward the nearest Point of Interest (POI).

You can purchase Lucky Block here.  Buy LBLOCK

Note: Cryptosignals.org is not a financial advisor. Do your research before investing your funds in any financial asset or presented product or event. We are not responsible for your investing result.

Pepe (PEPE/USDT) Pulls Back to Support Zone After Bullish Expansion

PEPE/USDT Price Analysis: PEPE/USDT Pulls Back and Reacts to the Bullish Order Block

PEPE/USDT price swept liquidity below the support area and pushed to break the short-term consolidation at the price level of $0.00000500. It then turned into an uptrend with strong momentum.

PEPE/USDT Key Levels

Support Levels: $0.00000390, $0.00000370
Resistance Levels: $0.00000500, $0.00000730

Pepe (PEPE/USDT) Pulls Back to Support Zone After Bullish Expansion

On the daily timeframe, price was pushed back by the resistance at the level of $0.00000730. It formed long-wick candles when it reached the bullish Order Block (OB) at the price level of $0.00000390. The selling volume at the same price level did not increase much compared to previous volume.

On the daily timeframe, the market is in the oversold region of the Stochastic Relative Strength Index (Stoch RSI) at the price level of $0.00000390. All these show signals that the market is likely to respect and reverse from the OB to continue the uptrend move. If the market breaks below the OB, it is likely to be a fake breakout (fakeout) and not a real trend shift.

Pepe (PEPE/USDT) Pulls Back to Support Zone After Bullish Expansion

Market Expectation

On the 4H timeframe, price forms an ascending channel chart pattern right at the support zone at the level of $0.00000390. The volume indicator also shows low bearish volume. This may mean the support zone is being respected, and a price reversal could happen soon.

You can purchase Lucky Block here.  Buy LBLOCK

Note: Cryptosignals.org is not a financial advisor. Do your research before investing your funds in any financial asset or presented product or event. We are not responsible for your investing result.