Stellar Lumens (XLM/USD) has experienced prolonged bearish momentum, driving price down to the $0.1590 area after failing to maintain ground above key technical thresholds. The asset is currently navigating a compressed trading zone while showing signs of momentum depletion on both daily and intraday charts.
XLM/USD Daily Chart (Daily Key Levels):
Support Zones: $0.1319, $0.1000 Resistance Zones: $0.2160, $0.2640
XLM/USD Long-Term Trend – Bearish (Daily Chart)
XLM/USD is presently valued at $0.159430, reflecting a 2.80% pullback during the current trading period. The daily Stochastic oscillator registers 30.81, positioning the asset in oversold territory where momentum typically begins to wane and reversal setups can develop.
$XLM isn’t just a payment coin anymore it’s the backbone of the $1B+ Tokenized Asset revolution. 🚀
While others chase hype, Stellar is building:
✅ $1B+ in Real-World Assets (RWAs) on-chain.
#Stellar#XLM#CryptoInvesting#RWApic.twitter.com/emXAEiN34z
The moving average alignment reveals the depth of the downtrend. Both averages continue trending lower, reinforcing the negative bias that has gripped the market.
Following a peak near $0.5210 in earlier periods, Stellar has carved out a methodical series of lower swing highs and lower swing lows. The price action displays consistent rejection at overhead resistance levels, with rallies repeatedly failing to gain traction. Candle patterns exhibit minimal buying conviction, characterized by shallow bounces that quickly reverse into fresh selling waves.
The focus now shifts to whether support near $0.1319 can provide enough buying interest to halt the decline. A breakdown through this level with expanding volume would likely accelerate selling toward the psychological $0.1000 threshold. Conversely, a strong recovery above $0.2164 accompanied by robust participation would challenge the bearish narrative and could open the door toward $0.2647 or higher resistance areas.
XLM/USD Short-Term Trend – Bearish (4 Hour Chart)
Transitioning to the 4 Hour perspective, XLM/USD remains trapped in bearish territory with price consolidating around $0.159310. The intraday structure continues to reflect weakness, with periodic bounces being absorbed by fresh selling pressure.
The Stochastic indicator on this timeframe reads 66.11, showing relatively neutral momentum compared to the daily chart but still within a framework of lower highs. The 9-period moving average at $0.159510 sits marginally below the 21-period average at $0.162780, maintaining the short-term bearish alignment.
XLM/USD Market Statistics Current Price: $0.1593 Market Capitalization: $4.8 Billion 24H Trading Volume: $156 Million
Bitcoin (BTC/USD) has encountered intense selling activity, pushing price beneath the psychological $75,000 level and into a critical demand area near $63,380. The market structure has deteriorated across both intraday and longer-term intervals, with technical oscillators flashing warning signals. While the downtrend appears firmly established, extreme oversold readings hint that capitulation may be nearing, potentially setting the stage for a counter-trend bounce if buyers emerge.
BTC/USD Daily Chart (Daily Key Levels):
Support Zones: $62,206, $55,000 Resistance Zones: $73,998, $85,131
BTC/USD Long-Term Trend – Bearish (Daily Chart)
Bitcoin is currently trading at $63,380, marking a sharp 2.71% decline during the present session. On the daily chart, the Stochastic indicator has plunged to 4.30, representing one of the most oversold conditions seen in recent months and signaling potential exhaustion among sellers.
BTCUSD BTC Technical Analysis Chart Update..📈📉
Signal With Proper Entry Point SL And TP Will Be Posted In Our Telegram Channel..✅
The moving average configuration paints a concerning picture for bulls. The 9-period MA has declined to $78,250 while the 21-period MA sits at $91,290, both sloping downward with price positioned well beneath these averages. This arrangement confirms the prevailing distribution phase and reflects weakening market confidence.
After reaching highs near $111,898, Bitcoin has embarked on a methodical decline characterized by successive failures at resistance and persistent breakdowns of prior support levels. Each rally attempt has been met with aggressive selling, preventing any sustainable recovery. The candle formations display long upper wicks and closes near session lows, patterns that typically emerge when supply overwhelms demand.
The critical question now centers on whether the $62,200 support zone can absorb selling pressure and trigger a reversal. Should this level fracture under heavy volume, the path of least resistance points toward $55,000 or potentially lower. On the flip side, a decisive recapture of $73,990 zone backed by genuine buyer conviction would begin to repair the damaged technical picture and could reignite bullish interest toward $85,131 zone and beyond.
BTC/USD Short-Term Trend – Bearish (4 Hour Chart)
Examining the 4 Hour structure, Bitcoin continues its descent with price hovering around $63,380 key level. The intraday action has been characterized by relentless downside momentum with minimal consolidation periods, indicating strong directional conviction among participants.
The Stochastic reading on this compressed timeframe sits at 7.65, reflecting deeply oversold territory where short-term traders typically become cautious about initiating fresh short positions. The 9-period moving average at $69,859 remains substantially below the 21-period average at $74,174, reinforcing the bearish bias at shorter intervals.
Bitcoin Cash (BCH/USD) continues to trade under sustained bearish pressure, with price action rejecting below the $612.00 important level. Sellers remain in control across multiple timeframes, and momentum indicators lean decisively bearish. However, early oversold signals are starting to emerge, suggesting that a short-term relief bounce is possible if demand re-enters the market.
BCH/USD Daily Chart (Daily Key Levels):
Support Zones: $520.07, $446.57 Resistance Zones: $612.92, $650.72
BCH/USD Long-Term Trend – Bearish (Daily Chart)
BCH/USD is currently trading around $516.50, down approximately 2.77% on the session. On the daily timeframe, the Stochastic oscillator sits near 36.22, indicating weak momentum and lack of strong buying support.
Price Action: Bitcoin Cash is currently trading at $537.4, with the most recent candle closing at this level after opening at $532.5. The high for the most recent candle reached $542.6, while the low was $529.2.
The Moving Average Cross shows the short-term MA at $536.80 below the long-term MA at $566.70, confirming that bearish momentum is still in force. Price recently printed a rejection from $650.72 and has been forming consistent lower lows throughout the entire downtrend. This shows a structure typically associated with seller dominance and weak buyer participation.
The market remains in a defined downtrend. A failure to reclaim $612.92 with conviction increases the likelihood of continued downside pressure. The next major support lies at $520.07, with a deeper target toward $446.57 if that level fails to hold.
Alternatively, a clean reclaim of $612.92 with volume and follow-through would reduce short-term bearish bias. It could spark a short-covering rally toward $650.72 and eventually $700.00.
BCH/USD Short-Term Trend – Bearish (4 Hour Chart)
On the 4 Hour timeframe, BCH/USD is showing persistent short-term weakness. Price is trading near $516.30 with lower highs and lower closes developing across the recent range.
The Stochastic oscillator reads 22.69, reflecting intense selling pressure at the intraday level. The Moving Average Cross shows the 9 MA at $528.00 decisively below the 21 MA at $527.46, confirming short-term bearish momentum remains entrenched.
BCH/USD Market Statistics Current Price: $516.38 Market Capitalization: $10.2 Billion 24H Trading Volume: $385 Million
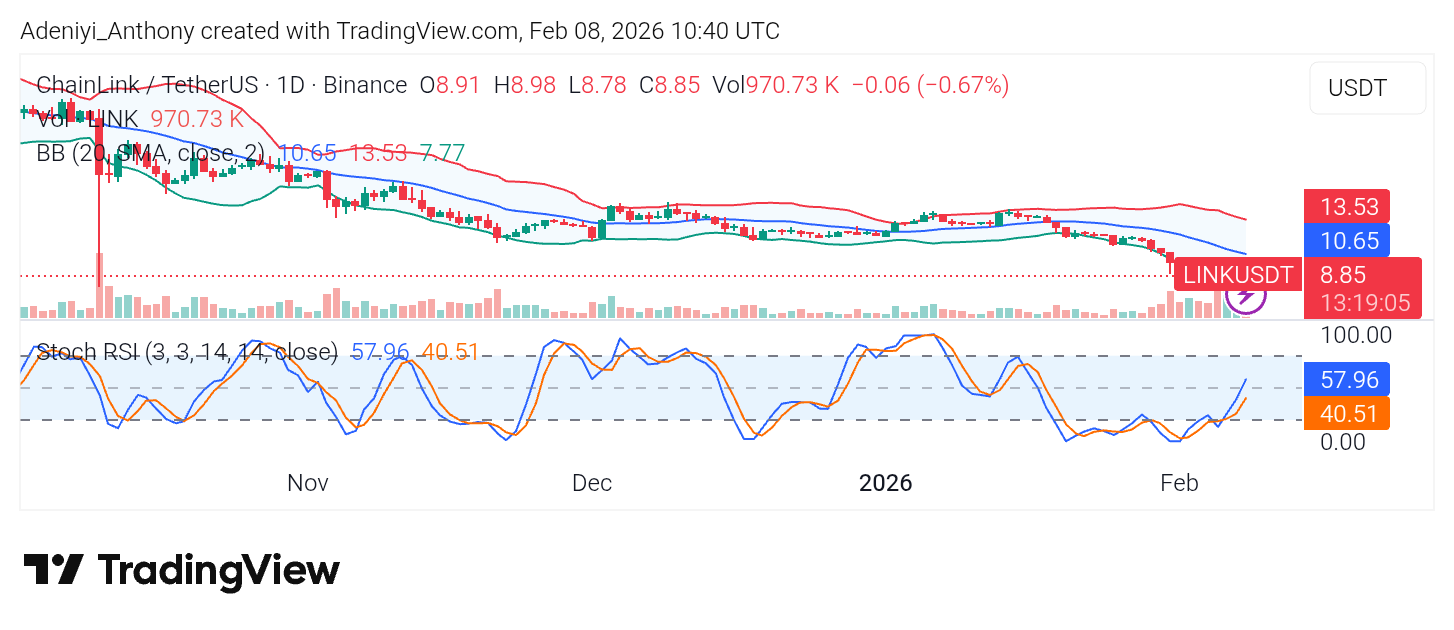
The market for Chainlink over the last 24 hours has been experiencing a price dip, dropping 0.84% against Tether towards the $8.00 psychological level. As it stands, the fall in Chainlink price reflects the strength of the broader selling pressure and capital rotation from Altcoins.
Technically, the token’s near-term outlook depends on the maintenance of the current support level around $8.83. Meanwhile, if this level fails to hold, the price may slide into $6.00, as true recovery requires a change in the seasonal indicator.
Profit Demon, a Chainlink trader and analyst, posted a moment ago on X (formerly Twitter) that the Chainlink price is maintaining its position above the lower boundary within the symmetrical triangle pattern formation. The analyst is of the opinion that the bullish traders are successfully defending the critical support level. Therefore, it was stated that if the token records a strong bounce, the $11 – $50 range may be the next operating range.
Technical Analysis
On the daily timeframe, Chainlink against Tether shows a prolonged descending trend with Chainlink price operating close to the lower Bollinger Bands. As it stands, the $7.77 support level is the only support preventing further fall, particularly into the $6.00 level.
Meanwhile, the Stochastic RSI curls upward from the oversold region, suggesting downward pressure is waning, and a brief bounce towards the dynamic band ($10.65) could be on the horizon. Conversely, a fall below the identified support level will pave the way for further downside risk.
Understanding Chainlink Price Wave Structure
Chainlink is technically respecting the micro support between $8.46 and $8.75 following a three-wave corrective decline. As it stands, the current price action suggests a developing five-wave impulsive move with the third wave showing aggressive strength. Though the immediate trendline above the formed triangle is being tested, anticipation should be towards a brief wave-4 pullback before setting the stage for a potential bullish springboard.
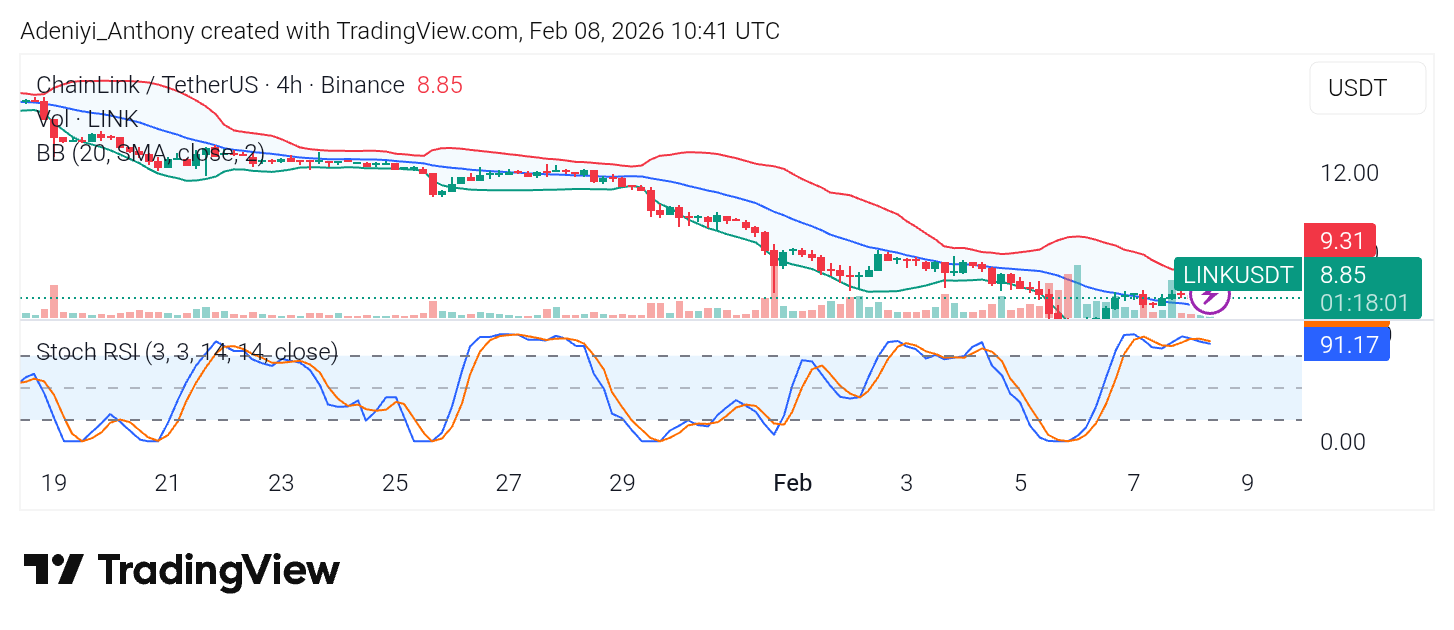
From the 4-hour chart, LINK/USDT is in a minor bullish divergence attempt near the $8.85 mark with several bullish candle developments. However, the stochastic oscillator provides a structural view of the impending move in the coming session as lines operate deeply into the overbought region.
To this end, with the squeeze in the band space, a slight pullback before a move into the $9-$10 range would be recorded.
The CoinMarketCap platform is currently featuring several top-trending markets, and we are focusing on five of them. These markets have climbed to prominence due to increased search interest, growing community buzz, and notable spikes in volatility over the past 24 hours. Today’s selection reflects a mix of market sentiments, ranging from assets that have been trending steadily upward to those that have experienced sudden price surges within the last day, as well as newly launched markets gaining early attention.
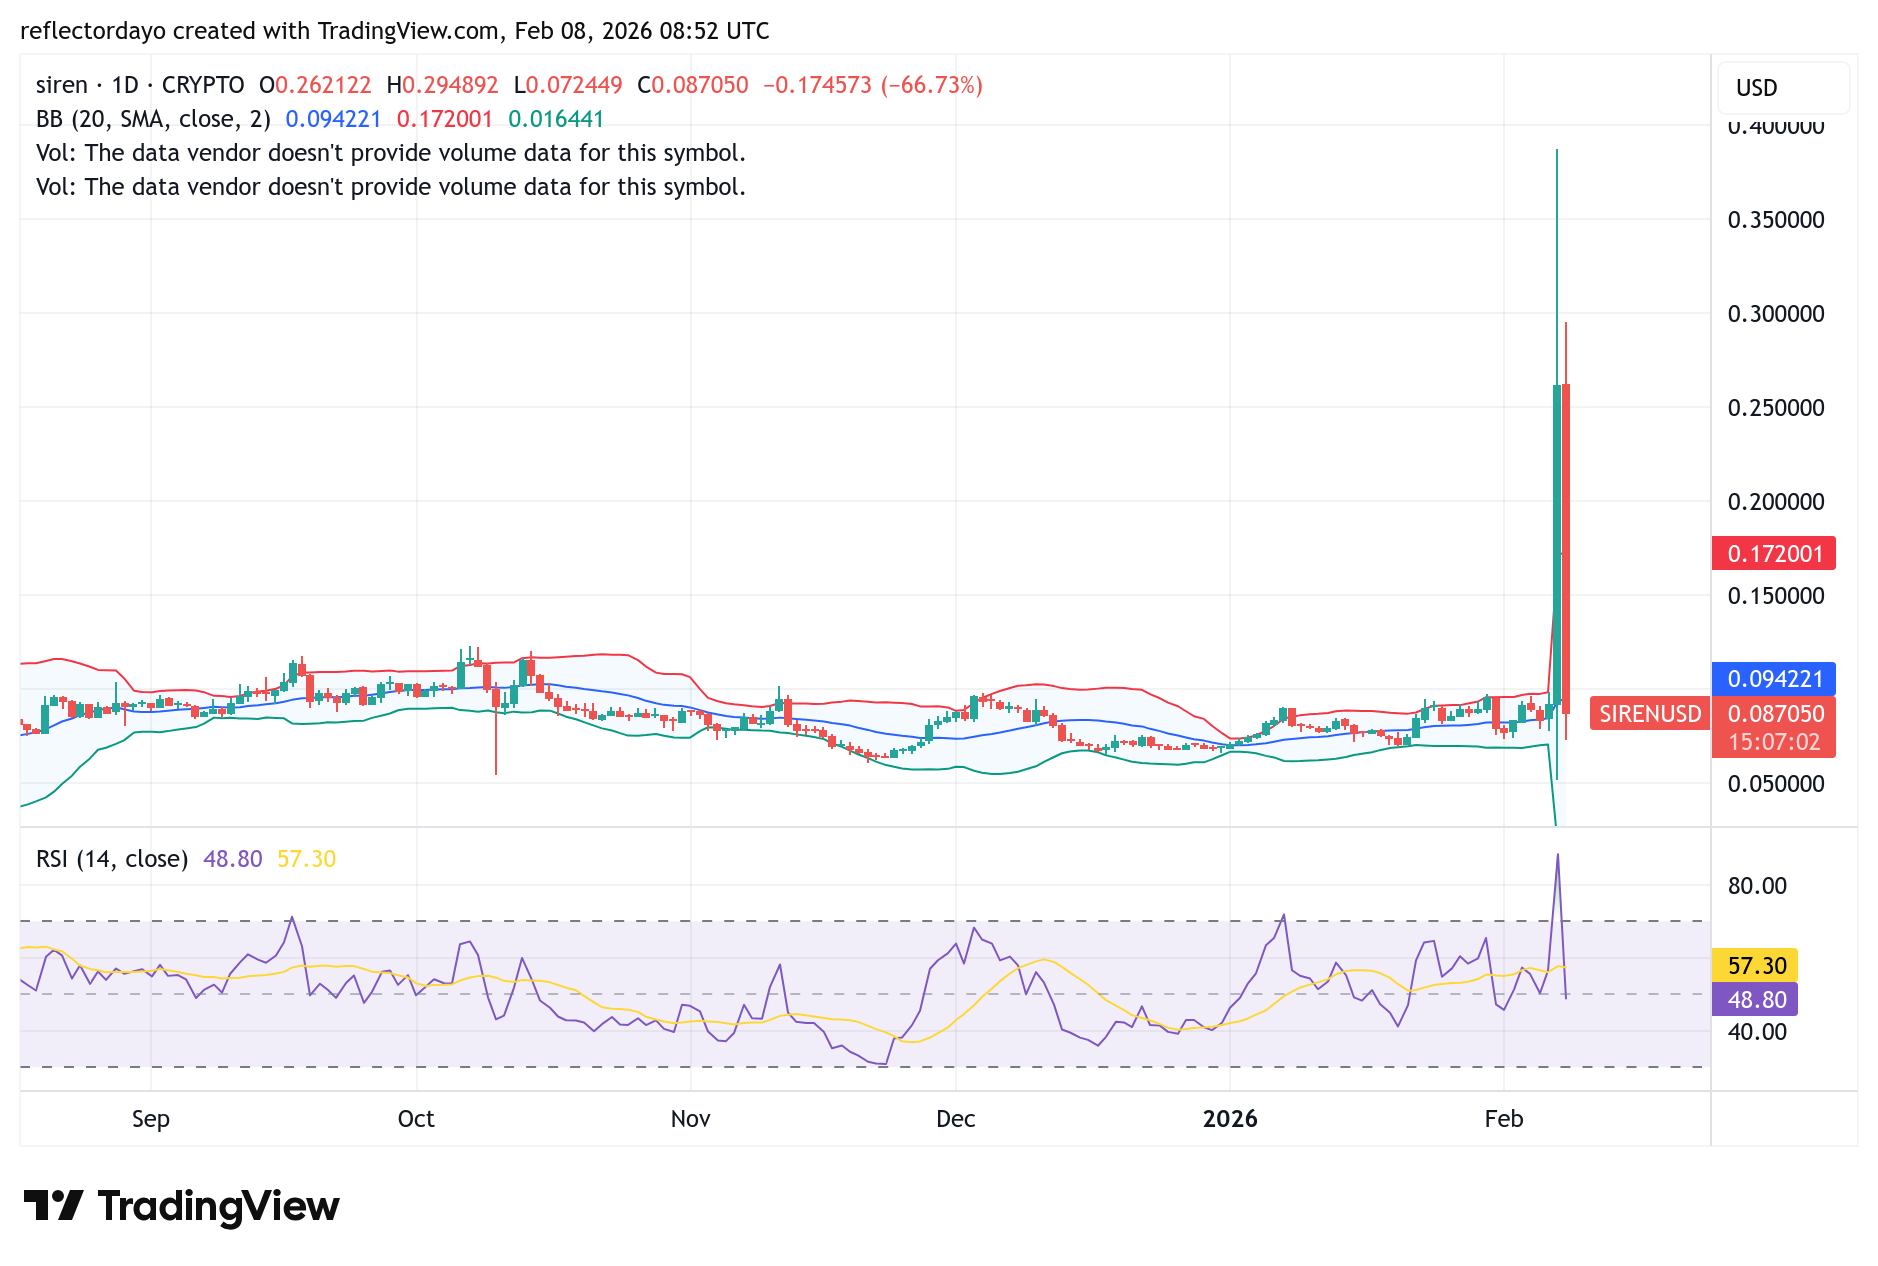
Siren (SIREN)
Major Bias: Indecision
Topping today’s trending market list is the asset that recorded the most significant spike in volatility. Over the past 24 hours, the price surged sharply to the upside. Prior to this move, price action had been consolidating around the $0.084 level for an extended period.
During the last daily trading session, the market rallied aggressively and briefly peaked above the $0.35 level. However, the rally proved unsustainable, as profit-taking quickly erased most of the gains. The price has since returned to its previous sideways range around $0.084.
Despite the pullback in the crypto signal, this volatility spike could be an important signal. After a prolonged period of consolidation near the $0.084 level, the sudden surge may indicate that the market is building momentum for a decisive directional move in the near term.
Current Price: $0.0848
Market Capitalization: $61.6 million
Trading Volume: $313 million
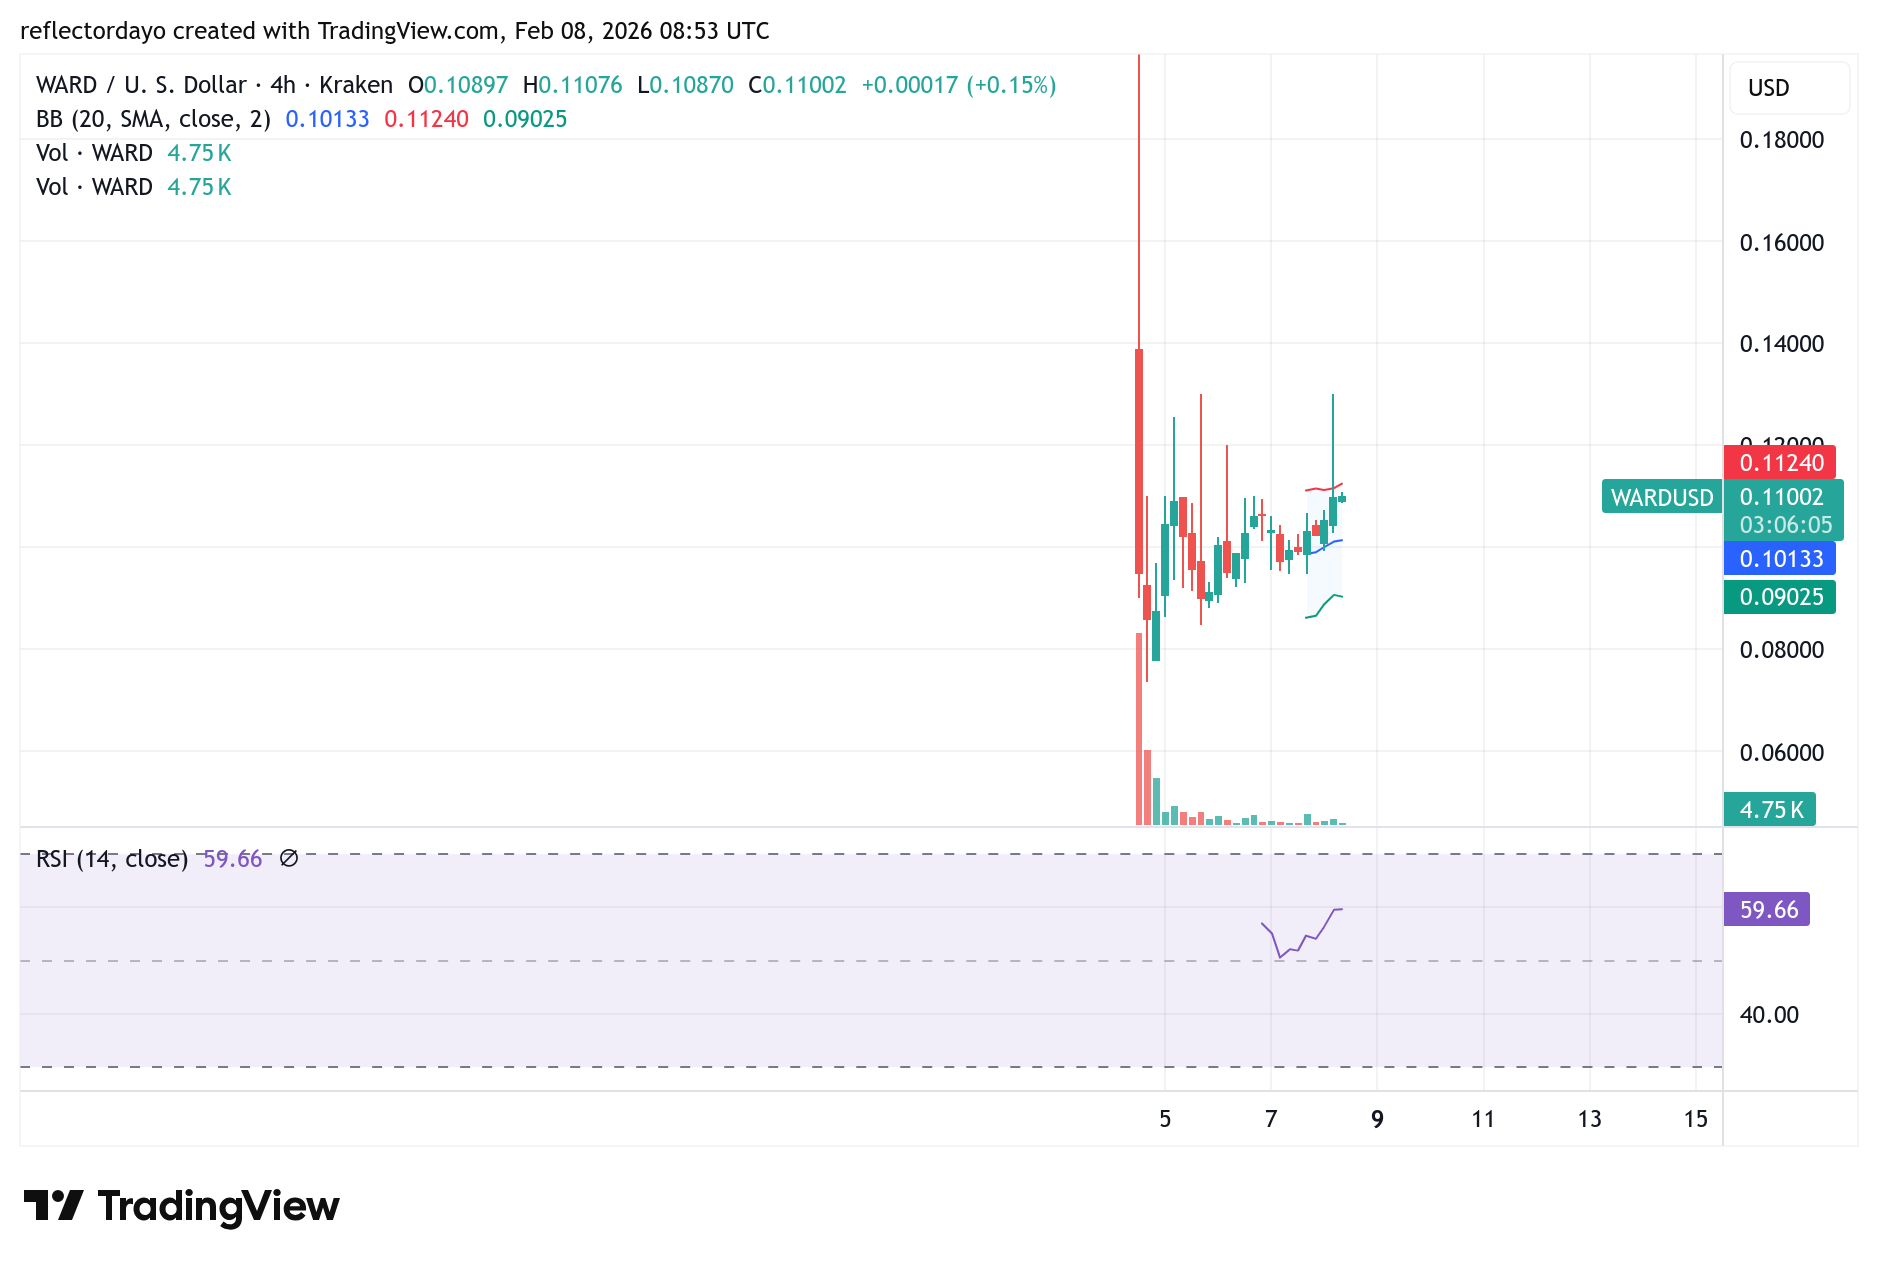
Warden (WARD)
Major Bias: Bearish
Coming in second on the trending list is the Warden market (WARD/USD). This appears to be a newly launched asset, as the available historical data on the chart only dates back to February 4. The market is clearly benefiting from strong community buzz and heightened speculation, which typically characterize newly launched assets.
Despite this interest, trading initially began on a bearish note. The market opened near the $0.20 level, but after finding support around the $0.08 zone, price action began to build upward momentum in a more structured manner. The price has been ascending gradually and is currently trading around $0.11267.
Current Price: $0.11267
Market Capitalization: $28 million
Trading Volume: $289 million
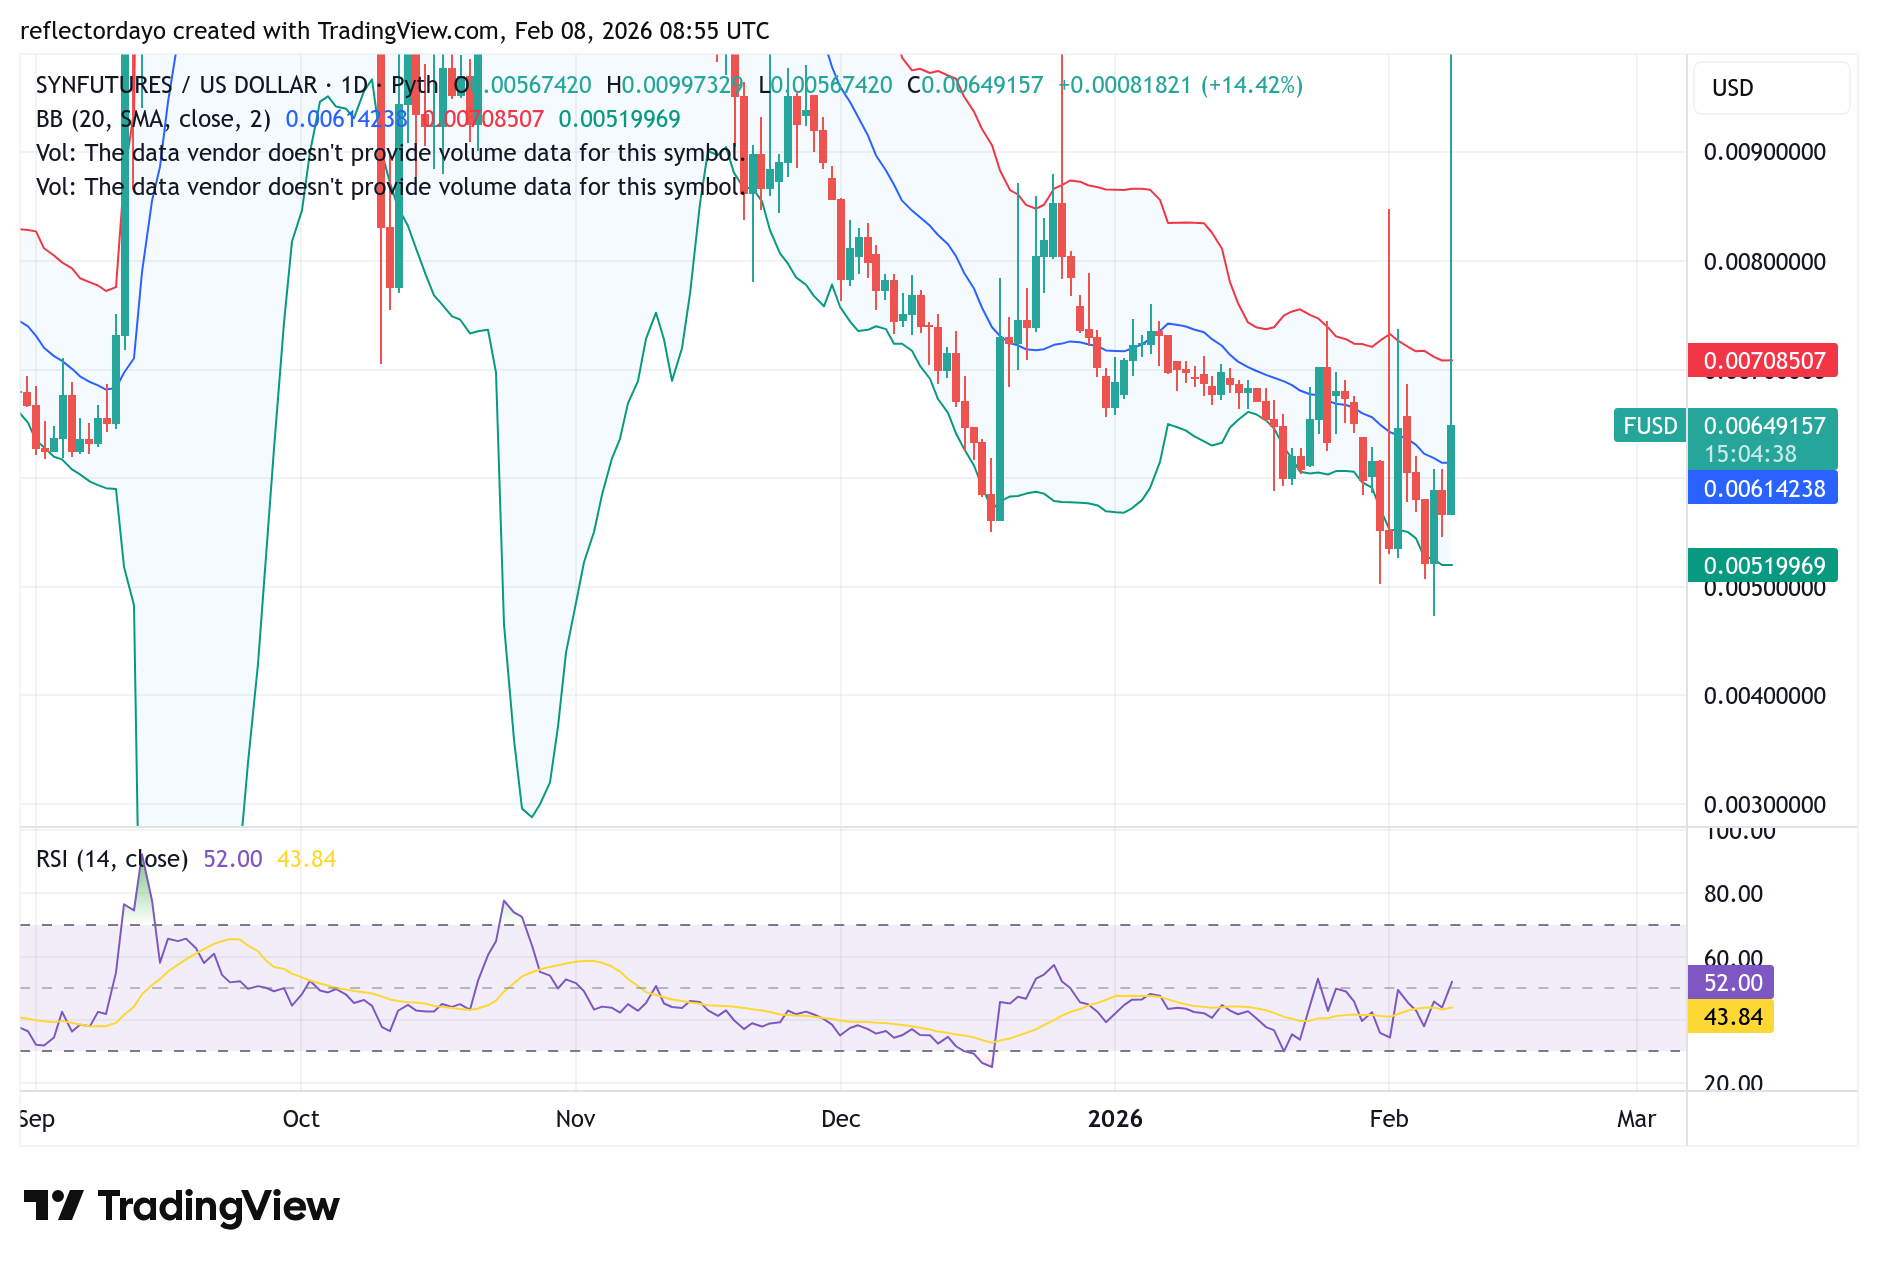
SynFunction (F)
Major Bias: Indecision
With the formation of lower highs and lower lows, this market is clearly in a bearish trend. However, when price action reached the $0.0055 level—a key support zone from previous trading sessions—a noticeable spike in market volatility occurred.
This volatility may have been triggered by a brief breakdown below the critical support level, followed by a rebound as bullish sentiment emerged from below the zone. This sequence resulted in notable price swings around the level.
Although the downward-sloping trendline continues to reflect an overall bearish structure, the price has reclaimed and rebounded above the key $0.0055 level. In addition, the market is now attempting to sustain movement above the $0.0065 level.
Considering the Relative Strength Index (RSI) readings, the market is currently in an equilibrium state. As a result, price action may continue to range sideways around this area for some time before a clearer directional move develops.
Current Price: $0.0066
Market Capitalization: $23 million
Trading Volume: $74.9 million
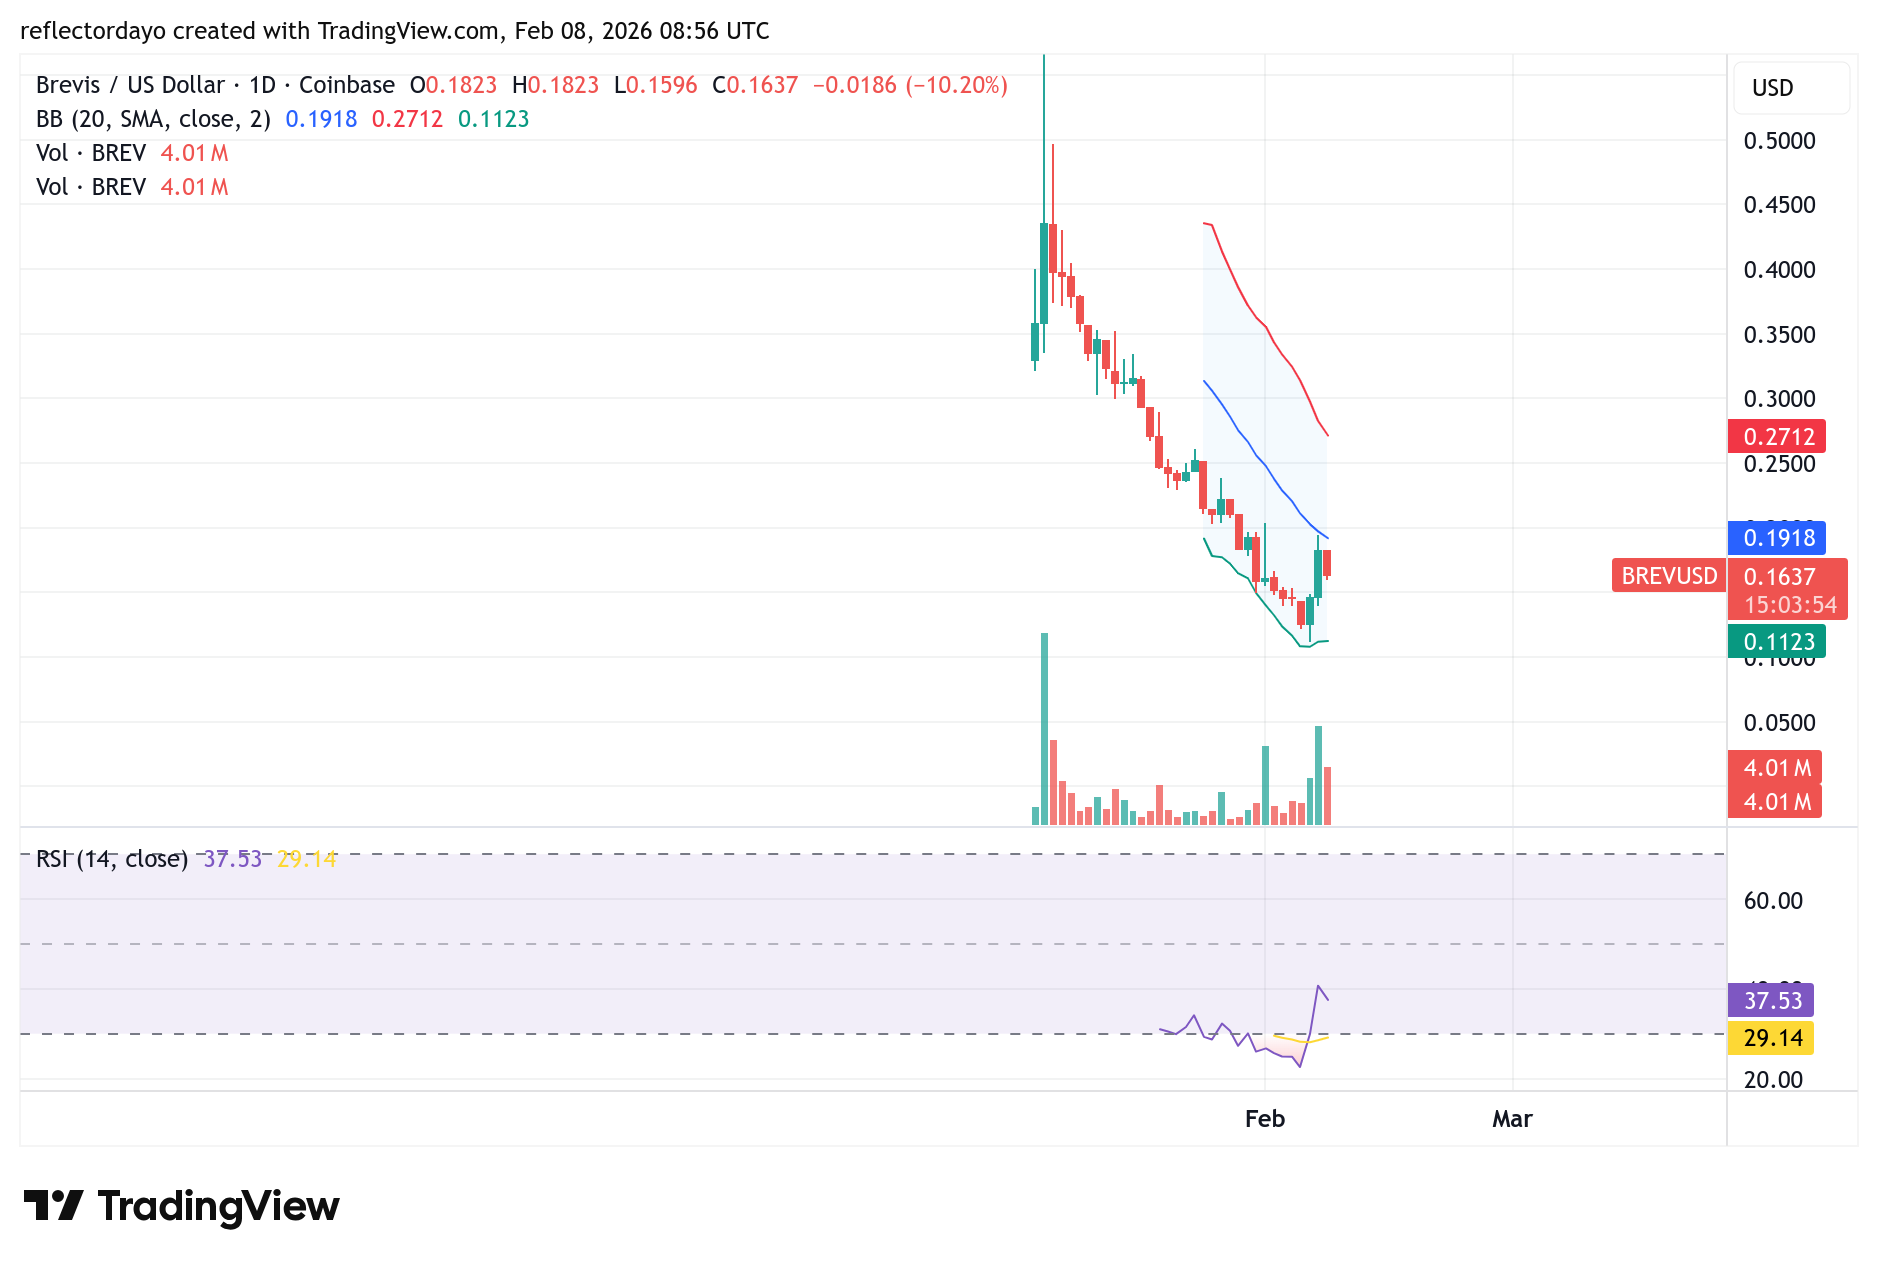
Brevis (BREV)
Major Bias: Bullish
This market is also in a bearish phase, as the chart shows a clear downward trend in price action. Another important observation is the limited historical data available, suggesting that this is a relatively new market. The available price history can be traced back to January 7.
Recently, the price found support around the $0.1123 level and rebounded above $0.15. At this stage, the market may enter a short consolidation phase to absorb the remaining bearish pressure. If this consolidation holds, it could pave the way for a potential rebound in subsequent trading sessions.
Current Price: $0.247
Market Capitalization: $69 million
Trading Volume: $138 million
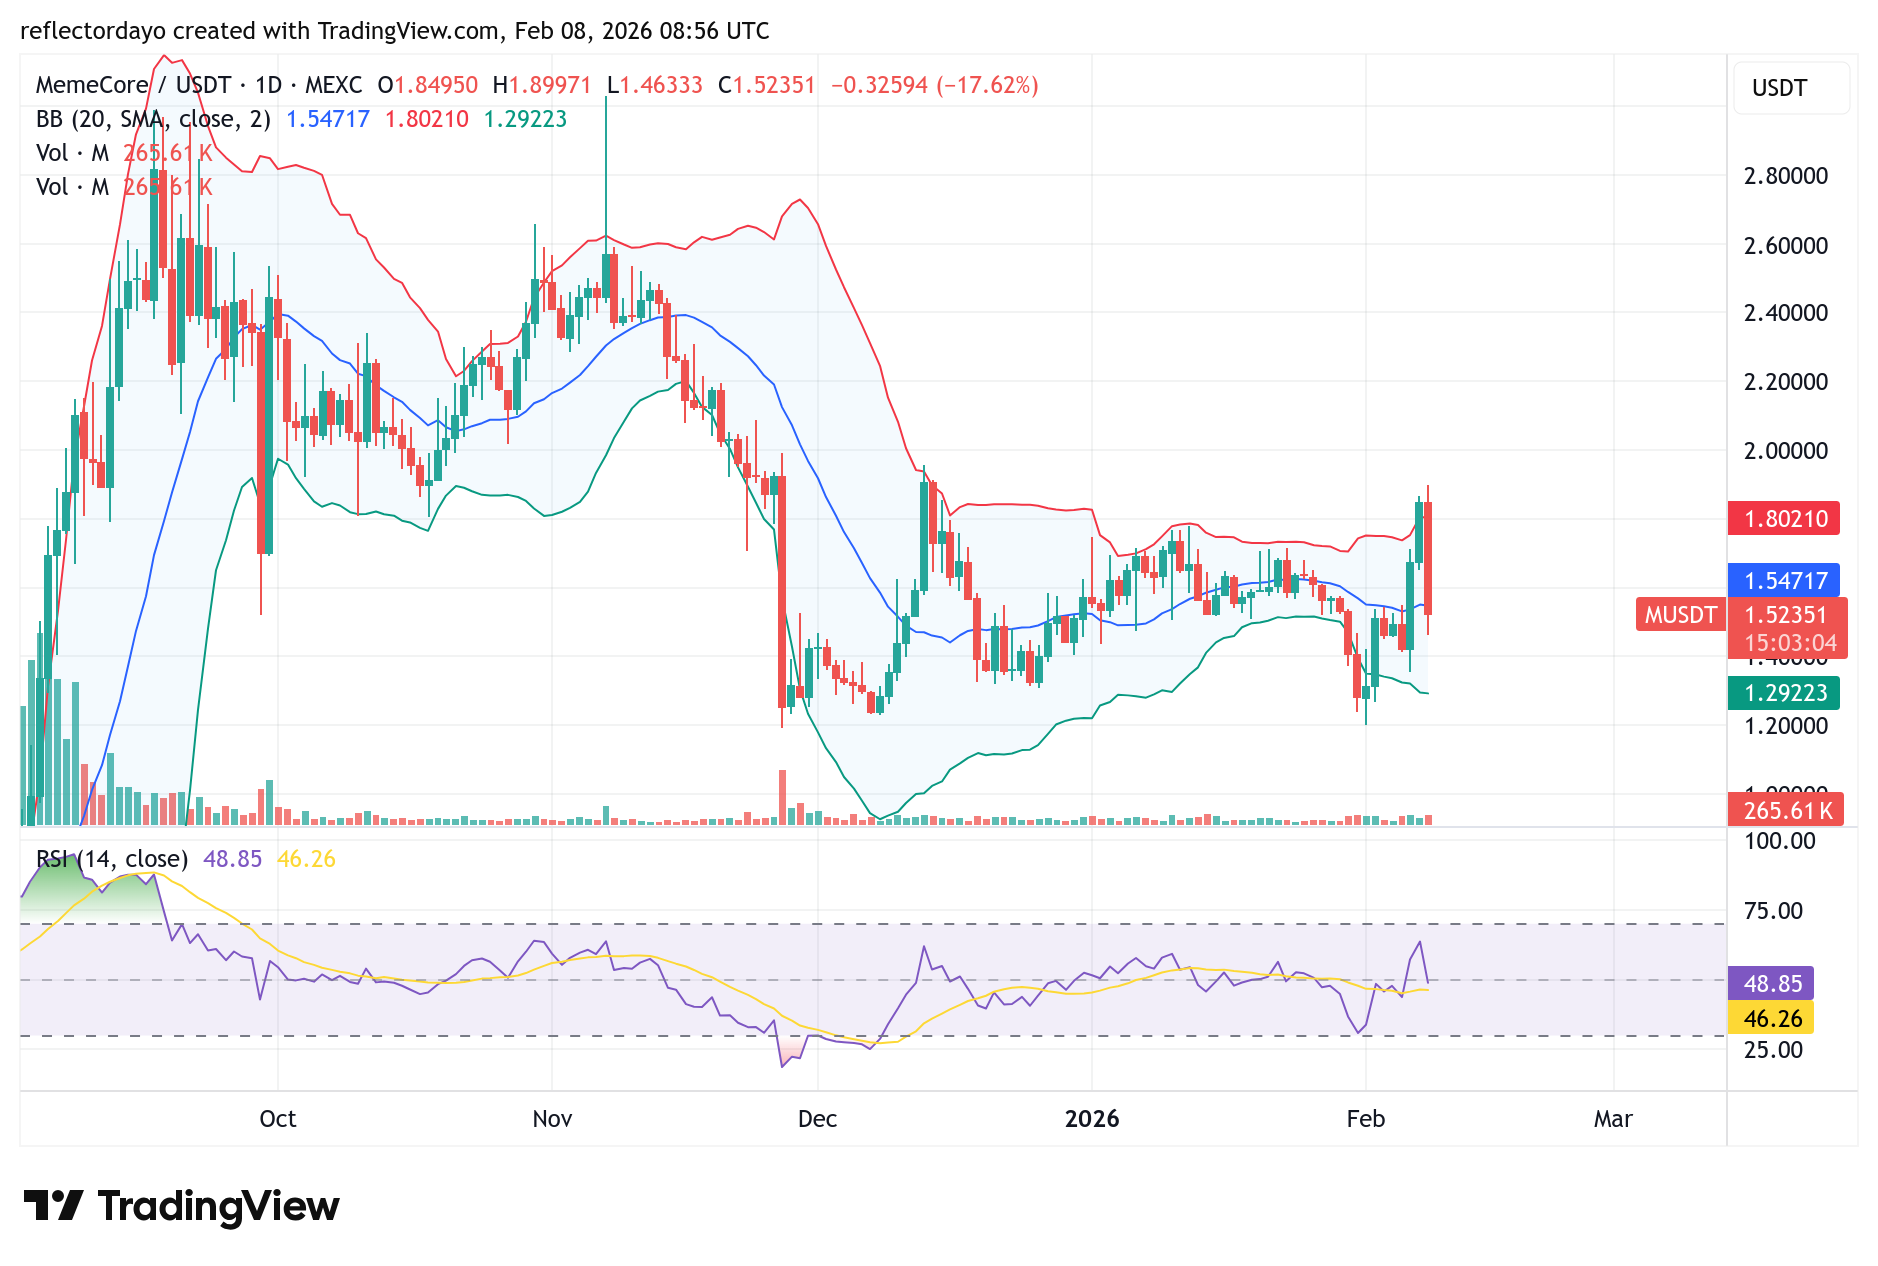
MemeCore (M)
Major Bias: Bullish
In the fifth position is the MemeCore market. This asset likely earned its spot due to the sharp price swings observed between yesterday and today. Over the past 24 hours, the price surged and briefly broke above the $1.80 resistance level.
However, the market failed to sustain movement above this level, as the profit-taking that followed erased much of the bullish momentum. As a result, price action retreated to around the $1.55 level, which is the zone where the market had previously been consolidating.
The market has now returned to a consolidation phase, with the Relative Strength Index (RSI) moving back toward the midpoint of the indicator. Despite the pullback, the brief spike to the $1.80 level could be an early signal that the market is building momentum for a larger move, potentially to the upside.
Tether has strengthened its push into stablecoin payments infrastructure by making a strategic investment in the t-0 network, a payments platform designed to support near-instant international transfers for banks and fintech firms. The companies disclosed that the funding was intended to accelerate the development of a system that allows cross-border fiat payments to be settled using stablecoins, though they did not reveal the financial size or valuation of the deal.
According to information shared with Bitcoin.com News, t-0 network was developed as a private, institution-focused platform that connects regulated financial entities through a single application programming interface. The system is structured to simplify international transfers while lowering operational friction commonly associated with traditional correspondent banking.
How the t-0 Network Uses Stablecoin Payments
The company explained that the t-0 network coordinates fiat-to-fiat transactions across borders by recording payment instructions on a shared global ledger. Meanwhile, this ledger is used to match transactions between counterparties before settling only the final net balances. Hence, each participant is able to send and receive funds in their domestic currency, reducing exposure to foreign exchange volatility.
The platform was designed to minimize the need for pre-funded accounts and idle capital. Settlement is carried out on a non-custodial basis, with on-chain transfers occurring solely between licensed and regulated partners. To this end, USDT will be used as the settlement asset, with Tether stating that its liquidity and global circulation make it suitable for institutional payment flows, which require speed and transparency.
Tether’s Broader Strategy for Cross-Border Stablecoin Adoption
James Brownlee, the chief executive officer of t-0 network, stated that the platform was built to support seamless global economic connectivity. He explained that the goal was to enable institutions to move value across borders as efficiently as data moves online.
Paolo Ardoino, Tether’s chief executive officer, said the company viewed payments infrastructure as one of the most practical real-world applications for stablecoins. He noted that the t-0 network addressed long-standing issues in international payments by combining real-time settlement, lower costs, and improved cross-border transaction transparency.
Put together, Tether added that this investment aligned with its broader effort to support regulated financial institutions seeking modern alternatives to legacy payment rails.
The government of Vietnam is taking a transformative step toward regulating digital assets. The country plans to advance a Vietnam crypto tax pilot designed to formalize a rapidly growing market.
According to a report by Vietnam Investment Review (VIR), policymakers have proposed a new tax framework that would apply to cryptocurrency transactions conducted on licensed platforms. As it stands, officials were reported as saying the aim is to increase transparency, strengthen oversight, and guide investor behavior without discouraging participation.
Vietnam Crypto Tax Pilot Introduces Simple Rules for Retail Traders
Under the draft plan, individuals trading cryptocurrencies would be required to pay a 0.1% personal income tax on the absolute value of each exchange. VIR reported that this tax would apply regardless of whether a trader records a profit or a loss. Authorities explained that the approach mirrors Vietnam’s current stock market tax system, favoring ease of collection over complex profit calculations.
Furthermore, the report has it that crypto transactions would be exempt from value-added tax due to their financial product status. To this, officials were quoted as saying this exemption is meant to prevent double taxation and reduce administrative burdens.
New Crypto Tax Policy, Higher Bar for Institutions
Institutional investors would face different treatment under the Vietnam crypto tax pilot. It was stated that companies generating income from crypto transfers would reportedly be subject to a 20% corporate income levy based on net profits. As it stands, this calculation would allow deductions for acquisition costs and directly related expenses, including transaction fees. Regulators were reported as arguing that institutions possess stronger accounting capacity and should therefore be taxed under a more detailed framework.
The tax proposal operates within a broader five-year pilot program launched in September 2025. VIR stated that participation is limited to licensed exchanges that must meet strict requirements. This includes a minimum charter capital of 10 trillion Vietnamese dong and a foreign ownership ceiling of 49%. All trades would also be settled in the local currency.
To this end, policymakers were reported as saying that feedback will guide final adjustments before adoption. If implemented, analysts believe the framework could position Vietnam as one of Southeast Asia’s most structured crypto markets.
Bitcoin has once again reminded traders why volatility defines the crypto market. After sliding hard toward the $60,000 region, the world’s largest cryptocurrency rebounded aggressively, recovering more than $10,000 in less than 24 hours and briefly pushing above $71,000.
The sudden turnaround follows a brutal period of selling pressure that rattled both retail and institutional participants. Within a week, BTC had erased a significant portion of its recent gains, triggering widespread liquidations and panic-driven exits. However, the latest bounce suggests buyers were waiting at lower levels, ready to step in once selling momentum slowed.
Market Volatility Takes Center Stage
Bitcoin’s price action over the past day highlights how quickly sentiment can shift. The drop toward $60,000 flushed out leveraged positions, while the rebound forced short sellers to cover, accelerating the upside move. As BTC climbed, confidence returned across the broader crypto market.
Altcoins reacted even more strongly. XRP recorded double-digit daily gains, outperforming most large-cap assets, while Ethereum climbed back above the key $2,000 psychological level. As a result, the total cryptocurrency market capitalization expanded by roughly $200 billion from its recent lows.
What’s Driving Bitcoin’s Sudden Recovery
The video below explains how market sentiment, positioning, and macro-related expectations contributed to Bitcoin’s rapid rebound after the sharp decline.
This analysis helps put the rebound into perspective, showing why sharp recoveries often follow aggressive sell-offs in high-volatility markets like crypto.
Liquidations and What Comes Next
Despite the recovery, liquidation data shows the damage isn’t fully undone. Billions of dollars’ worth of positions were wiped out during the downturn, mostly from long traders caught on the wrong side of the move. Over the past several hours, however, short liquidations have increased as prices pushed higher, adding fuel to the rebound.
Still, analysts warn that Bitcoin’s path forward may remain uneven. Key resistance levels lie ahead, and sustained upside will likely depend on broader risk sentiment and incoming macro signals.
For now, Bitcoin’s swift rebound reinforces a familiar lesson: sharp declines in crypto are often followed by equally sharp recoveries — but volatility remains the price of participation.
USAT is Tether’s stablecoin variant planned to operate under U.S. government regulation. It is designed to align with the GENIUS Act. Unlike USDT, which has gained most of its traction in emerging markets, USAT targets businesses in the United States as well as organizations seeking a regulated digital version of the U.S. dollar.
Tether has long positioned itself as a pioneer in the stablecoin sector, with USDT serving as a foundational pillar of the digital economy for nearly a decade. Today, USDT supports more than 500 million users worldwide and boasts a market capitalization exceeding $169 billion, making it the most widely used stablecoin globally.
Key Features of USAT
The newly introduced stablecoin brings several defining attributes that distinguish it from existing alternatives:
Comprehensive U.S. Regulatory Alignment:
USAT is structured to fully comply with the recently enacted GENIUS Act, a landmark piece of U.S. legislation regulating stablecoin issuance. This represents a significant step toward aligning digital asset innovation with America’s established financial regulatory framework.
Institutional-Centric Design:
Unlike retail-focused stablecoins, USAT is built specifically for enterprises and institutional participants. It offers a modern digital alternative to traditional payment systems, enhanced by stronger governance, oversight, and transparency.
Robust Technology Infrastructure:
USAT is powered by Tether’s Hadron tokenization platform, an advanced system engineered for real-world asset tokenization and tailored to institutional-grade operational requirements.
What It Means for the Market and Competitive Landscape
USAT is entering a fast-paced stablecoin market characterized by strong growth and rising institutional adoption. As of September 2025, the total stablecoin market capitalization had reached approximately $208 billion.
Positioned Against Competitors
While USDC remains the primary U.S.-focused stablecoin, holding roughly $72 billion in market capitalization, USAT leverages Tether’s unparalleled global reach and operational expertise. The organization’s hands-on experience serving over 500 million users worldwide provides a significant competitive advantage.
Institutional Adoption Trends
Stablecoins hold the potential to usher in a new era of programmable digital money, although significant challenges remain. Scaling next-generation payment systems requires building trust among buyers, sellers, payers, and recipients across global markets.
Nonetheless, institutional momentum continues to accelerate. The stablecoin sector is seeing increased participation from major financial institutions, many of which are launching proprietary stablecoin solutions or integrating stablecoin capabilities into their existing financial infrastructure.
Economic Impact and Dollar Dominance Strategy
Tether’s expansion into the U.S. market aligns with broader strategic goals aimed at preserving the dominance of the U.S. dollar in an increasingly digital financial landscape. Notably, the Group ranks as the 18th-largest holder of U.S. Treasury securities worldwide, surpassing holdings by countries such as Germany, South Korea, and Australia.
Supporting U.S. Treasury Markets
Through its substantial Treasury reserves, Tether contributes to liquidity in U.S. debt markets while generating revenue that supports stablecoin operations. This approach creates alignment between private-sector incentives and public policy objectives focused on strengthening the U.S. dollar.
Cross-Border Payment Innovation
USAT enables faster and more cost-effective cross-border transactions while remaining fully compliant with regulatory requirements. This capability has the potential to reduce reliance on traditional correspondent banking systems and significantly improve international payment efficiency.
Ecosystem and Technological Advantages
As a stablecoin designed to integrate with advanced financial frameworks such as Eco, USAT presents strong opportunities for ecosystem integration and enhanced user experiences. Its regulated nature makes it particularly attractive to institutional clients seeking compliance certainty.
Interchain Operability
USAT features a technical framework that supports interchain deployment, enabling seamless integration across multiple blockchain networks while maintaining regulatory compliance across jurisdictions.
Programmable Money
USAT includes programmable functionality that enables automated compliance, instant settlement, and integration with smart contracts to support complex financial workflows.
Future Outlook and Market Projections
Analysts anticipate strong growth in the regulated stablecoin sector. According to U.S. Treasury Secretary Scott Bessent, the domestic stablecoin market could expand nearly eightfold, potentially exceeding $2 trillion in value over the coming years.
Expected Launch Timeline
Although Tether has not announced an official release date, regulatory preparation, compliance approvals, and system integration typically require several months. As a result, industry observers expect USAT to launch within a six- to twelve-month timeframe.
Growth and Scaling Potential
By leveraging Tether’s extensive global footprint and strong institutional relationships, USAT is well positioned to achieve rapid adoption among U.S.-based enterprises and financial institutions seeking compliant digital dollar solutions.
Integration Within the Stablecoin Ecosystem
Platforms focused on stablecoin infrastructure, cross-chain compatibility, and payment technology are expected to benefit from USAT’s introduction. Its regulated framework enhances institutional trust, while its technical flexibility supports the development of innovative financial products and services.
Risks and Implementation Challenges
Despite its regulatory alignment, USAT must still navigate a range of operational, market, and adoption-related challenges that could impact its rollout and long-term performance.