API3 Market (API3/USD): Bullish Recovery Faces a Major Test

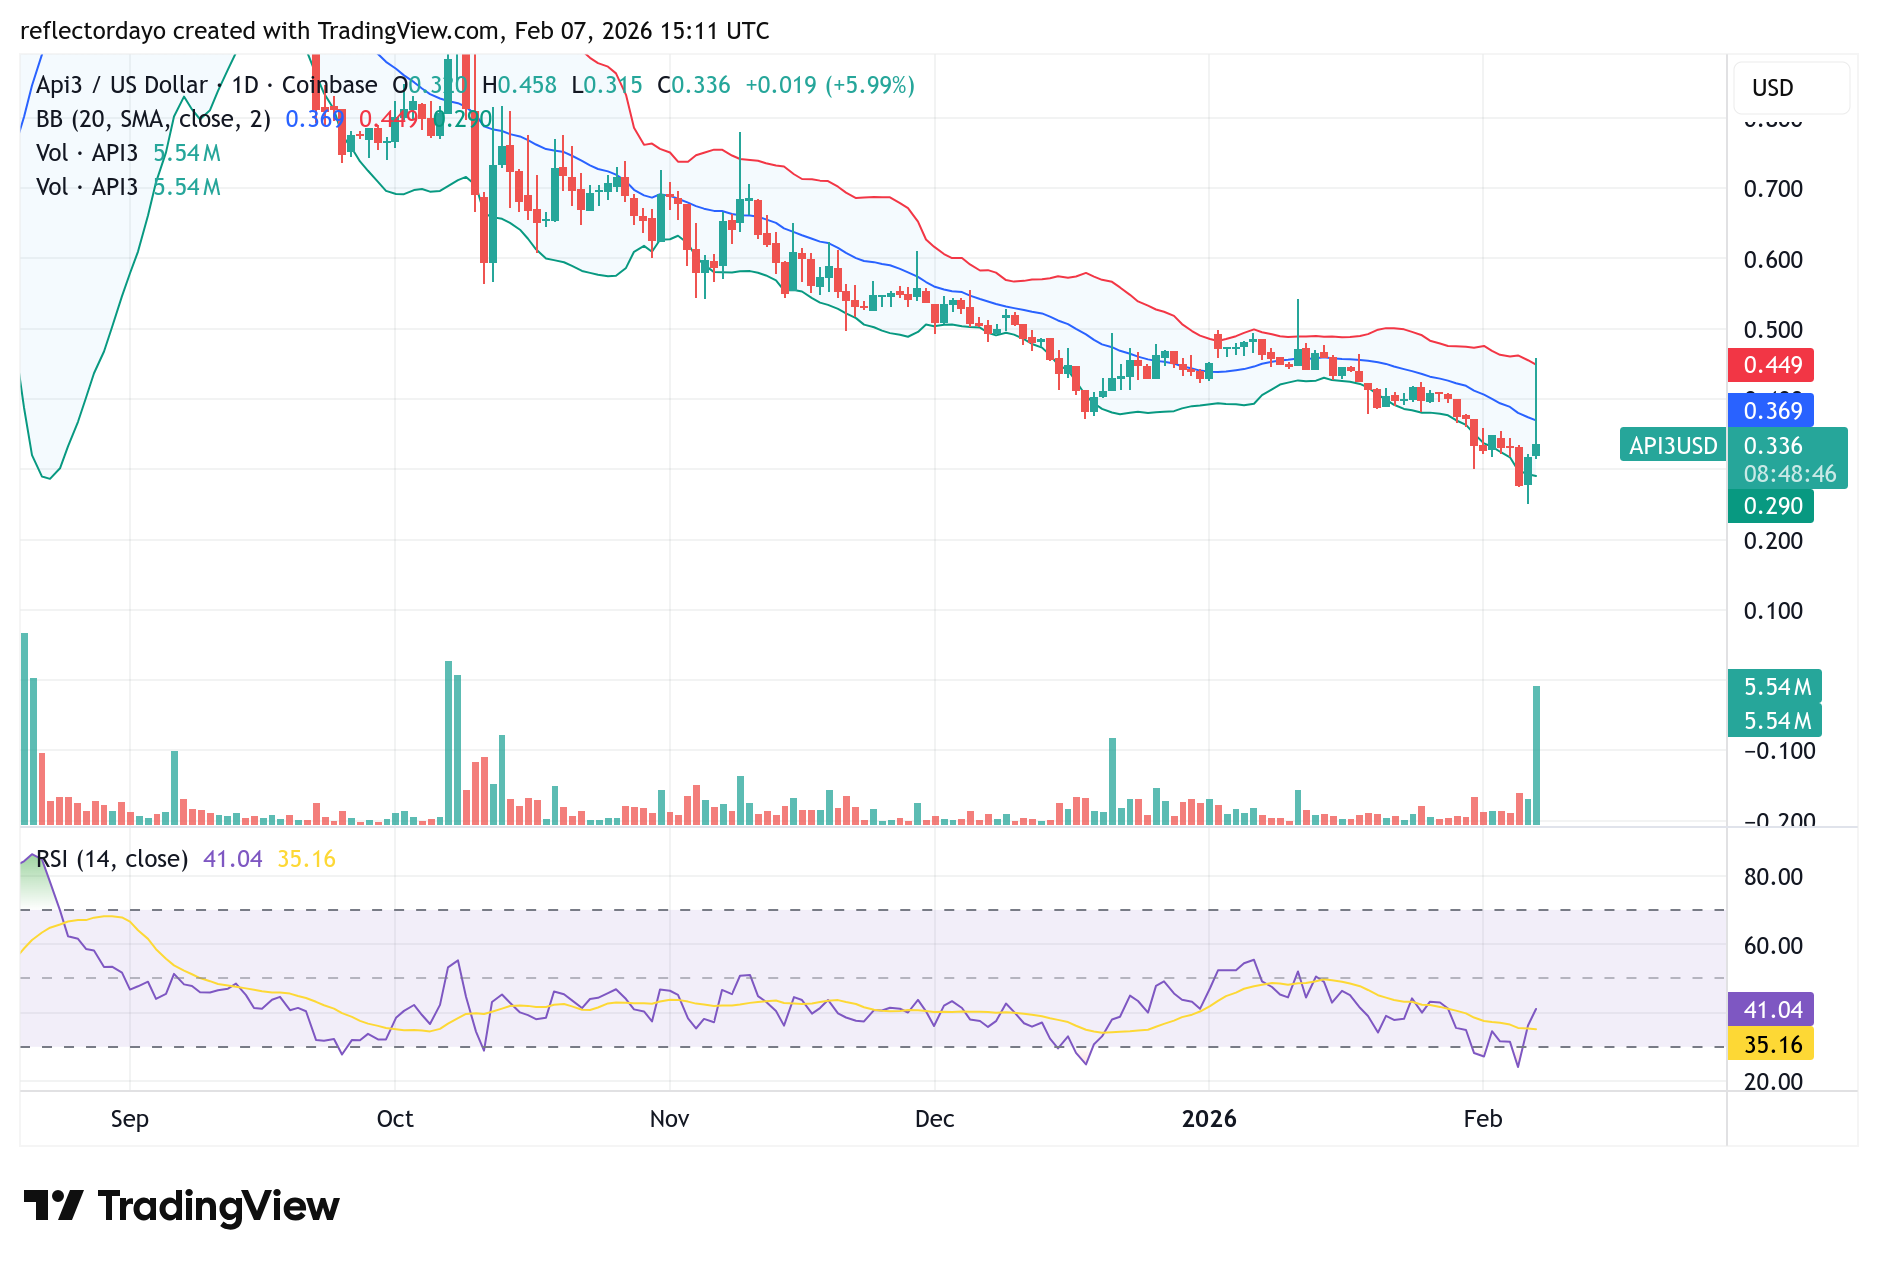
The API3 market is attempting to shift overall market structure as a bullish recovery emerges from the pivotal $0.26 support level. This rebound marks a potential change in market direction after the recent bearish phase. Price action has now advanced toward the $0.33–$0.35 zone, which represents the next key resistance area.

Currently, API3 is trading around $0.347, placing this resistance firmly in focus. A decisive breakout above this level would likely confirm bullish continuation, while rejection could signal renewed consolidation or a pullback. As a result, this price zone is expected to determine the market’s next directional move.

API3 Market (API3/USD) Market Data

  • API3/USD Price Now: $0.33
  • API3/USD Market Capitalization: $29 million
  • API3/USD Circulating Supply: 86.4 million API3
  • API3/USD Total Supply: 159.7 million API3
  • API3/USD CoinMarketCap Ranking: #564

API3 Surges 37% as Buyers Regain Short-Term Control

API3 has emerged as one of the standout performers in the market, posting an impressive 37% gain within a single trading session and pushing the price toward the $0.37 level. The sharp rally reflects a notable shift in short-term sentiment, driven by aggressive buying activity, rising trading volume, and renewed trader interest as the token broke above its recent range. With API3 appearing on top gainers’ lists, increased visibility has attracted momentum and swing traders, further reinforcing the move. While the surge highlights strong demand and improving market confidence, it also introduces heightened volatility as traders begin to weigh profit-taking against continued upside potential.

Key Levels to Monitor

  • Resistance: $0.40, $0.45, $0.50
  • Support: $0.3, $0.15, $0.10

API3 Market (API3/USD): Bullish Recovery Faces a Major Test

API3 Market Analysis: Technical Viewpoint

The API3 market is currently undergoing a bullish recovery and has recorded a gain of approximately 12% over the past 24 hours. This move reflects renewed bullish commitment and suggests that buyers are stepping in with increased conviction, supported by a noticeable inflow of liquidity that has improved market sentiment.

Despite this positive momentum, the recovery is now facing a critical test near the $0.347 price level. While capital inflows remain evident, a lingering presence of bearish pressure has kept price action constrained around this zone. As the crypto signal continues to hover near $0.347, a sustained move above or below this level is likely to determine the next directional phase for API3.

API3 Market (API3/USD): Bullish Recovery Faces a Major Test

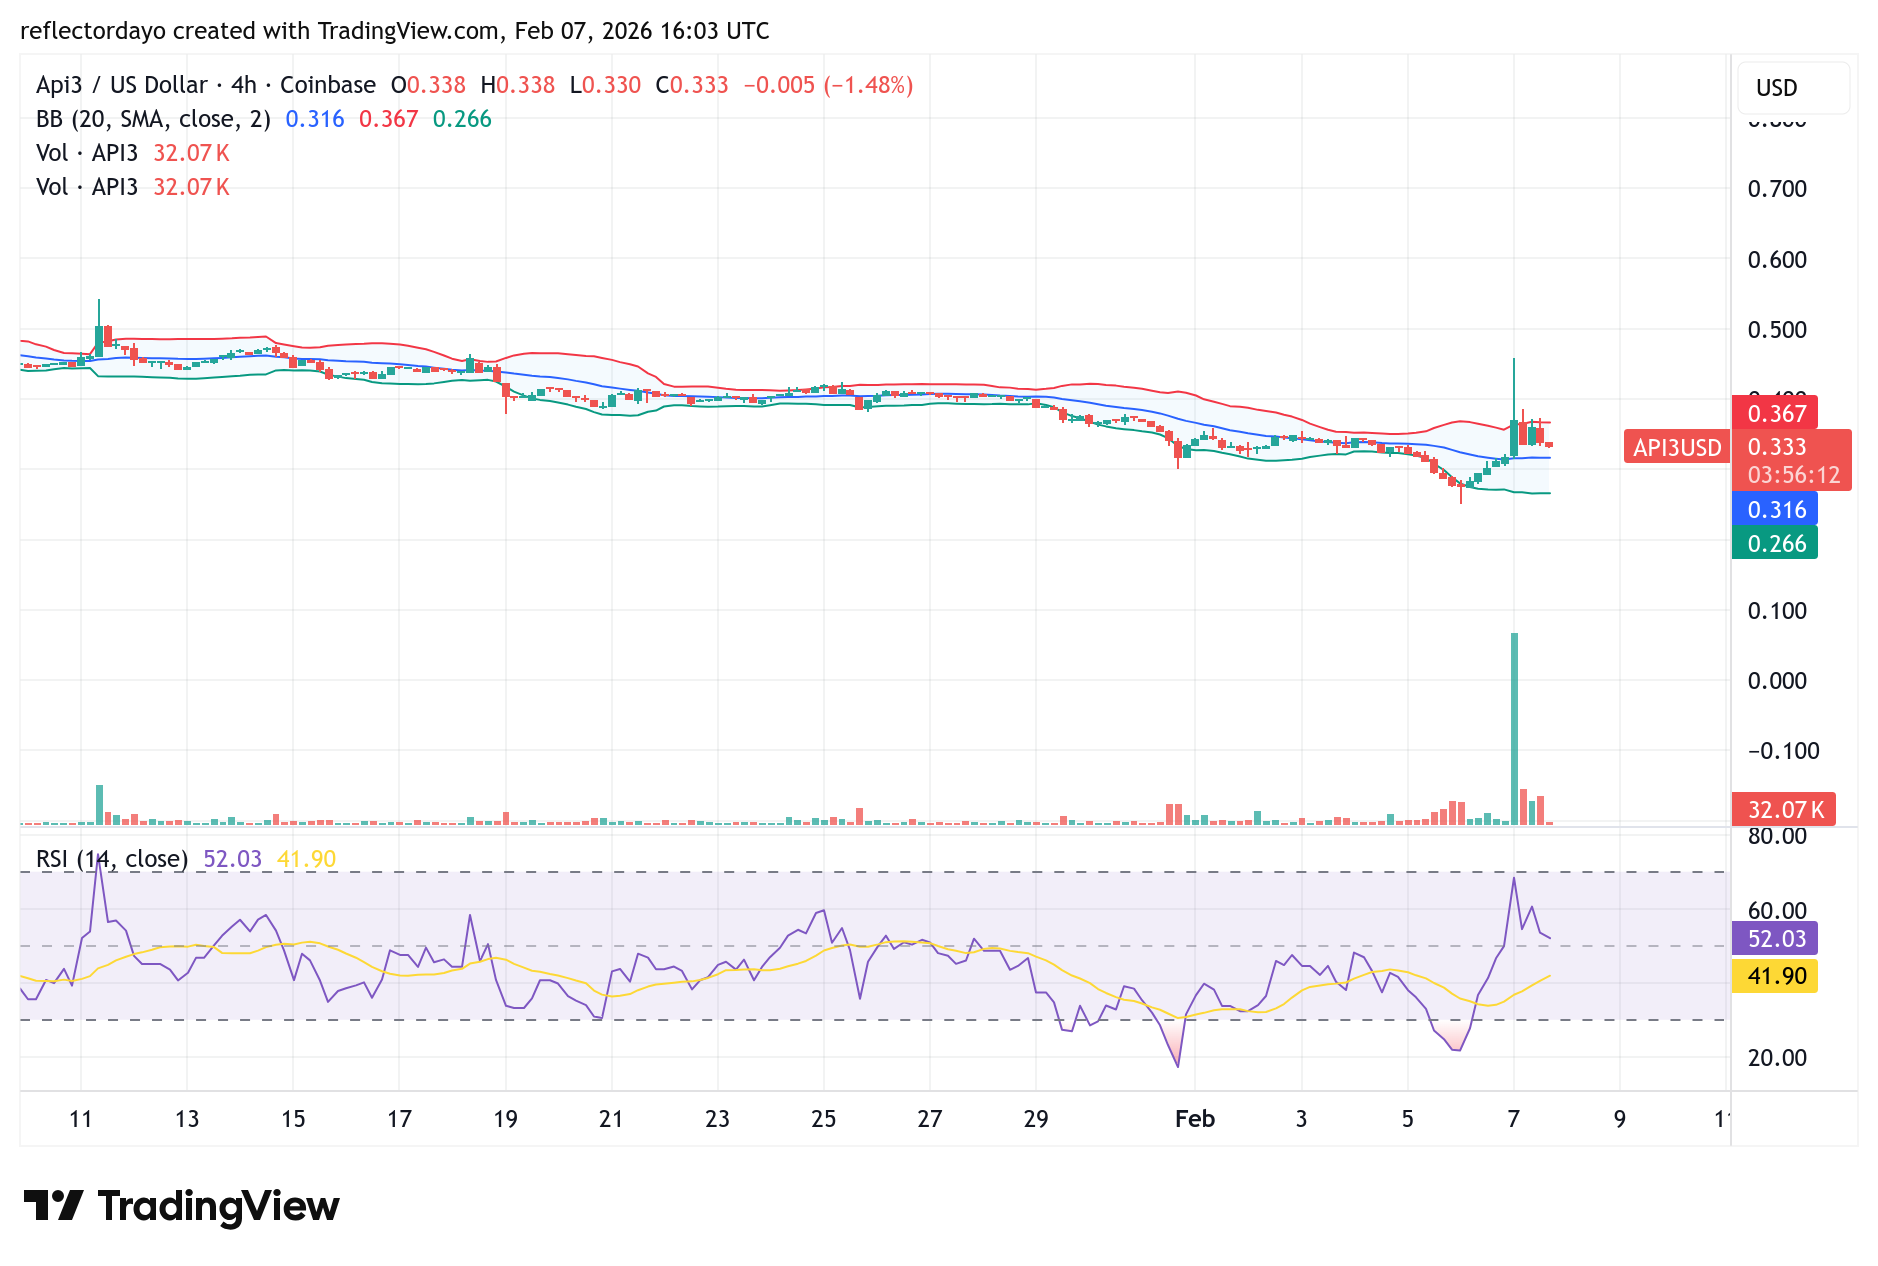
API3/USD 4-Hour Chart Outlook

Zooming into the 4-hour timeframe, price action shows attempts to establish a higher support level around the $0.33 zone. Over the course of today’s trading sessions, multiple bearish rejections have occurred at this level, reinforcing its significance as support if it continues to hold.

Earlier today, the first 4-hour candle printed a strong bullish move, driven by aggressive buying activity, which highlights notable conviction from buyers. However, this initial surge has since transitioned into a period of consolidation, as bulls and bears compete for control.

At this stage, two key price levels are in focus: $0.33 as immediate support and $0.347 as overhead resistance. A decisive break above or below either of these levels is likely to define the market’s next directional move.

Trade crypto coins on BYBIT

Solana (SOL) Price Prediction: SOL/USDT Steep Decline Faces Rejection

Date: February 7, 2026

The most recent price candle shows a notable rebound during the previous session. However, the market remains broadly influenced by bearish sentiment.

Long-Term Trend — Bearish (Daily Chart)

Key Price Levels

Resistance: $90, $95, $100

Support: $80, $75, $70

Solana (SOL) Price Prediction: SOL/USDT Steep Decline Faces Rejection

The Solana market recorded an upward rebound in the previous session. However, the ongoing session has shown a pullback below the prior session’s close, keeping price action below the 9-day Exponential Moving Average (EMA). Meanwhile, the Stochastic Relative Strength Index (SRSI) lines continue to trend upward.

Solana (SOL) Price Prediction: SOL May Lack Strong Upward Momentum

The Solana market experienced a notable pullback in the previous session, and the ongoing session has extended this downward movement. As a result, price action remains below the 9-day EMA curve.

At the same time, the SRSI lines continue to move upward from within the oversold region, creating a mixed market outlook. Nevertheless, price remains above the opening level of the previous session, suggesting some underlying support.

Solana (SOL) Price Prediction: SOL/USDT Consolidates Around the 9-Day EMA (4-Hour Chart)

On the 4-hour chart, the most recent candle suggests that bulls are attempting to defend current levels. Price action is trading just above the 9-day EMA curve.

Solana (SOL) Price Prediction: SOL/USDT Steep Decline Faces Rejection

Meanwhile, the SRSI lines are in the overbought region but have begun to slope slightly downward, indicating a potential short-term pause. As a result, short-term trading opportunities may emerge toward the $90 resistance level.

Get Solana (SOL) here. Buy SOL 

Cardano Price Hovers Around a Critical Level: What’s the Next Move?

Over the last 24 hours, Cardano against Tether has risen over 2% to $0.26691. This move mirrors a macro-driven recovery in traditional assets as the Cardano price perfectly correlates with the S&P 500 and Gold, climbing from increased market liquidity and its strong beta to Bitcoin. As it stands, the positive social sentiment and Fibonacci support further fueled this bounce.

To this end, future momentum depends on Bitcoin staying above $67,500, as the direction of the token will depend on the ability to stand above or below the immediate support level.

Currently, Cardano trades at $0.2673 with more than 180.34 million traded volumes on the daily timeframe.

Cardano Price Hovers Around a Critical Level: What's the Next Move?
ADAUSDT – daily Chart

Technical Indicators

Major Resistance Levels: $0.3000, $0.3580, and $0.4050

Major Support Levels: $0.2450, $0.2000, and $0.1500

Technical Analysis

Cardano against Tether on the daily chart in recent times has been moving cent by cent to the south as the price action displays successive breaks below support levels since the beginning of 2026. As it stands, the Cardano price operates above $0.2475, where the lower Bollinger band is located. Though this indicates extensive sell pressure, as the Bollinger Bands show no direction different from the previous move. However, recent price action suggests the bulls are ready to contest the $0.300 upper level.

From another angle, the Stochastic RSI beneath the chart is still operating with the 15-to-40-mark level, suggesting an impending proper breakout signal to the upside as the blue line holds and breaks above the orange line. To this end, without a strong bullish crossover and a break above $0.300, the current trend may continue.

Cardano Price Elliott Wave Breakdown: ADA’s Next Move

Analysis for Cardano in recent times has identified three primary Elliott Wave scenarios following the September 2023 lows. One is the orange scenario, which suggests a direct bullish rally toward all-time highs, but this condition remains unconfirmed. Similarly, in the white scenario, the former anticipated a corrective fourth-wave bounce toward resistance between $0.419 and $0.623.

As it stands on a local level, ADA must secure a five-wave advance and break above $0.305 to confirm a bottom. Meanwhile, current price action shows only a three-wave move, signaling caution as another low remains possible, with $0.2400 standing as the next dynamic supportive limit.

ADA/USDT Analysis: Bullish Crossover; What’s Next?

From the shorter timeframe, ADA/USDT seems to be full of optimism and encouraging bullish actions. Cardano price on the 4-hour chart appears to be gearing up for more gains as the Bollinger band expands with increasing volume.

Meanwhile, the momentum oscillator appears to be overbought, with the blue line dropping back from the overbought region. However, despite these recent developments, moving to the north will need a break above the $0.300 dynamic resistance. Conversely, a break below the immediate support will signal another short-term low before any recovery.

Cardano Price Hovers Around a Critical Level: What's the Next Move?
ADAUSDT – 4H Chart


You can purchase crypto coins here. Buy Crypto

POL (Prev. MATIC) Price Prediction: POL/USDT Breaks Out to the Downside

Date: February 7, 2026

The POL (Prev. MATIC) market had been perceived as edging closer to a breakout while trading within a symmetrical triangle pattern. However, this setup proved risky, as the market eventually resolved in a bearish breakout. More details are provided below.

POL/USDT Long-Term Trend — Bearish (Daily Chart)

Key Price Levels

Resistance: $0.0950, $0.1150, $0.1300

Support: $0.0900, $0.0850, $0.0800

POL (Prev. MATIC) Price Prediction: POL/USDT Breaks Out to the Downside

As previously anticipated, the POL (Prev. MATIC) market has broken out. However, the breakout occurred to the downside. As a result, the current session is trading below the lower boundary of the symmetrical triangle pattern. Consequently, price action remains below the 9-day Exponential Moving Average (EMA). In addition, the Stochastic RSI (SRSI) lines continue to trend downward into the oversold region.

POL/USDT Price Prediction: POL (Prev. MATIC) Bears Stay in Control (Daily Chart)

On the daily chart for POL (Prev. MATIC), price action continues to trend lower. The most recent daily candle remains bearish and is positioned below the opening price of the previous session, reinforcing the broader bearish outlook.

Meanwhile, the SRSI indicator lines remain directed toward the oversold region, suggesting that bearish momentum is still dominant.

POL/USDT Price Prediction: POL (Prev. MATIC) Bulls Appear Constrained (4-Hour Chart)

On the 4-hour chart, POL (Prev. MATIC) shows attempts to recover from bearish sentiment, but these efforts appear to have been rejected. The latest candle in the ongoing session is a small bullish one, reflecting only limited upside movement.

POL (Prev. MATIC) Price Prediction: POL/USDT Breaks Out to the Downside

Price action continues to trade below the 9-day EMA curve, while the SRSI lines are edging slightly higher. However, resistance remains strong, and price may move toward the $0.0925 and $0.0900 support levels.

Get POL (prev. MATIC) here. Buy POL 

HEX Trust Expands XRP Institutional Utility Despite Weakened Price

XRP institutional utility continues to receive strength even as the token’s market value remains under severe selling pressure. As it stands, investors are reacting emotionally to recent price weakness; meanwhile, core developments suggest growing confidence beneath the surface.

On Feb. 5, Hex Trust, a regulated digital asset services firm based in Hong Kong, announced that it had widened its collaboration with Flare to support institutional access to FLR staking and FXRP minting.

To this end, this move highlights a widening gap between cautious market sentiment and accelerating infrastructure growth around XRP institutional utility.

XRP Institutional Utility Gains Through Hex Trust and Flare

Hex Trust reported that the expanded partnership formally positions the company as a key institutional entry point into the Flare ecosystem. According to the announcement, the arrangement allows professional investors to engage in native FLR staking while also minting FXRP, which is described as a non-custodial, one-to-one representation of XRP on Flare.

HEX Trust Expands XRP Institutional Utility Despite Weakened Price

The firm explained that the service is already active for institutional clients and supports both minting and redemption of FXRP. These functions, it noted, are essential to Flare’s economic structure because they transform idle assets into productive tools. Giorgia Pellizzari, Hex Trust’s chief product officer and head of custody, was reported as saying that expanding token wrapping to assets such as XRP represents a structural change. She stated that this shift enables previously static holdings to become liquid and usable collateral within the digital economy.

Market Pressure Persists Despite Regulatory Clarity

At the same time, XRP’s market performance remains restrained. The token has been trading between approximately $1.26 and $1.40 after a sharp market-wide decline erased about 16% of its market price in one session. Prices have not yet recovered to early January levels near $2.40.

Analysts attributed the weakness to broader risk-off sentiment and nearly $800 million in total liquidations across the crypto market, even in the face of the late-2025 settlement of the long-running SEC case against Ripple.

To this end, Hex Trust has further explained that institutional investors had previously avoided XRP-based decentralized finance due to hot wallet and bridging risks. Additionally, the firm stated that its custody model preserves strict control while still enabling participation in Flare’s DeFi environment, making XRP institutional utility a viable strategy.


In order to place winning trades with us via Bybit, you can open an account here.

XRP Price Prediction: Struggling Below Key Support

The price of XRP failed to hold above the key $1.60 support level after briefly consolidating around this zone. The subsequent breakdown triggered increased bearish sentiment, encouraging further sell-offs across the market. The selling pressure intensified enough to push the price decisively below the $1.50 and $1.40 support levels, reinforcing the short-term bearish outlook.

XRP Price (XRP/USD) Market Data

  • XRP/USD Price Now: $1.357
  • XRP/USD Market Capitalization: $82.9 billion
  • XRP/USD Circulating Supply: 60.91 billion XRP
  • XRP/USD Total Supply: 99.98 billion XRP
  • XRP/USD CoinMarketCap Ranking: #5

XRP Price Warning: Token Struggles Below Key Support as Market Volatility Rises

XRP is currently trading below the crucial $1.45 support zone, a level that had held firm over the past few days but has now given way under sustained bearish pressure. The breakdown comes amid rising global market uncertainty and heightened geopolitical tensions, which have weighed heavily on risk assets across the board. Over the last several hours, XRP has notably underperformed many major altcoins, raising concerns about short-term momentum. While lower timeframes hint at possible mean reversion and short-lived stabilization, the broader technical structure still lacks a convincing bullish reversal. As long as market volatility remains elevated and geopolitical risks persist, downside risks dominate the outlook. In such a scenario, XRP could retest the next notable support around the $1.25 region, with a deeper move toward the psychological $1.00 level only becoming likely if volatility spikes further. That said, modest inflows into XRP-related ETFs offer a small positive signal, suggesting that institutional interest has not entirely faded despite the challenging market conditions.

Key Levels to Monitor

  • Resistance: $1.60, $1.70, $1.80
  • Support: $1.35, $1.30, $1.25

XRP Price Prediction: Struggling Below Key Support

XRP Price Analysis: Technical Viewpoint

The indicators are signaling clear oversold market conditions. Bearish momentum remains strong, with price action continuing to press lower. Initially, the $1.60 level acted as a key support and potential rebound zone following the breakdown from the $1.80 price level.

You Should Be Worried: Growing Caution Among XRP Holders

Recent market commentary suggests that XRP holders may need to exercise increased caution. With the price trading below key support levels and bearish momentum remaining strong, short-term risks appear elevated. Unless the market sees a meaningful recovery backed by strong volume and momentum, downside pressure could continue to weigh on price action.

Technical Viewpoint (Continued)

However, the loss of the $1.60 support triggered additional selling pressure, which subsequently pushed the XRP price through the $1.50 support area as well. Notably, in October last year, bears tested the $0.80 level, and the current bearish trend could potentially retrace a similar path toward that price zone if downside pressure persists.

XRP Price Prediction: Struggling Below Key Support

XRP/USD 4-Hour Chart Outlook

Bearish momentum has remained strong, pushing technical indicators into oversold territory. Under normal market conditions, such readings would typically encourage a bullish recovery. However, selling pressure continues to dominate, with only minor corrective moves observed, suggesting that relatively few traders are responding to the oversold signals. The market is therefore showing signs of further downside risk, especially after the breakdown below the $1.50 and $1.40 support levels.

Trade crypto coins on BYBIT

Uniswap (UNI) Price Prediction: UNI/USDT Tears Down the $4.00 Baseline

Date: February 5, 2026

Bears in the Uniswap market have been on a winning streak. As a result, the market has continued to slide toward lower price levels. Even in the current session, headwinds remain dominant and may keep pushing the market further downward.

UNI/USDT Long-Term Trend — Bearish (Daily Chart)

Key Price Levels

Resistance: $4.00, $4.50, $5.00

Support: $3.50, $3.00, $2.50

Uniswap (UNI) Price Prediction: UNI/USDT Tears Down the $4.00 Baseline

The Uniswap market has continued its descent to lower price levels. In the ongoing session, bearish sentiment remains evident, as reflected by the most recent price candle on the chart. Consequently, trading remains below the 9-day Exponential Moving Average (EMA). The Stochastic Relative Strength Index (SRSI) indicator lines are also sliding deeper into the oversold region. Meanwhile, the indicator has just delivered a bearish crossover within the oversold zone.

Uniswap Price Prediction: UNI Heads Strongly South

Price activity in the Uniswap daily market has remained decisively bearish for most of the past sessions. For more than seven days, price action has steadily declined toward lower thresholds.

The market has now breached the $4.00 baseline and continues to trade with a bearish bias. With price action staying below the 9-day EMA curve, the market may extend its decline toward even lower levels. The behavior of the SRSI indicator further suggests renewed bearish momentum following its recent downward crossover.

Uniswap Price Prediction: UNI/USDT May Touch Down at the $3.50 Level (4-Hour Chart)

Even on the 4-hour chart, the Uniswap market continues to trend southward. The most recent price candle maintains a bearish posture and remains below the 9-day EMA curve. This caps upside momentum and reinforces bearish sentiment.

Uniswap (UNI) Price Prediction: UNI/USDT Tears Down the $4.00 Baseline

Furthermore, the SRSI indicator lines have just delivered a downward crossover, with the subsequent movement maintaining a southward trajectory. Consequently, traders may increasingly favor bearish positions targeting the $3.50 and $3.00 price levels.

Get Uniswap (UNI) here. Buy UNI

Ethereum Price, Transfer Activities, and Elliot Wave Pattern

Recently, the market for Ethereum has witnessed a huge fall. In under 24 hours, the Ethereum price has plummeted over 7%, crashing to $2,111 as a broad sell-off hits the crypto market.

Meanwhile, analysts are of the opinion that Ethereum may have the chance to gain upside traction if Bitcoin regains its position above $70k despite the correlation with the Nasdaq-100 and a massive liquidation of leveraged positions.

Currently, Ethereum trades at $2,097.60 with over 508.14k traded volumes on the daily timeframe.

Ethereum Price, Transfer Activities, and Elliot Wave Pattern
ETHUSDT – Daily Chart

Technical Indicators

Major Resistance Levels: $2,111, $2,250, and $2,400

Major Support Levels: $2,000, $1,800, and $1,650

High Ethereum Transfer Activity Signals Potential Peak

According to the post by @CoinGapemedia on X moments ago, it was revealed that data sourced from Cryptoquant shows that Ethereum’s transfer activity has increased massively above its 14-day Simple Moving Averages (SMA) of 1.17 million. By implication, this development suggests activities in 2018 and 2021 are about to recur as selling pressure intensifies.

Technical Analysis

Technically, Ethereum against Tether on the daily timeframe presents a waterfall view. The Ethereum price has failed to stabilize above $2,100 as a lack of buying volume pushes it near $2,000.

On one side, Ethereum has drifted below the SMA, and for recovery to be confirmed, the $2,242 level must be reclaimed.

On the other hand, the Stochastic RSI suggests the bears are in control, as fundamentals suggest increasing Ethereum transfers in recent times. To this end, the $1,800 is the only stronghold for a turnaround to occur.

Ethereum Elliot Wave Update

Ethereum is currently declining, but expectations around $2,250 in the coming sessions are high. However, it appears that the token may crash towards $1,818 with the formation of a bullish divergence on the 4-hour chart.

Additionally, for a five-wave impulsive move to be confirmed, $2,400 must be broken. Meanwhile, at the time of writing, Ethereum underperforms Bitcoin. This suggests the token is a high-risk investment until the formation of higher highs is seen.

ETH/USDT Analysis: Intraday Ethereum Price Volatility and Oversold Signals

On the 4-hour chart, Ethereum price exhibits the same view as the daily, with the price operating under the formed dynamic resistance of the SMA. Meanwhile, activities beneath the chart suggest tides may be changing. The indicator suggests ETH/USDT may be oversold, and a move to the north may be spotted soon.

To this end, the $2,250 resistance must be clear for a sustained upside push. Meanwhile, if this level is not reclaimed, sell pressure as a result of increasing ETH transfers may shift the price further downward.

Ethereum Price, Transfer Activities, and Elliot Wave Pattern
ETHUSDT – 4H Chart


You can purchase crypto coins here. Buy Crypto


Fidelity Stablecoin FIDD Signals a New Era of Trust in Digital Dollars

Fidelity Investments has taken a major step into blockchain finance with the launch of its own dollar-backed digital currency, an event that reflects growing confidence in regulated digital assets. On Feb. 4, the firm announced the release of the Fidelity stablecoin FIDD, formally known as the Fidelity Digital Dollar.

According to Fidelity, the USD-pegged stablecoin on Ethereum was created to provide users with a secure and reliable digital form of cash, supported by the company’s long-standing reputation and regulatory compliance. The move has drawn attention because it signals emotional reassurance to investors who value stability, trust, and institutional credibility in a fast-changing crypto market.

Fidelity Stablecoin FIDD Built on Regulation and Trust

Fidelity said the Fidelity stablecoin FIDD is issued by Fidelity Digital Assets, National Association, and operates on the Ethereum blockchain. The company explained that each token is designed to maintain a one-to-one value with the U.S. dollar. To support this peg, Fidelity reported that reserves consist of cash holdings, U.S. Treasury bills, and repurchase agreements, all managed internally.

Fidelity Stablecoin FIDD Signals a New Era of Trust in Digital Dollars

Also, the firm stated that regulatory clarity introduced through federal stablecoin legislation in 2025 helped speed up the decision to issue a dollar-backed token. As it stands, the investment firm has emphasized that this legal framework gave the company confidence to offer a regulated stablecoin in a market where trust and transparency are often questioned. Market analysts noted that Fidelity’s long history in traditional finance could emotionally reassure cautious users who previously stayed away from stablecoins.

USD-Pegged Stablecoin on Ethereum Targets Real-World Use

Fidelity reported that the USD-pegged stablecoin on Ethereum is intended for on-chain payments, financial settlements, and digital cash functions within blockchain-based investment products. The company added that retail and institutional users can buy and redeem the token directly through Fidelity’s crypto services, allowing easy integration with brokerage and institutional accounts.

While no supply limit has been announced, Fidelity said issuance would grow based on demand. Observers stated that although the stablecoin market is already competitive, Fidelity’s broad customer base and institutional partnerships could support adoption, especially in tokenized funds and real-world asset settlements. However, analysts cautioned that wider use will depend on liquidity, exchange listings, and interoperability with other stablecoins.


In order to place winning trades with us via Bybit, you can open an account here.