ENJ/USDT Price Analysis: ENJ/USDT Faces Selling Pressure After Order Block Rejection
ENJ/USDT remains in a clear downtrend structure within a descending channel which made the price to attempt to break above the trendline. This was rejected by a bearish order block (OB) near the $0.0285–$0.0290 supply zone.
ENJ/USDT Key Levels:
Support Levels: $0.0240, $0.0220 Resistance Levels: $0.0280, $0.0360
On the daily timeframe, after the rejection, price formed a break of structure (BOS) to the downside, confirming that bears are still in control. The Stochastic Relative Strength Index (Stoch RSI) is in the oversold area near the $0.0240 price level, but price remains below key resistance and the trendline, signalling that any upward move may be corrective rather than a trend reversal.
The daily timeframe also shows price trading below the mid-band of the Bollinger Bands, indicating that bearish momentum is still present. On the 4-hour timeframe, the Stoch RSI shows that bears still have room to continue the downtrend.
Market Expectation
Zooming in on the 4-hour timeframe, price is forming a descending triangle pattern near $0.0240. This is a bearish continuation signal. Although price is currently reacting to the support at $0.0240, this level may be broken, allowing price to continue lower due to the chart pattern.
Note:Cryptosignals.org is not a financial advisor. Do your research before investing your funds in any financial asset or presented product or event. We are not responsible for your investing results.
Sui (SUI/USDT) remains under sustained bearish pressure, with price action continuing to compress below the $1.300 psychological level. After failing to reclaim the $1.500 resistance zone, sellers regained control, pushing price into a tight consolidation range near $1.120. Momentum remains weak, and accumulation signals are fading, indicating that buyers are struggling to establish a meaningful defense at current levels.
SUI/USDT Daily Chart (Key Levels)
Support Zones: $1.120, $0.580 Resistance Zones: $1.500, $2.020
SUI/USDT Long-Term Trend – Bearish (Daily Chart)
SUI/USDT is currently trading near the $1.120 key zone, down approximately 0.60% on the day. The Momentum indicator remains negative, reflecting continued downside pressure and confirming that bullish strength has yet to return on the higher timeframe.
– I expect that the price will continue to decrease, with a probability of trapping below 1.0784 before a possible technical reaction.
– Any recovery towards 1.1190-1.1222 is an opportunity to watch for a short,… pic.twitter.com/bdO8twzhPc
The Accumulation/Distribution line remains soft, signaling weak capital inflows and a lack of sustained accumulation. Price action has printed consecutive small-bodied bearish candles, rejecting intraday rallies and closing near session lows. This candle behavior highlights persistent selling pressure and limited buyer follow-through.
As long as price remains capped below the $1.280 to $1.300 region, downside risk remains elevated. If sellers maintain control, a gradual move toward the $1.120 support becomes increasingly likely, with a deeper extension toward the $0.580 higher-timeframe demand zone if bearish momentum accelerates.
A bullish recovery scenario would require a clean reclaim of $1.280, followed by acceptance above the $1.500 resistance zone. Bulls would need to reclaim $1.280 with a strong, wide-bodied candle and follow-through buying to invalidate the current bearish structure. If achieved, this could trigger short covering and open the path toward $2.020.
SUI/USDT Short-Term Trend – Bearish (4H Chart)
On the 4-hour chart, SUI/USDT continues to show intraday weakness. Price is trading near $1.120, with a clear sequence of lower highs and lower closes still intact. Short-term momentum remains bearish, while accumulation metrics remain flat, confirming hesitation from buyers and a lack of aggressive dip buying.
Until a structural shift occurs on the 4H timeframe, rallies are likely to be corrective in nature. Traders relying on crypto signals should remain cautious and focus on confirmation rather than anticipation in the current environment.
SUI/USDT Market Statistics
Current Price: $1.12 Market Capitalization: $1,300,000,000 24H Trading Volume: $420,000,000
In the world of trading, complexity often feels like progress. New indicators, advanced tools, and ever-evolving strategies promise an edge in fast-moving markets. Before long, many traders find themselves juggling multiple systems, each with different rules, signals, and expectations. Ironically, this pursuit of sophistication is one of the most common reasons traders struggle to achieve consistency.
Simplicity, when applied correctly, is not a limitation—it is a competitive advantage.
Why Simpler Trading Strategies Work Better
At its core, trading is about price behavior. Markets may differ in liquidity, volatility, and personality, but price itself follows universal principles. Trends form, breakouts occur, and reversals happen across asset classes and timeframes. A well-designed strategy—whether trend-following, breakout-based, or mean-reversion—can be applied to stocks, forex, commodities, or cryptocurrencies without changing its foundational logic.
What adapts is not the strategy, but the risk management. Position sizing, filters, and trade frequency can be adjusted to suit different markets, while the core method remains intact. This consistency allows traders to build deep familiarity with their system rather than constantly starting from scratch.
The Hidden Cost of Strategy Hopping
One of the most damaging habits in trading is strategy hopping—abandoning a system after a losing streak in favor of something new. Every trading strategy experiences drawdowns. Losses are not proof that a system is broken; they are part of the statistical cost of long-term profitability.
When traders jump from one approach to another, they often exit a system during its worst phase and enter a new one just in time to experience its drawdown. Over time, this behavior leads to frustration, inconsistency, and poor results. Sticking with a single, tested strategy long enough to realize its edge is what separates disciplined traders from impulsive ones.
How Simplicity Improves Discipline and Execution
Clear rules create decisive action. When your strategy is simple and well-defined, there is little room for hesitation. A setup either meets your criteria or it doesn’t. Execution becomes routine, not emotional.
This clarity also strengthens discipline. Managing one system is far easier than balancing multiple strategies with different entries, exits, and risk profiles. Fewer variables reduce confusion, and reduced confusion leads to better decision-making. Over time, this consistency builds confidence and emotional resilience—two traits that are essential for long-term trading success.
Source: create.vista.com
The Role of Journaling and Performance Tracking
A single strategy also makes performance analysis far more effective. Instead of recording scattered experiments, your trading journal becomes a powerful tool for growth. You can track meaningful metrics such as win rate, average reward-to-risk ratio, drawdowns, and expectancy across hundreds of trades.
This data-driven feedback allows you to refine execution, identify weaknesses, and improve gradually—without abandoning the system that already works.
Mastery Comes From Focus, Not Variety
History shows that the most successful traders are not experts in dozens of systems. They are specialists. Their edge comes from mastering one approach and applying it with patience and discipline over time.
The market rewards traders who are clear in their method, consistent in their execution, and patient in their expectations. Reinventing your strategy every few months only delays progress.
Final Thoughts
Simplicity in trading is not the absence of sophistication—it is sophistication refined. One robust strategy, deeply understood and consistently applied, will outperform a collection of half-tested ideas every time.
Choose a system that fits your personality. Learn it thoroughly. Trust the process. And let simplicity do the heavy lifting.
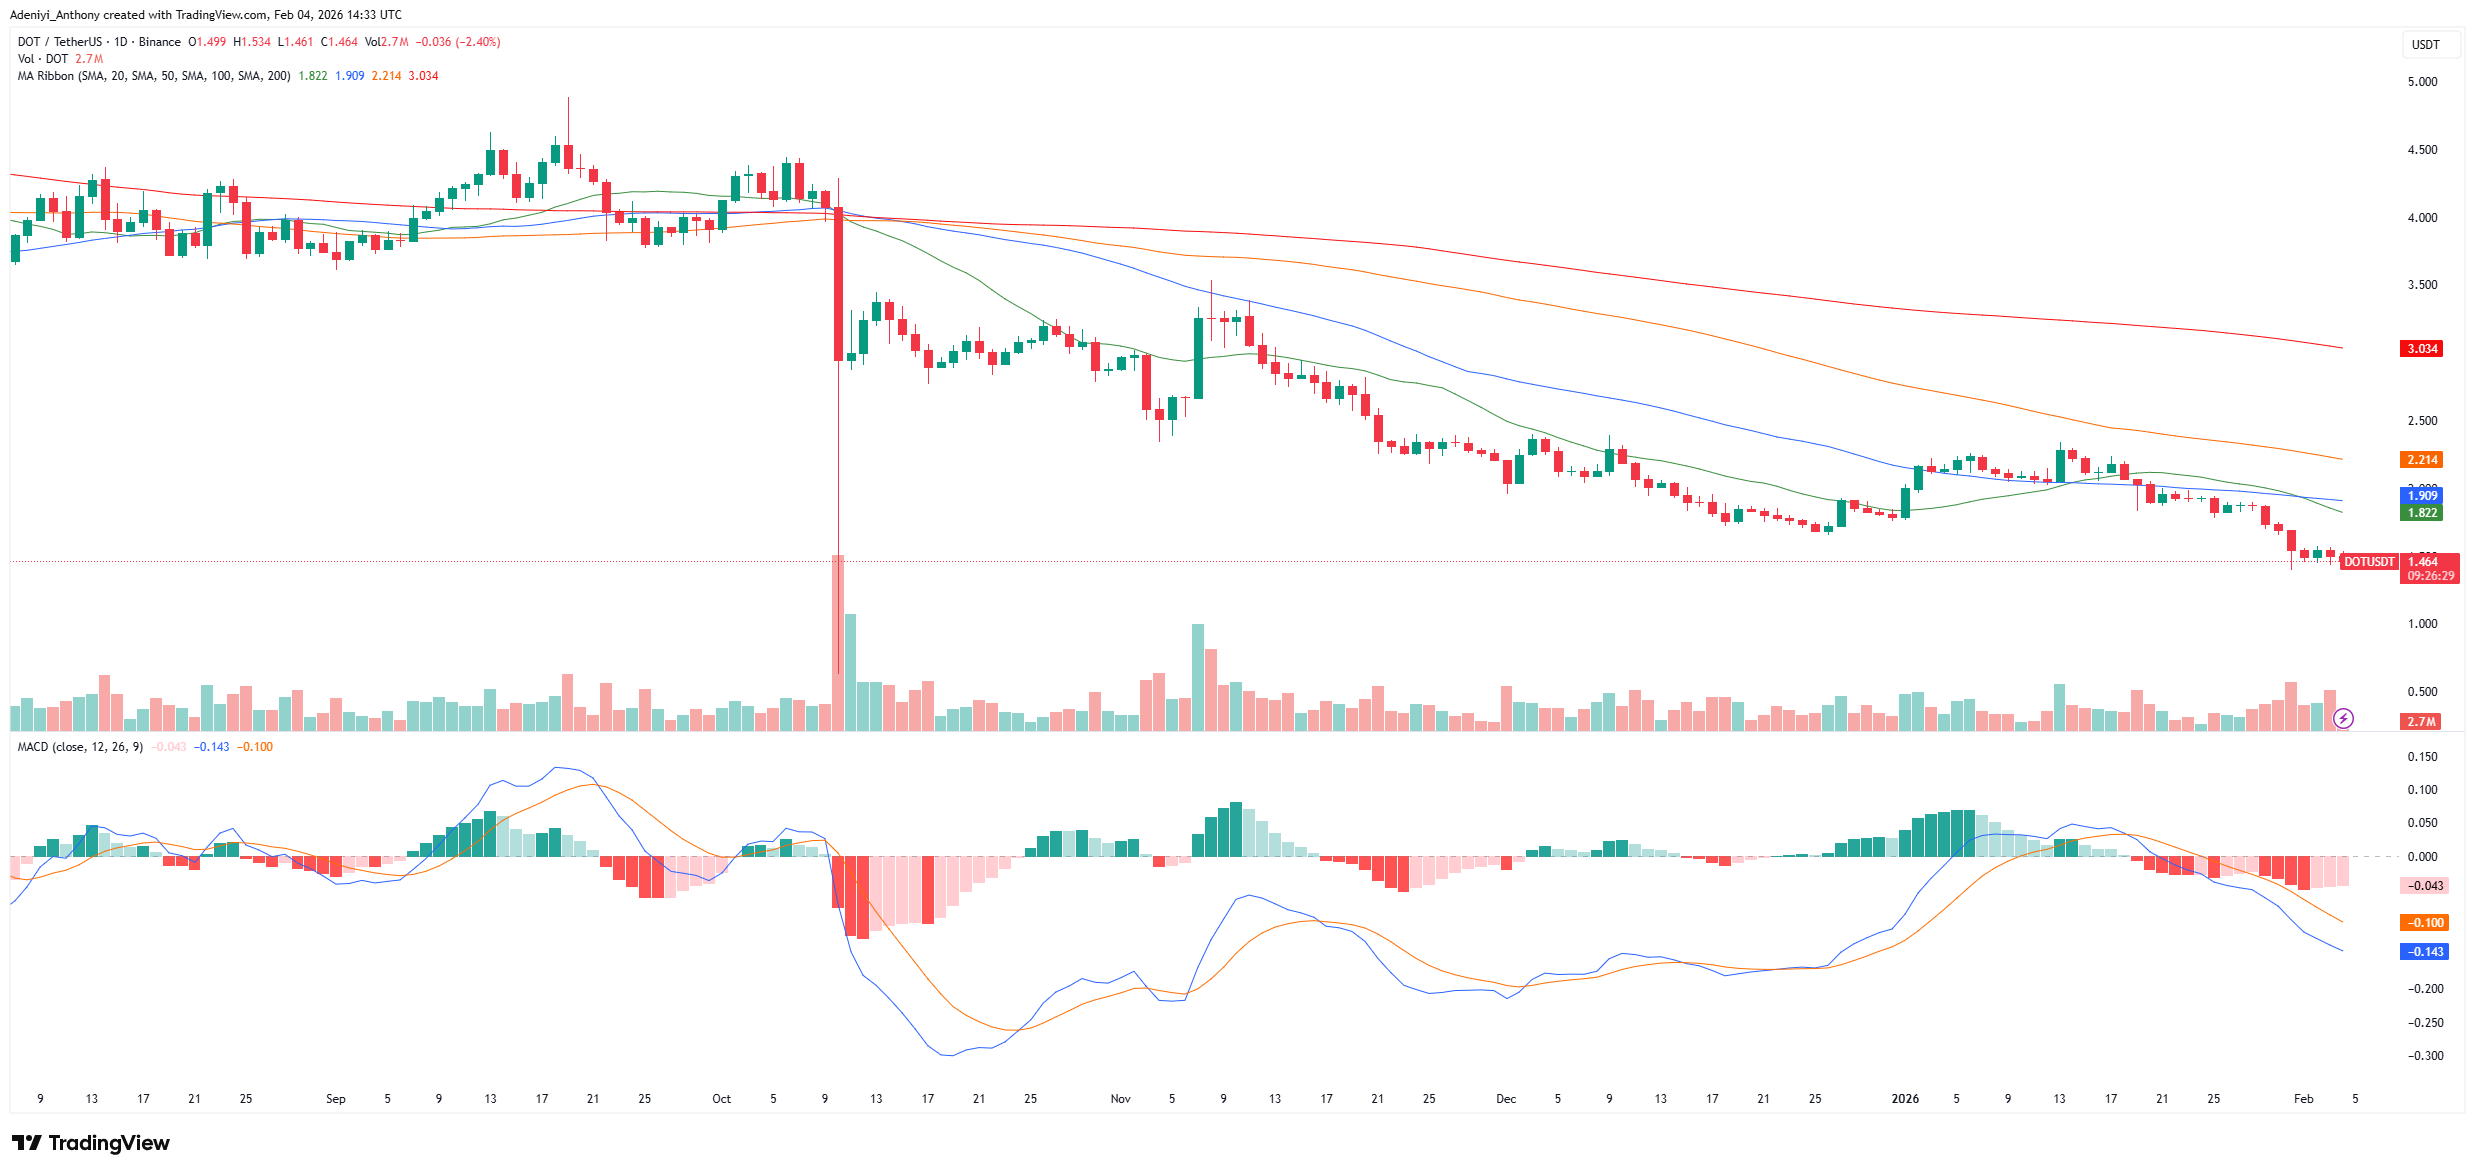
Polkadot against Tether has continued its downward trajectory, falling 1.22% daily and over 18% weekly. As it stands, this decline appeared to be fueled by a broad market sell-off and extreme fear sentiment, as the breach of Polkadot support levels sent panic down investors’ spines.
Technically, DOT has breached its critical $1.50 support level. Despite occupying an oversold region, the price remains suppressed by institutional skepticism toward interoperability tokens as the market view shifts toward Layer-2 solutions.
Major Resistance Levels: $1.750, $2.000, and $2.250
Major Support Levels: $1.400, $1.300, and $1.000
Technical Analysis
Technically, Polkadot against Tether on the daily chart appears to be locked in a firm bearish cycle, with the price breaking below the anticipated Polkadot support level. As it stands, the price operates below the cluster of simple moving averages, denoting sustained sell pressure as the bears make a move for a level below $1.450.
However, the signal from the MACD suggests bearish momentum is waning as the price action suggests a prolonged downtrend. To this end, the price can only move to the north if bullish participation improves above $1.620. Conversely, a move below $1.450 may suggest $1.300 as the next support level.
Polkadot Project Scary Chart
Polkadot is currently navigating a period of intense capitulation. The price appears to be compressing into a multi-month falling wedge after a flush toward $1.50. Meanwhile, despite the bearish momentum, the macro structure remains technically intact as long as DOT holds the critical 2.618 Fibonacci level at $1.37. A weekly close below this do-or-die support would invalidate the current cycle’s bullish thesis and likely trigger a deeper drop toward $0.85. However, fundamental news suggests relief above a Polkadot support level is coming soon.
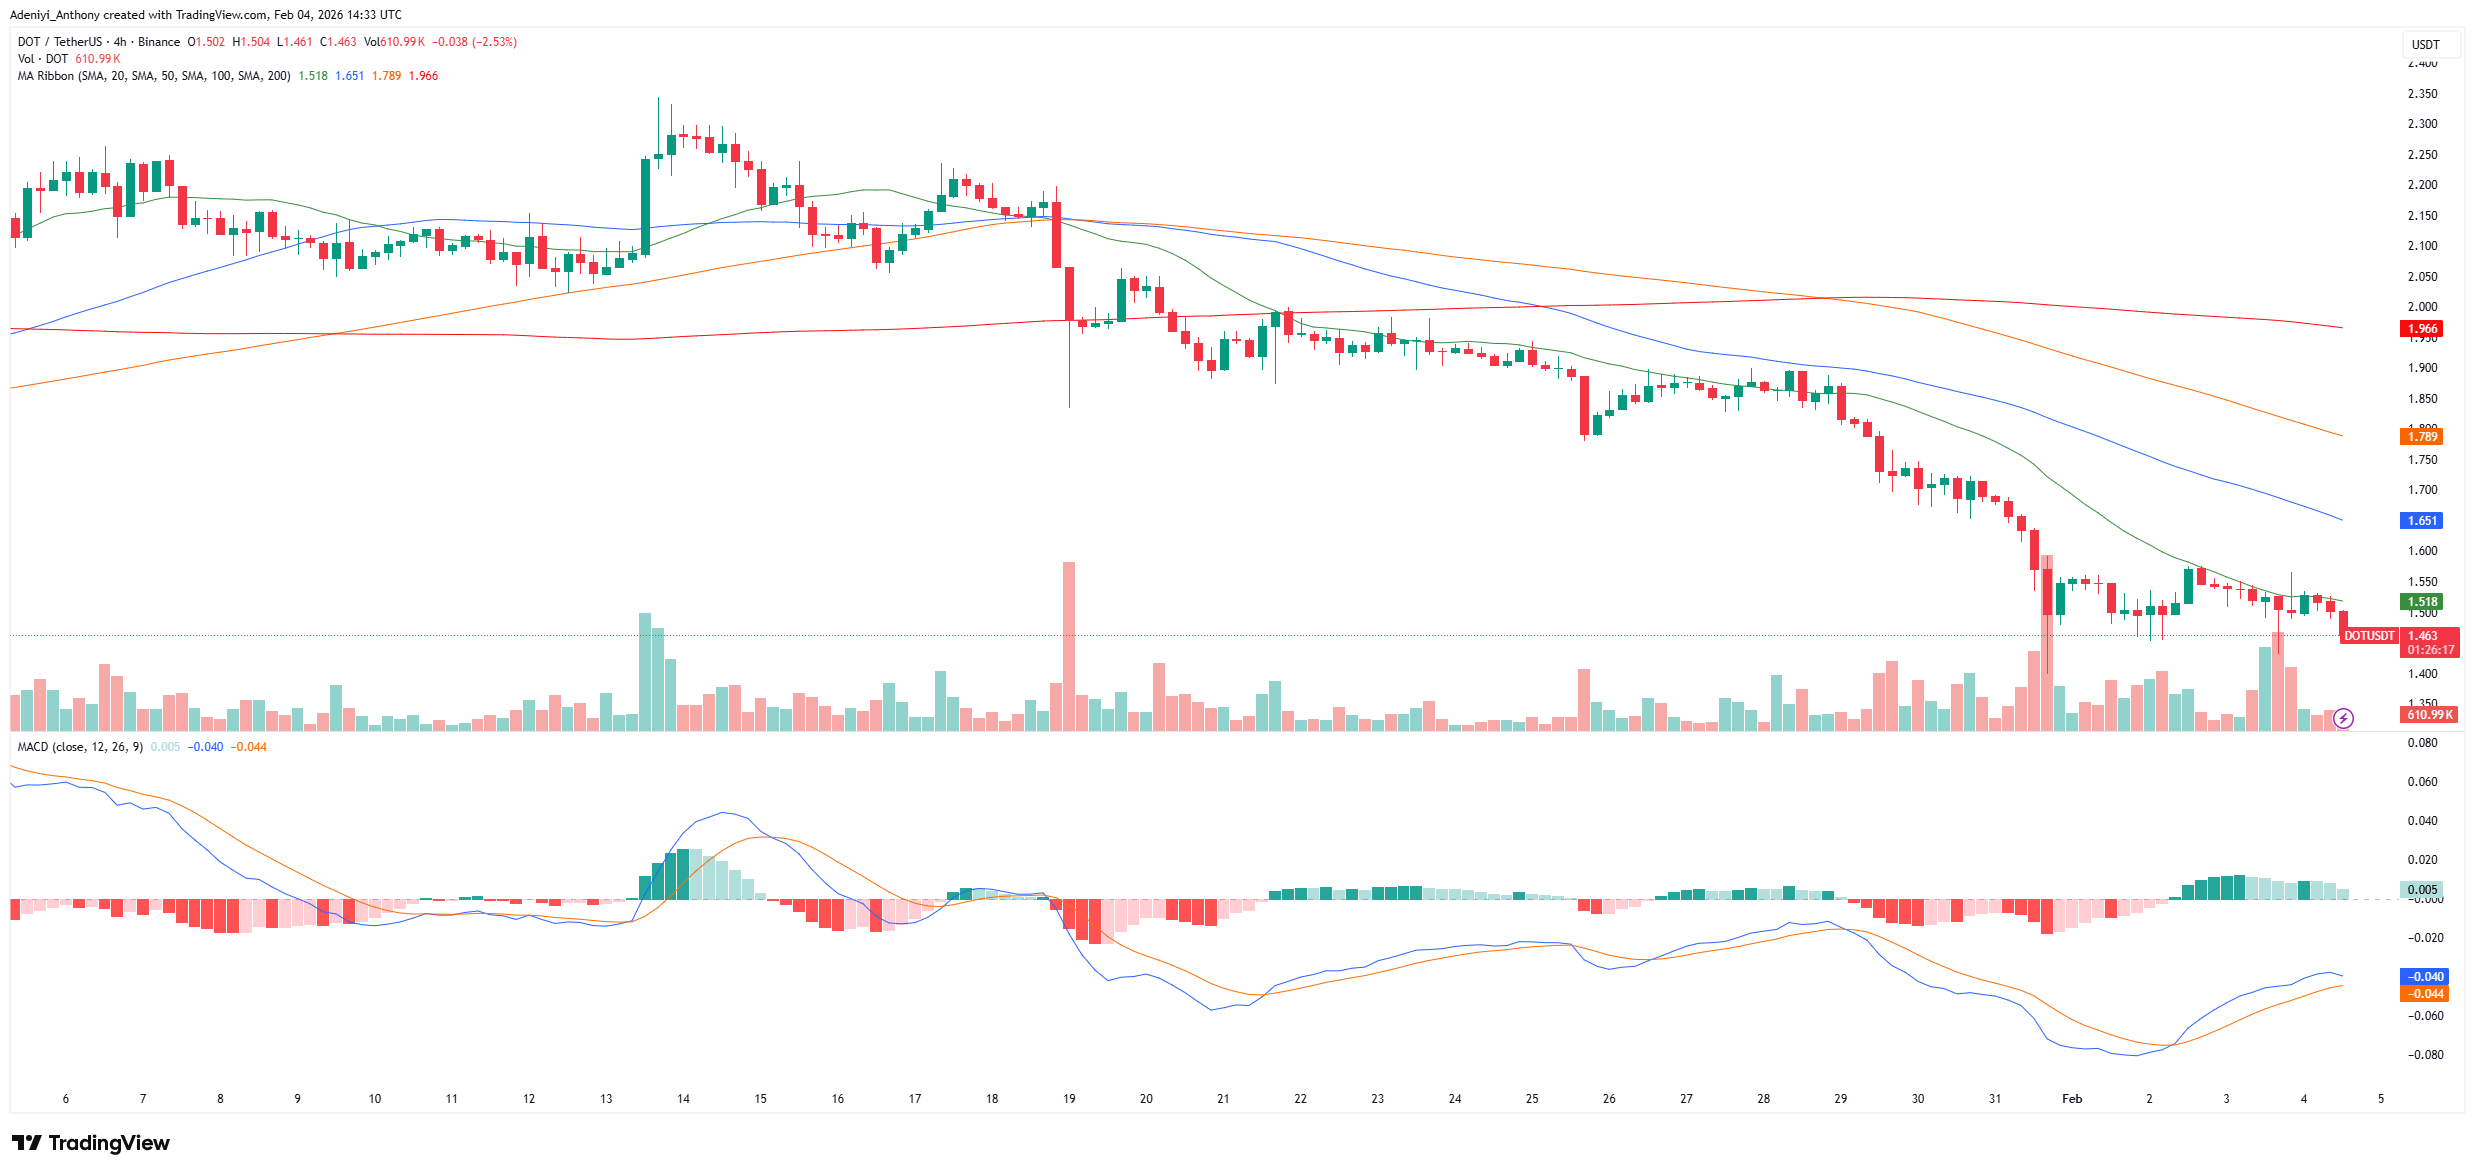
DOT/USDT Analysis: Short-Term Polkadot Support Level Provides Stability
On the 4-hour chart, DOT/USDT is showing signs of exhaustion from the sellers. Though the price is still below the SMA, recent price action suggests stability. However, the short-period MACD signals buying momentum is not enough to push the price upside. Meanwhile, the narrative may change provided the bulls increase participation.
To this end, if the bulls cannot reclaim the $1.62 in the coming session, another critical Polkadot support level may be broken.
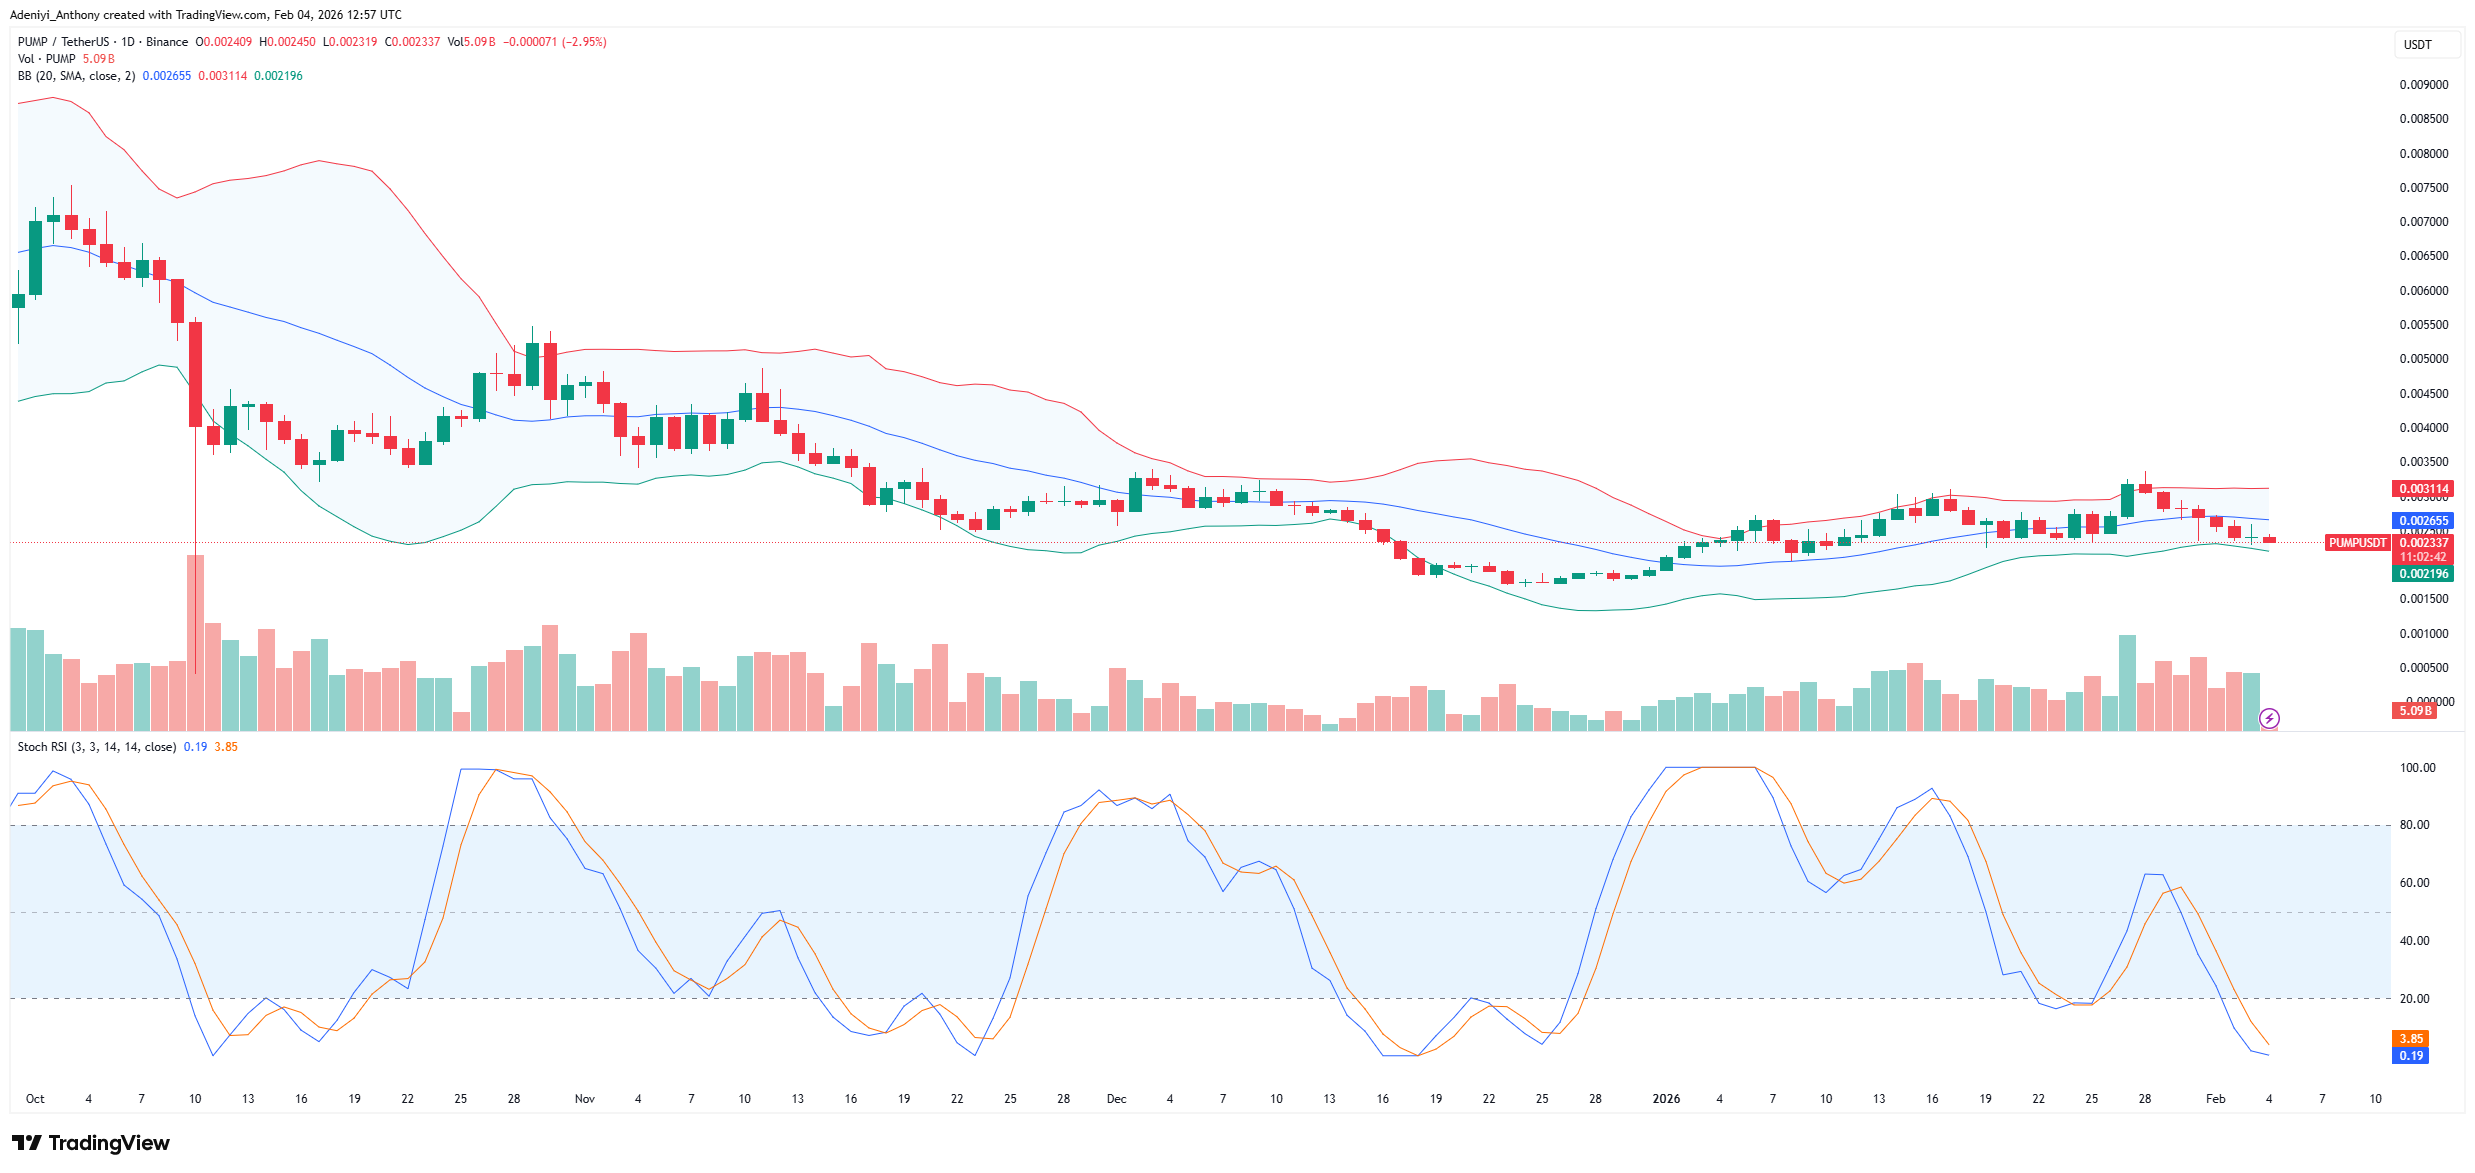
Pump.fun price has extended its weekly decline to 23% following a 2.29% dip over the last 24 hours. This downturn appears to be primarily driven by a 1.9% contraction in the global crypto market cap, leading to a massive downtrend in the altcoin market.
Furthermore, it appears that more pressure seems to be stemming from a technical resistance level at $0.0034. This has triggered widespread stop-loss orders. Combined with an extreme fear sentiment rating of 14. At the moment, investor risk appetite remains low, fueling continued bearish momentum across the ecosystem.
Major Resistance Levels: $0.00259, $0.00313, and $0.00325
Major Support Levels: $0.00228, $0.00200, and $0.00180
Technical Analysis
Technically, Pump.fun against Tether appears to be exhibiting classic sideways movement on the daily chart. The pair is moving within a collapsed band as the Pump.fun price operates right above the lower Bollinger line. This suggests the token is oversold as the participatory level rises.
Additionally, signals from the Stochastic RSI show that the pair is extremely oversold, with the lines positioned lower than the 20-mark level. However, the behavior of the lines suggests there might be a relief bounce above $0.002590 that may be spotted soon.
Meanwhile, a post from X from @DegenMemeCalls reports that pump.fun has reached nearly 300,000 daily active wallets, which seems to be driving a surge in Solana meme coin activity. To this end, the analyst opined that this growth, marked by high token creation and record buybacks, may indicate a rebound in platform dominance. It was suggested that this action may renew investor enthusiasm within the crypto ecosystem.
https://t.co/b0Bh55ZusJ hits nearly 300K daily active wallets, leading a surge in Solana meme coin activity. New wallets, high token creation, and record buybacks signal renewed crypto enthusiasm and platform dominance rebound. pic.twitter.com/NX54zOOUXR
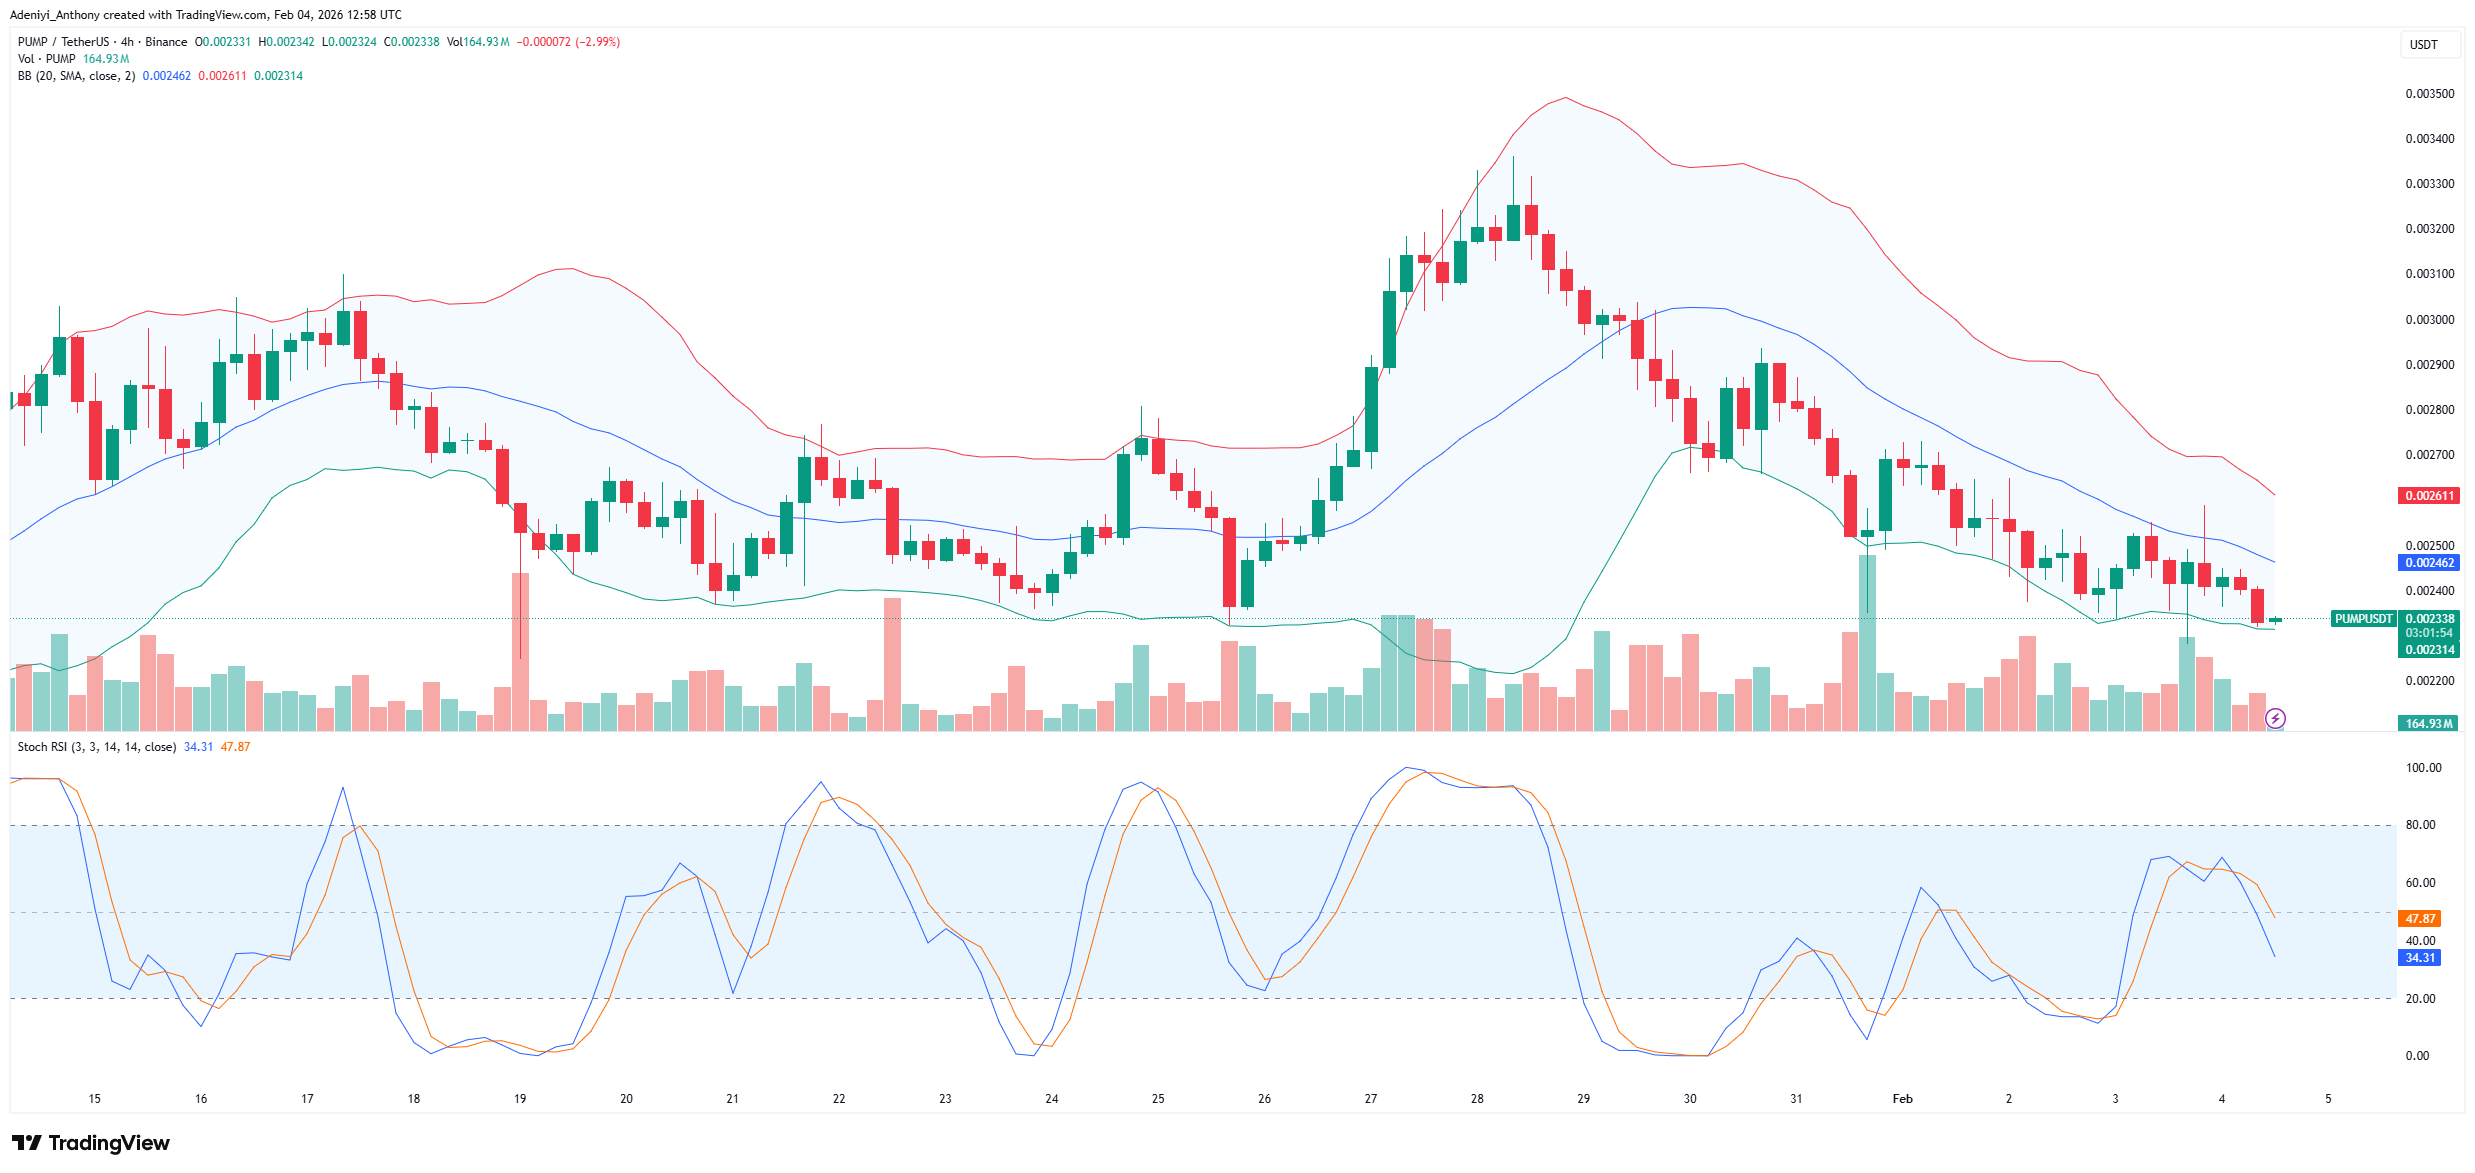
PUMP/USDT on the 4H chart displays an obvious trend with the Pump.fun price tending to the south after a failed attempt around $0.00300 weeks ago. As it stands, the directional indicator suggests more movement in the current direction in the coming days. However, current price action suggests that buyers need to increase their involvement or maintain the current level to change the tide.
Meanwhile, the momentum oscillator beneath the chart signals increasing selling pressure as the lines drop sharply in the 40-30 mark level. To this end, if momentum is not stabilized, Pump may not be able to stay above the current demand zone.
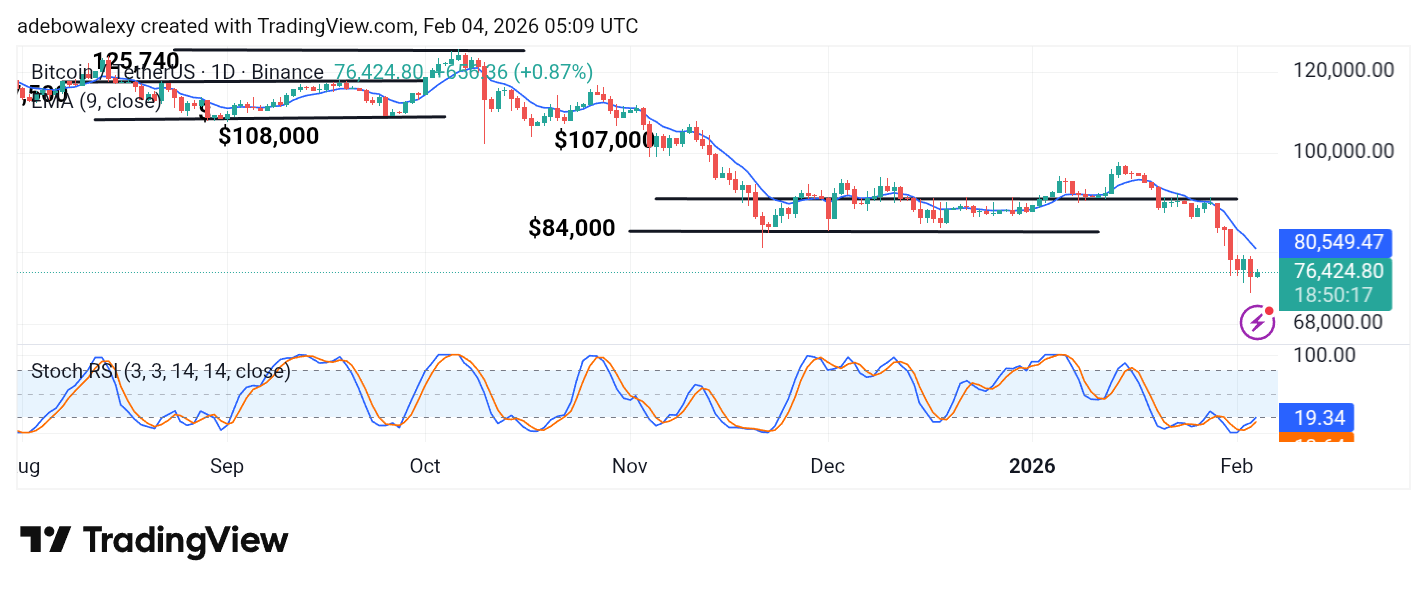
The Bitcoin market was hit by strong headwinds, which sent its price action sharply lower. The token even tested a long-term support level at $75,000 before rebounding slightly above it.
BTC/USDT Long-Term Trend — Bearish (Daily Chart)
Key Price Levels
Resistance: $77,000, $80,000, $82,500
Support: $75,000, $72,500, $70,000
Price action in the Bitcoin market has been spiraling downward following hawkish comments from the U.S. president. As a result, the ongoing session has slipped below the 9-day Exponential Moving Average (EMA).
The most recent price candle on the chart is green but remains below the 9-day EMA curve. Consequently, the Stochastic Relative Strength Index (SRSI) indicator lines are in the oversold region, though they show a slight upward trajectory.
Bitcoin Price Prediction: BTC/USDT Remains Subdued and May See Further Bearish Progress
On the daily chart, price action continues to follow a downward trajectory, with the market diving toward lower price levels. The decline appears steep, reinforcing bearish sentiment.
As a result, price action remains below the 9-day EMA curve, which presents a strong bearish outlook for the market. Meanwhile, the SRSI indicator lines are attempting a modest upward move from the oversold region. Consequently, the market remains under significant bearish pressure.
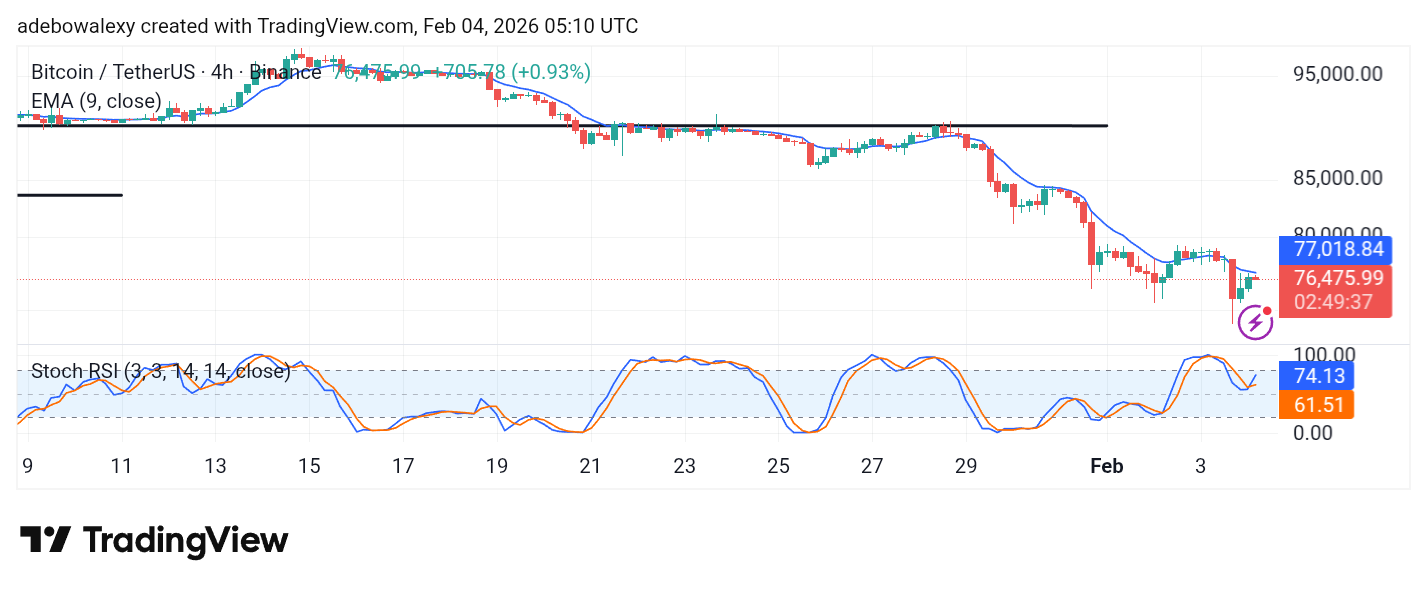
Bitcoin Price Prediction: BTC/USDT Yielding to Bearish Pressure (4-Hour Chart)
While the Bitcoin market managed to register a short-term recovery over the past two sessions, the ongoing session is currently represented by a red price candle.
Moreover, this weakness is occurring below the 9-day EMA curve. The SRSI indicator lines have delivered an upside crossover, and despite the minor downward pullback, they continue to maintain an upward trajectory. Be that as it may, support at the $75,000 level may be tested again shortly.
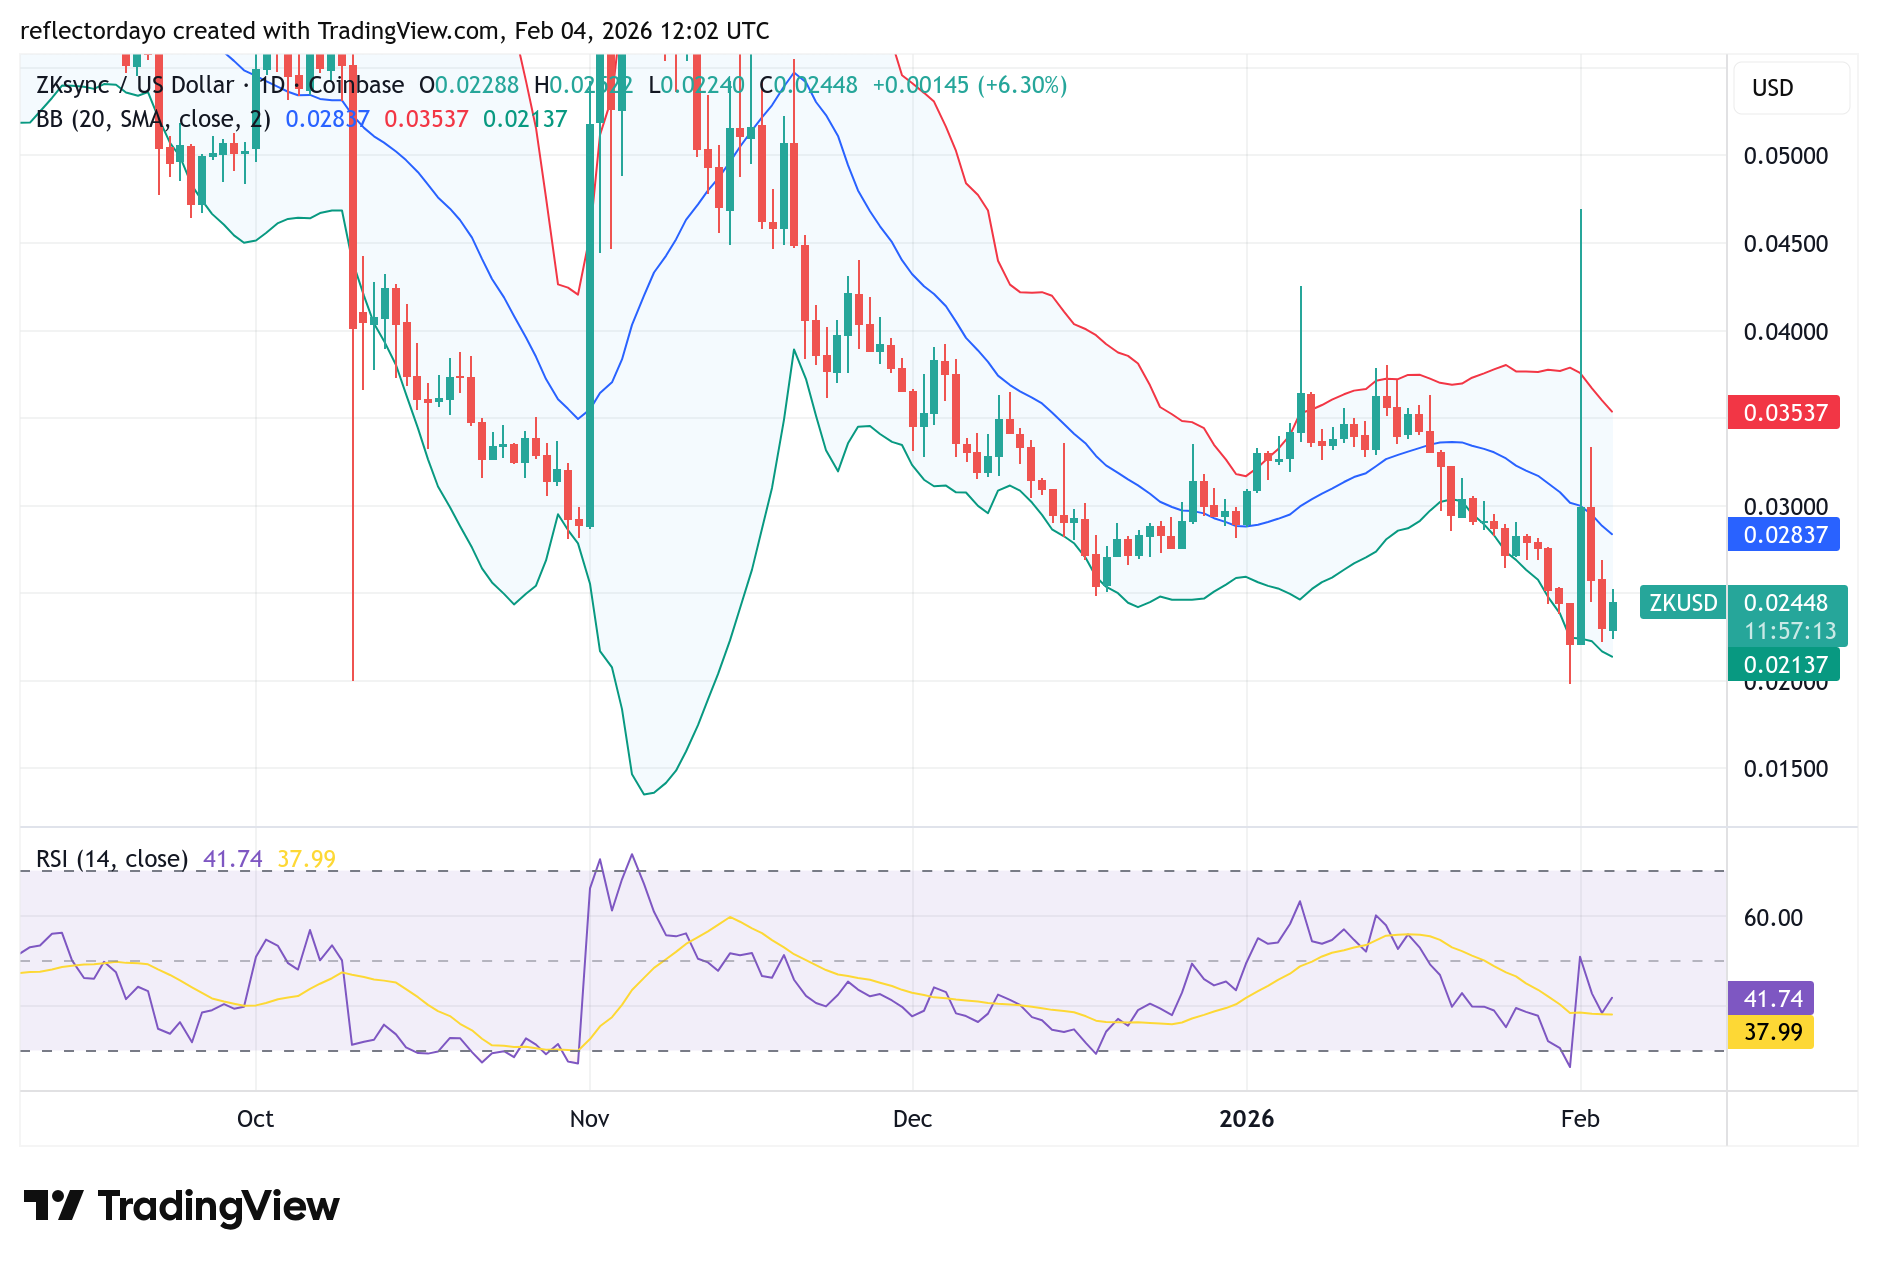
The ZKsync market recently lost its footing above the $0.025 price level following heightened downside volatility that swept across the broader cryptocurrency market. This bearish pressure forced bulls to relinquish control of the key threshold, pushing prices lower in recent trading sessions.
However, the market is now attempting a rebound, suggesting that bullish sentiment remains active below this critical zone. The ongoing recovery indicates renewed buying interest, although the $0.025 level—once a support—has now flipped into a significant resistance barrier. For bullish momentum to strengthen further, buyers will need to reclaim and sustain price action above this level.
ZKsync (ZK/USD) Market Data
ZK/USD Price Now: $0.02458
ZK/USD Market Capitalization: $207 million
ZK/USD Circulating Supply: 8.8 billion ZK
ZK/USD Total Supply: 13.97 billion ZK
ZK/USD CoinMarketCap Ranking: #147
Beyond Scaling: How ZKsync Is Powering the Next Generation of Ethereum L2s
An emerging narrative in the Ethereum ecosystem is that scaling alone is no longer enough to justify the relevance of a Layer-2 network. The L2s that truly matter now are those that extend Ethereum’s utility by adding new, meaningful value. Grvt is positioning itself within this evolution by building a privacy-first exchange L2 that is interoperable with Ethereum via ZKsync’s Atlas framework. This integration allows users to tap into Ethereum mainnet liquidity and yield with reduced friction, improved pricing efficiency, and zero-knowledge–backed security guarantees. According to the post, this model represents how Ethereum can grow both in depth and in reach—pointing toward a more seamless, user-centric future for decentralized finance, with a major milestone expected on February 26.
“Scaling is no longer enough to justify being an L2. The L2s that matter now are the ones that add new value to Ethereum.”
Grvt is working on exactly this! A privacy-first exchange L2, interoperable with Ethereum through @ZKSync Atlas, so users can access mainnet liquidity +… https://t.co/cEWl8Bes1X
After the breakdown at the $0.025 level toward the end of January—specifically on January 31—bulls quickly identified a strong support zone around the $0.020 price level. This support has since played a pivotal role in redirecting price action to the upside.
The ZKsync bulls took advantage of the increase in market volatility to initiate a rebound from this level. However, the earlier breakdown at $0.025 has drawn significant selling pressure back into the market, reinforcing strong bearish interest around that zone. As a result, the $0.025 level has now evolved into a formidable resistance barrier—one that bulls must decisively break and hold above if the bullish recovery is to extend further.
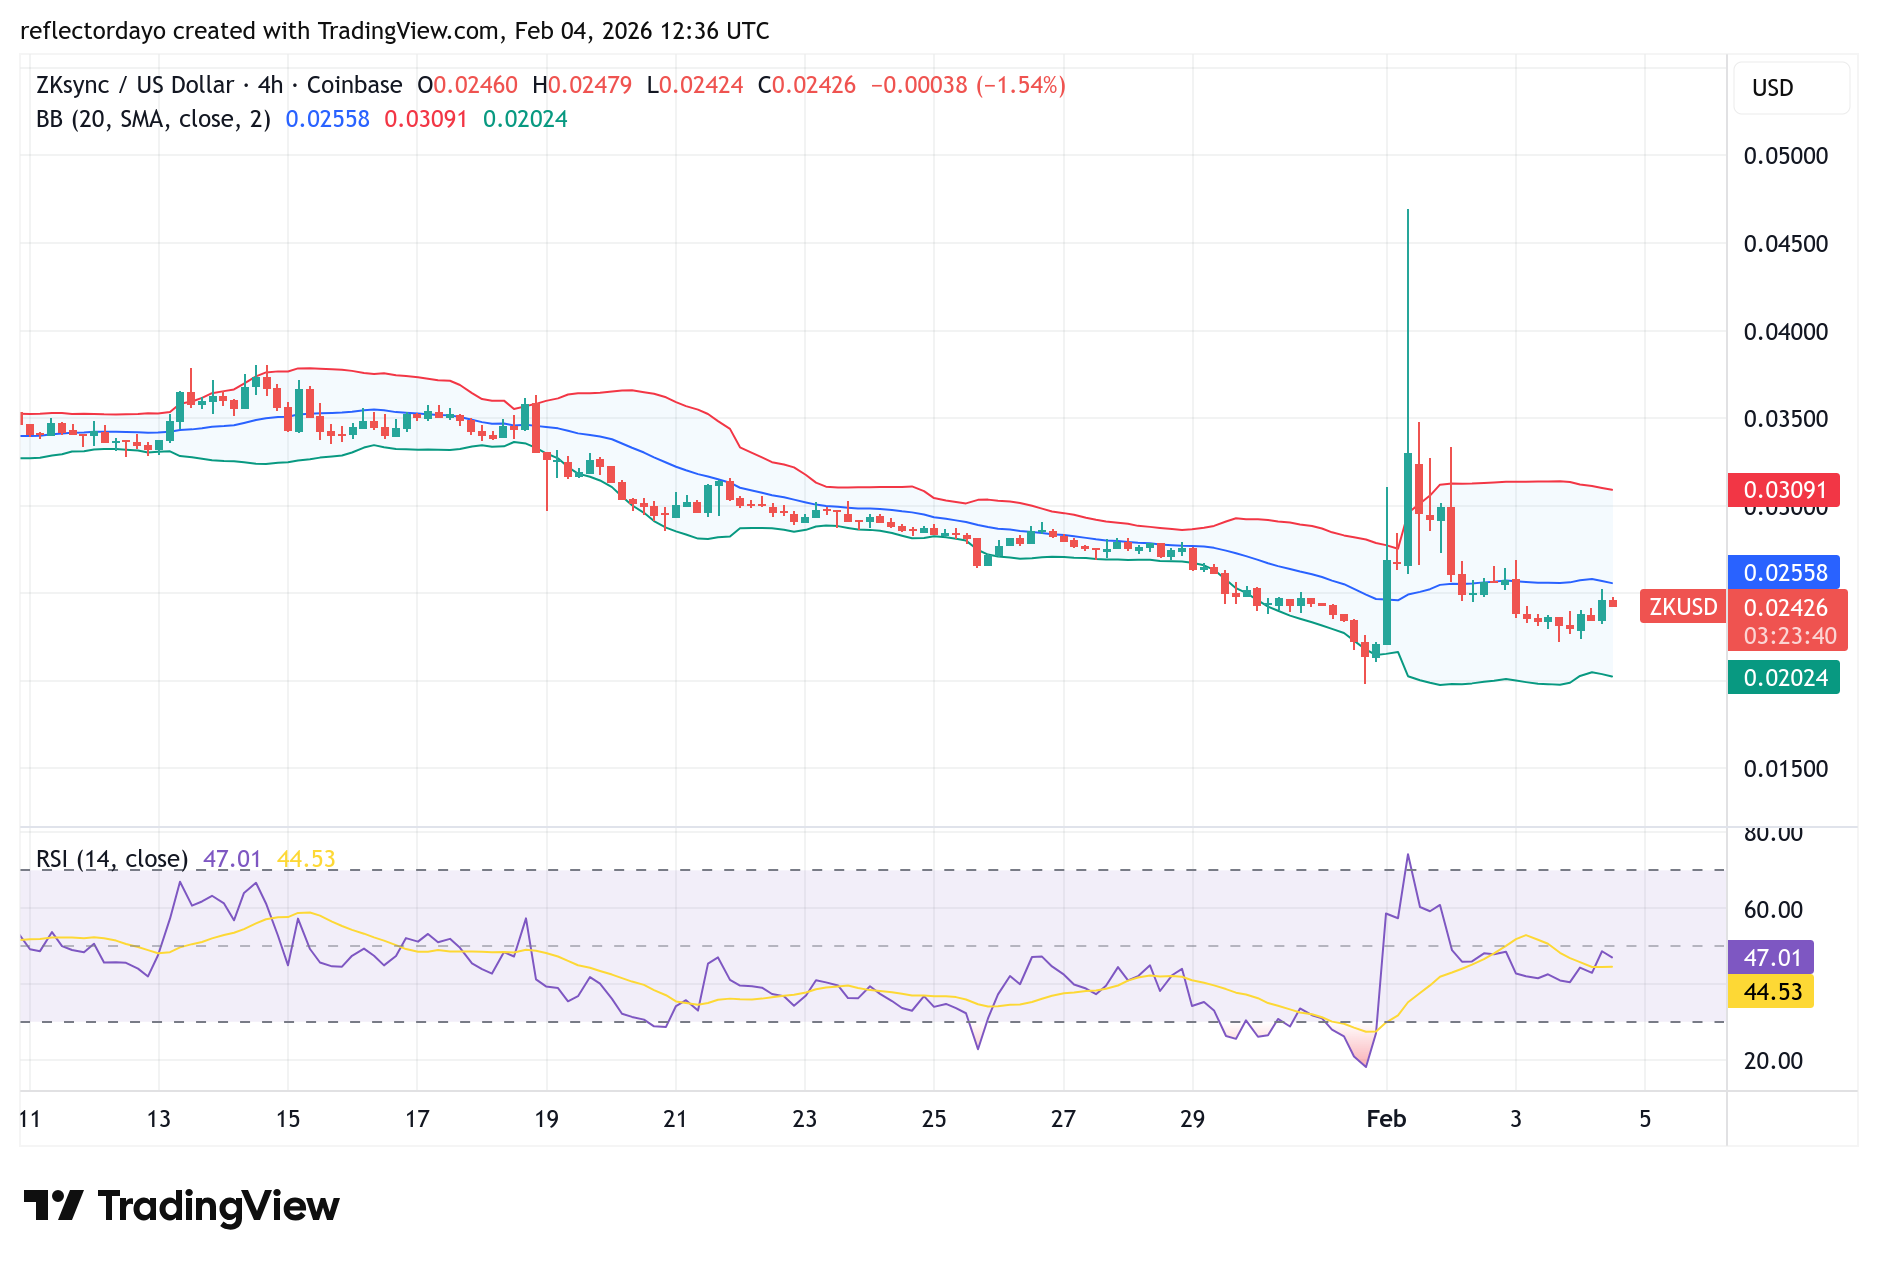
ZK/USD 4-Hour Chart Outlook
Zooming into the 4-hour chart, the bullish recovery appears to be losing momentum as price approaches the $0.025 resistance level. This hesitation is evident in recent price behavior, which suggests that traders are becoming increasingly cautious.
The current trading session is forming a four-price doji candlestick—a classic signal of crypto market indecision—while the previous session printed an upper shadow, indicating rejection near higher price levels. Together, these candlestick formations reinforce the view that buying pressure is weakening near resistance.
At present, price is trading around the $0.0245 level, raising the possibility that consolidation may unfold below the critical $0.025 resistance zone before the market makes its next decisive move.
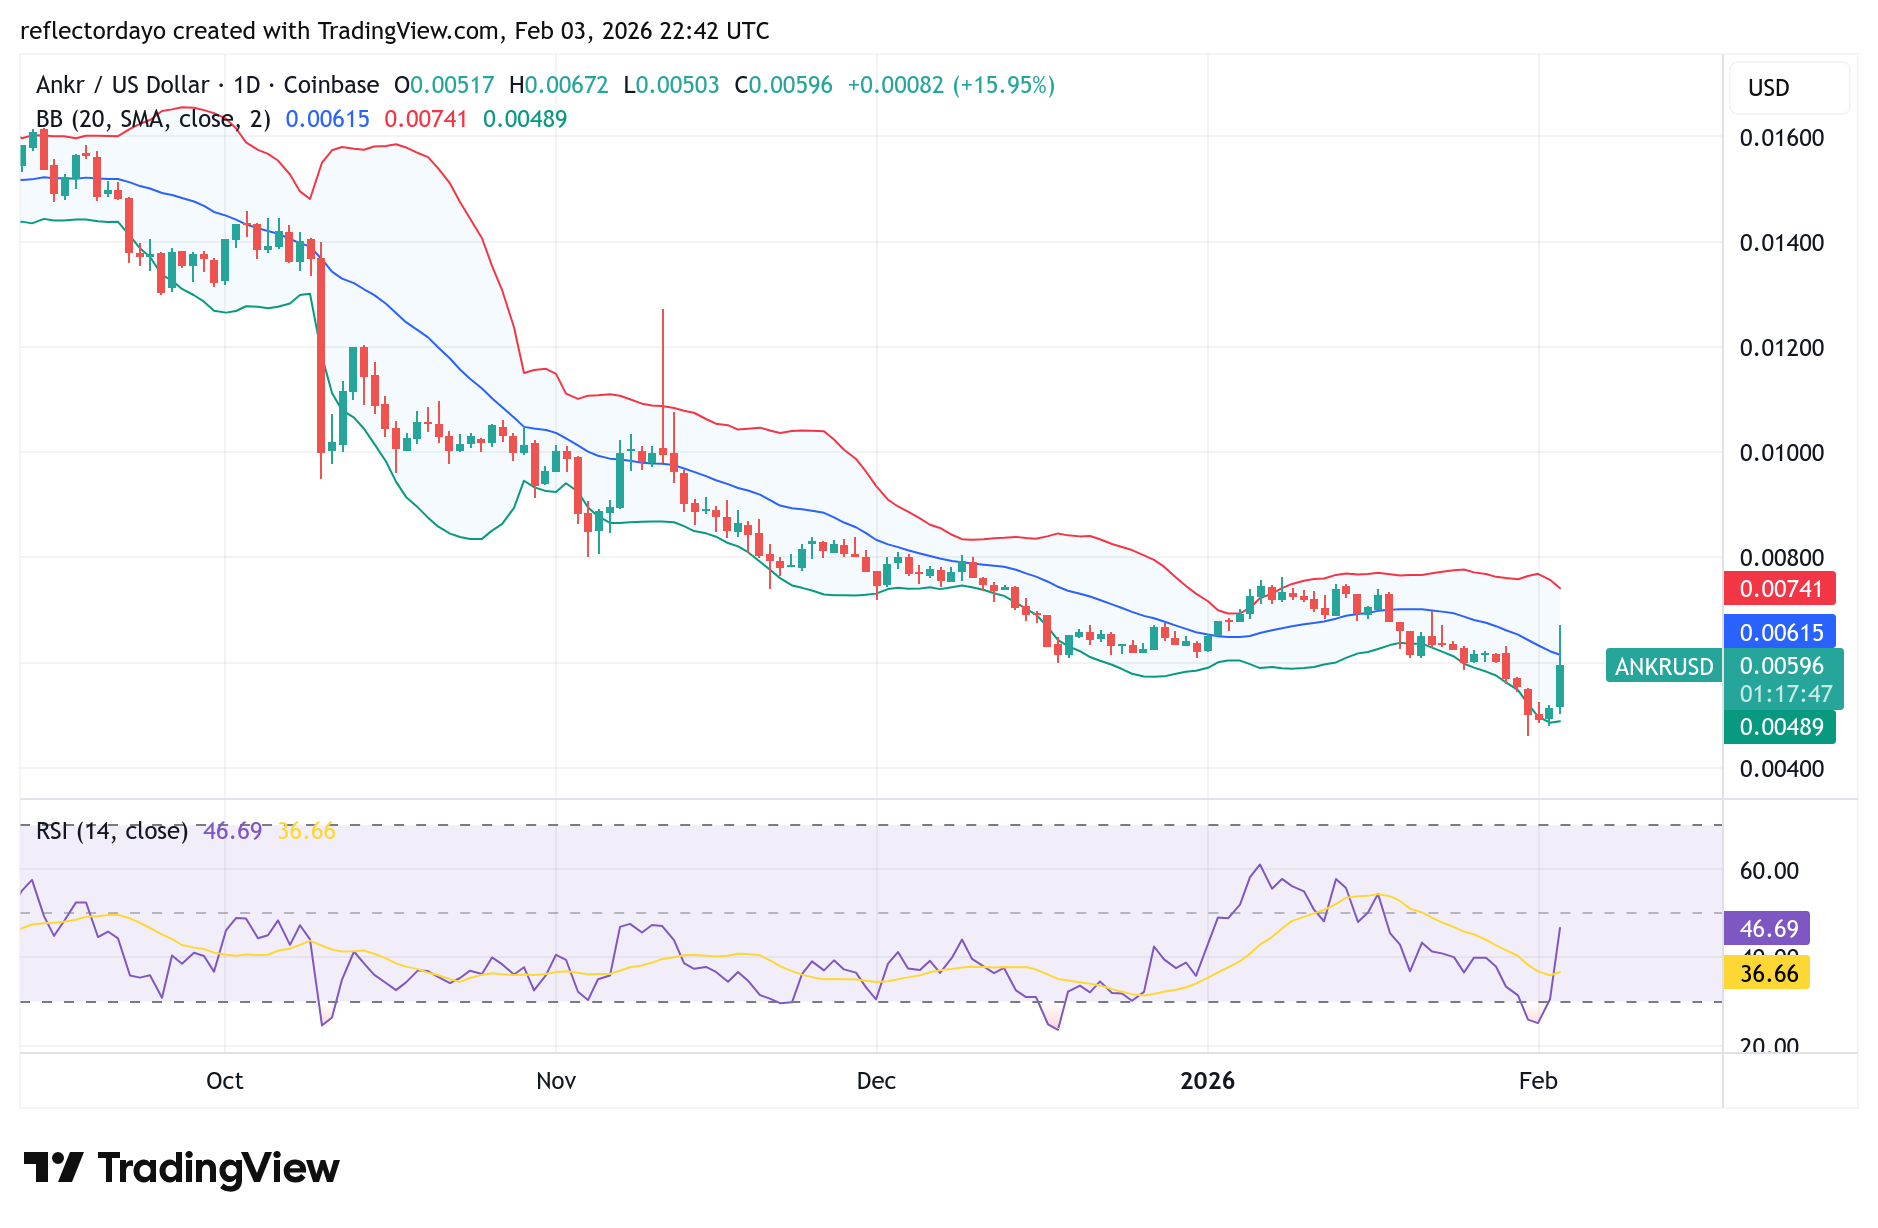
The Ankr (ANKR/USD) market has remained in a bearish trend since November last year, following a breakdown below the key $0.01 price level. This level initially attracted strong participation from both buyers and sellers, leading to elevated volatility. However, bearish pressure ultimately dominated, forcing the market lower.
As the decline progressed, downside momentum began to fade, with volatility dropping significantly—an early sign that selling pressure was weakening. Near the $0.006 price area, the market showed mild bullish bias, resulting in a consolidation phase that hinted at possible trend exhaustion.
In today’s trading session, The Ankr market confirmed this shift in sentiment with a decisive bullish breakout of approximately 3.8%, signaling renewed buying interest and the potential start of a recovery phase. Sustained upside momentum could allow the market to challenge nearby resistance levels, while failure to hold above the breakout zone may lead to further consolidation.
Ankr (ANKR/USD) Market Data
ANKR/USD Price Now: $0.06
ANKR/USD Market Capitalization: 50.9 million
ANKR/USD Circulating Supply: 10 billion ANKR
ANKR/USD Total Supply: 10 billion ANKR
ANKR/USD CoinMarketCap Ranking: #388
ANKR/USD Remains Range-Bound as Early Recovery Signals Emerge
ANKR/USD continues to trade within a well-defined price channel that has remained intact since the formation of a notable weekly candle marked by a long upper wick. During that move, price briefly surged toward the $0.025 area before retreating and settling near $0.018, where consolidation has since dominated price action. Notably, ANKR has yet to produce a decisive wick outside this channel, highlighting persistent range-bound conditions.
Despite the broader consolidation, the market recently posted a short-term rally of approximately 13%, signaling renewed buying interest at historically low price levels. However, upside progress remains capped by multiple higher-timeframe resistance zones, particularly on the monthly chart, which continue to limit bullish expansion.
From a structural standpoint, a confirmed breakout above the channel would expose ANKR to a potential advance toward the $0.023 region. Volume dynamics, however, remain a key hurdle. Price is still trading well below the volume point of control, with a more constructive market structure likely requiring a sustained move above the $0.026–$0.027 range. A broader shift in participation could emerge if price successfully reclaims the $0.03 level.
Momentum indicators are beginning to show early signs of recovery, with oscillators gradually lifting from oversold conditions and bearish momentum fading. That said, mid-term timeframes still suggest the need for further consolidation before a stronger bullish continuation can be confirmed.
Key Levels to Monitor
Resistance: $0.065, $0.070, $0.075
Support: $0.045, $0.050, $0.055
Ankr Market Analysis: Technical Viewpoint
Perhaps this ongoing bullish recovery would have unfolded at the $0.06 price level under normal market conditions. However, the broader crypto market was recently hit by a wave of heightened downside volatility, which disrupted the recovery and forced prices lower. As a result, the current bullish rebound is now taking place below this critical level, with $0.06 acting as a key resistance zone, as bears have firmly taken control of this area.
ANKR Token Holders Play a Key Role in Network Governance
ANKR token holders are more than just participants in the market—they are active stakeholders in the Ankr ecosystem. Holding ANKR grants governance rights, allowing users to vote on key protocol upgrades and decisions that shape the future of the network. This governance model places decision-making power directly in the hands of the community, reinforcing Ankr’s commitment to decentralized infrastructure and the broader vision of Web3 innovation driven by collective participation.
1/4:
Do you hold ANKR?
You hold power. Token holders get exclusive voting rights on protocol upgrades.
Your voice matters in shaping Web3 infrastructure.
The true test of the ongoing bullish recovery lies in whether price can reclaim and sustain a move above the $0.06 resistance level. For now, however, that possibility remains under pressure, as the market continues to face strong selling interest around this zone.
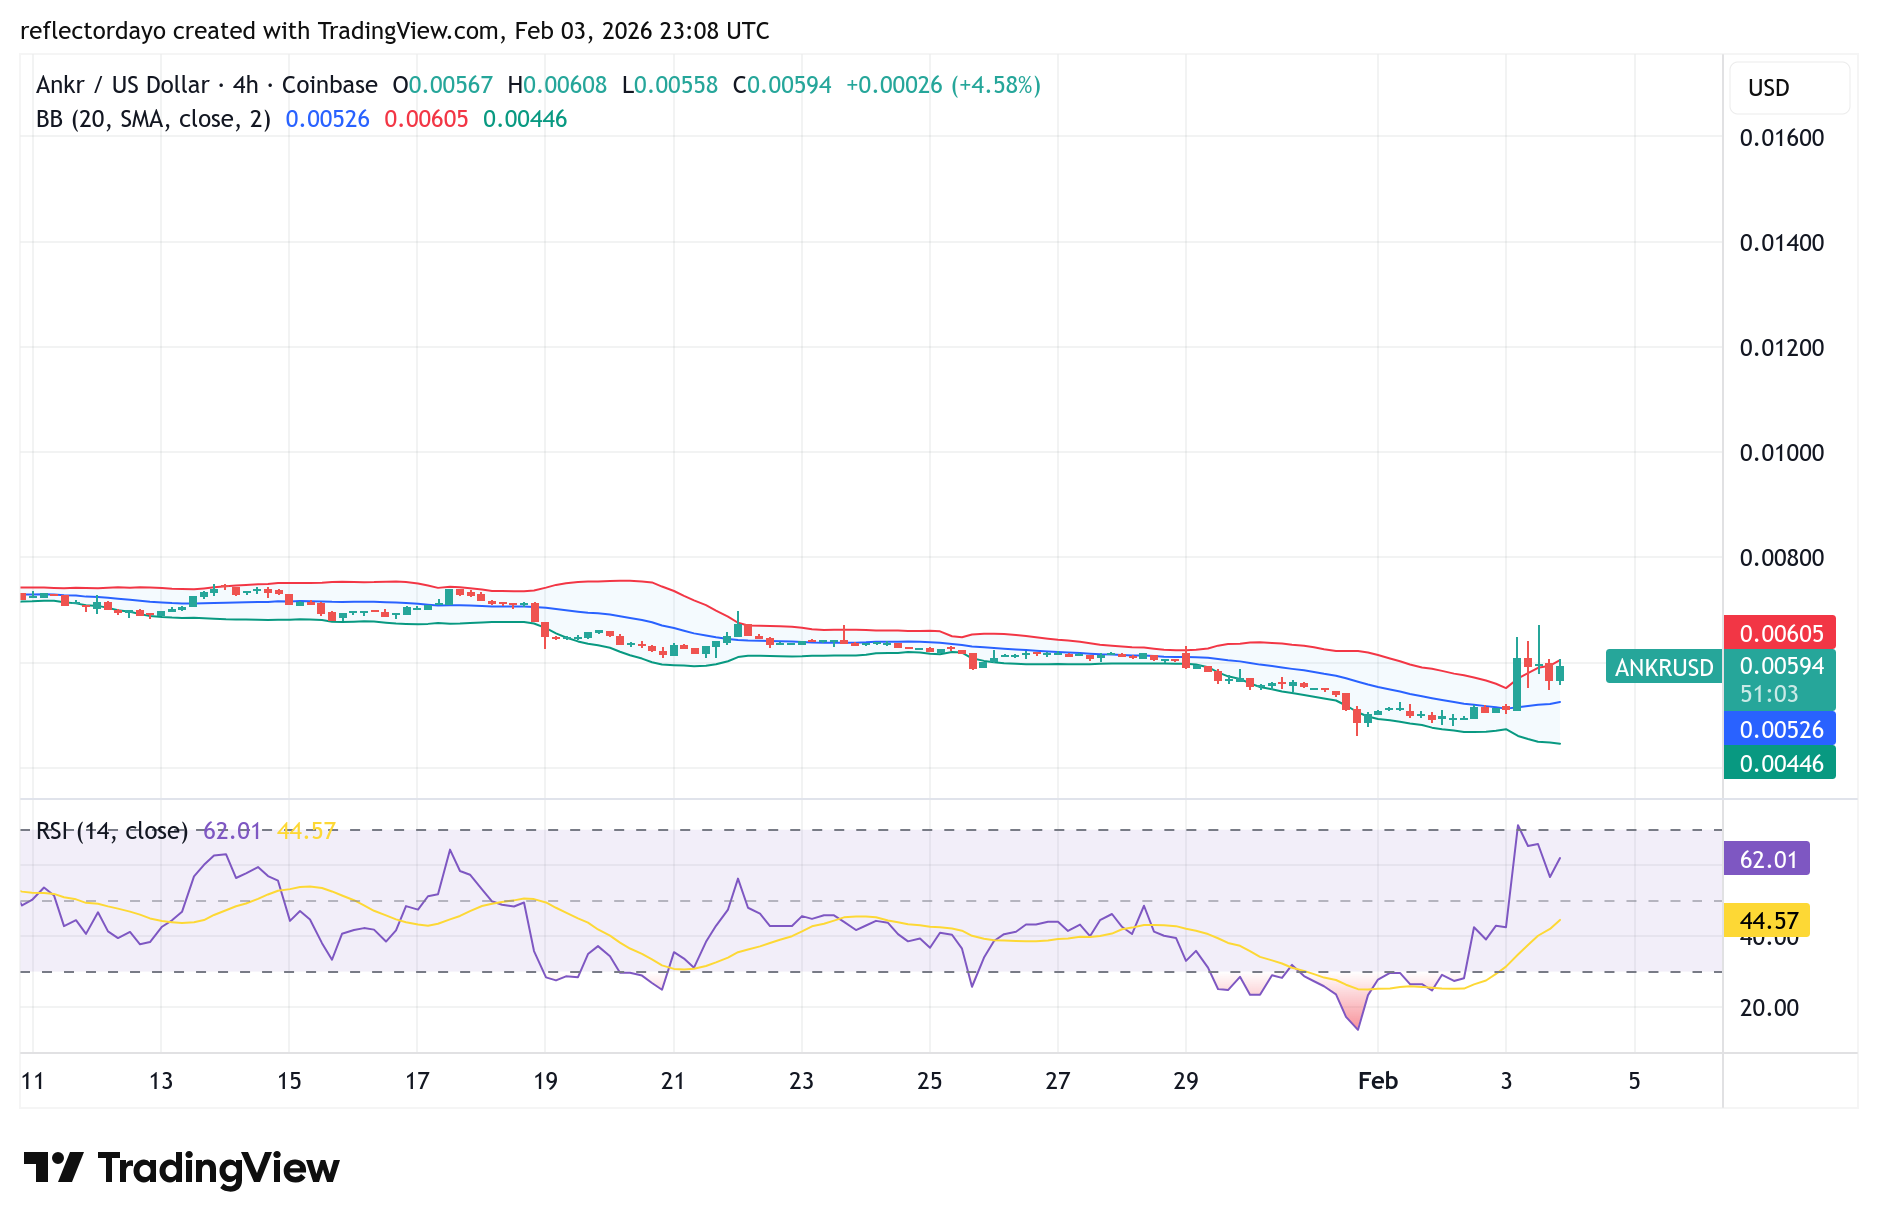
ANKR/USD 4-Hour Chart Outlook
When the market is viewed on the 4-hour chart, a clear struggle between demand and supply emerges around the $0.06 price level. Price action is actively fluctuating around this zone, highlighting its importance as a near-term decision point. This behavior suggests that neither bulls nor bears have gained full control, and the battle for dominance at this level remains ongoing.
Amid this uncertainty, traders should closely monitor whether the market can sustain a move above the $0.06 level, as a successful hold above this zone would help confirm the strength and continuation of the bullish recovery.
CoinMarketCap 20 Index Price Analysis – February 02, 2026
The CoinMarketCap 20 Index continues to trade under sustained bearish pressure, with price action rejecting below the $177.00 pivot and compressing into a narrow range near $161.00 key level. Sellers remain in control across multiple timeframes, and momentum indicators lean decisively bearish. However, early oversold signals are starting to emerge, suggesting that a short-term relief bounce is possible if demand re-enters the market.
CoinMarketCap 20 Index Daily Chart (Daily Key Levels):
Support Zones: $154.40, $140.00 Resistance Zones: $176.90, $202.80
CoinMarketCap 20 Index Long-Term Trend – Bearish (Daily Chart)
The CoinMarketCap 20 Index is currently trading around $161.62, up approximately 2.58% on the session after printing a bounce candle. On the daily timeframe, the Money Flow Index (MFI) remains suppressed, indicating weak inflows and lack of strong buying support despite the intraday recovery attempt.
Stop buying ALT coins. Buy CMC20 and have peace of mind.
The PPO histogram remains negative at -2.02%, confirming that bearish momentum is still in force. Price recently printed a sharp rejection from $202.80 and has been forming consistent lower highs throughout the entire range. This shows a structure typically associated with seller dominance and weak buyer participation.
From a structural perspective, the market remains in a defined downtrend. A failure to reclaim $176.97 with conviction increases the likelihood of continued downside pressure. The next major support lies at $154.43, with a deeper target toward $140.00 if that level fails to hold.
Alternatively, a clean reclaim of $176.97 with volume and follow-through would reduce short-term bearish bias. It could spark a short-covering rally toward $202.83 and eventually $227.39.
CoinMarketCap 20 Index Short-Term Trend – Bearish (4 Hour Chart)
On the 4 Hour timeframe, the CoinMarketCap 20 Index is showing persistent short-term weakness. Price is trading near $161.60 with lower highs and lower closes developing across the recent range.
The MFI reading shows limited participation, reflecting subdued buying pressure at the intraday level. The PPO histogram is negative at -2.76%, confirming short-term bearish momentum remains intact. The intraday range is defined between $154.40 and $176.90, with the $161–$163 zone acting as a short-term order block. A break below $154.43 with expanding volume and failure to reclaim it would likely lead to a sweep toward $140.00 or lower.
CoinMarketCap 20 Index Market Statistics Current Price: $161.60 Market Capitalization: $480 Billion 24H Trading Volume: $32 Billion