PI/USD Price Analysis: PI/USD Expands Strongly to the Downside After Accumulation Phase
PI/USD entered a bearish trend after a descending triangle formed at the price level of $0.3420. Price broke below with momentum, which led to consolidation that was later broken to the downside.
PI/USD Key Levels
Support Levels: $0.1960, $0.1570 ResistanceLevels: $0.2750, $0.3420
On the daily timeframe, the upper and lower Bollinger Bands are tightly compressed (accumulation phase) near the price level of $0.1960, signaling the expansion that followed.
On the daily timeframe, a double top formed at the price level of $0.2750. The neckline of the pattern was broken and later retested, signaling that bears are in control of the market. At the support level of $0.1580, the volume indicator decreases, suggesting there may be a pullback before trend continuation.
Market Expectation
On the 4-hour timeframe, price is in the overbought zone on the Stochastic Relative Strength Index (Stoch RSI), signaling that the pullback may be over and price could continue lower. Price is below the 20-period Simple Moving Average (SMA), confirming the downtrend remains intact and that price may break below the $0.1530 support zone.
Note:Cryptosignals.org is not a financial advisor. Do your research before investing your funds in any financial asset or presented product or event. We are not responsible for your investing results.
CHZ/USDT Price Analysis: CHZ/USDT Reacts After Testing a Key Resistance Zone
CHZ/USDT pushed higher with strong momentum before meeting heavy resistance near the $0.0625 supply zone. After the rejection, price formed a change of character (CHoCH), signaling a possible shift from bullish to bearish structure.
CHZ/USDT Key Levels
Support Levels: $0.0435, $0.0340 Resistance Levels: $0.0575, $0.0600
On the daily timeframe, price shows exhaustion after the rally and rejection from the upper resistance zone at $0.0600. Candles are forming below the moving average, confirming that bullish momentum is weakening. The market is also reacting around a prior order block at $0.0500, which acted as short-term resistance.
The daily timeframe also shows the Stochastic Relative Strength Index (RSI) in the overbought zone when the market reached the Order Block (OB) at the price level of $0.0460. This may signal a pullback toward the OB at $0.0490, followed by possible downtrend continuation. Price reacting near the lower band of the Bollinger Band also shows another pullback signal.
Market Expectation
On the 4-hour timeframe, price formed a change of character (CHoCH) and a bearish break of structure (BOS). The OB at $0.0500 was retested as a resistance zone before the market continued the downtrend. There is a decrease in volume during the pullback near $0.0500. All these confirm a bearish structure.
Note:Cryptosignals.org is not a financial advisor. Do your research before investing your funds in any financial asset or presented product or event. We are not responsible for your investing results.
MANA/USDT Price Analysis: MANA/USDT Sweeps Both Buy-Side and Sell-Side Liquidity
MANA/USDT broke above the price level of $0.1730 and then below the price level of $0.1170, signaling a liquidity sweep. A candlestick broke below the support at $0.1170 with a long wick, while the following candles remained within the breakout candle.
MANA/USDT Key Levels
Support Levels: $0.1700, $0.3540 Resistance Levels: $0.2440, $0.1150
The daily timeframe shows a downtrend from a falling wedge pattern that lasted from October to December, and price reached the $0.1150 support zone, which triggered a reversal attempt. Price then returned to the support zone to grab liquidity.
On the daily timeframe, the Stochastic Relative Strength Index (Stoch RSI) further confirms the fakeout since price near the support level of $0.1160 is in the oversold zone. Although the market was rejected from the Order Block (OB) at the level of $0.1700, price may rise again toward the OB near $0.1900.
Market Expectation
On the 4-hour timeframe, near the support level of $0.1500, the fake breakout formed a double bottom pattern. This structure at a support zone is a strong reversal signal. Price also hit the lower Bollinger Band twice, signaling a potential move toward the upper band. All these support that a bullish trend is likely to develop soon.
Note:Cryptosignals.org is not a financial advisor. Do your research before investing your funds in any financial asset or presented product or event. We are not responsible for your investing results.
Tron (TRON/USD) continues to trade under sustained bearish pressure, with price action rejecting below the $0.3000 pivot and compressing into a narrow range near $0.2800. Sellers remain in control across multiple timeframes, and momentum indicators lean decisively bearish. However, early oversold signals are starting to emerge, suggesting that a short-term relief bounce is possible if demand re-enters the market.
TRON/USD Daily Chart (Daily Key Levels):
Support Zones: $0.2790, $0.2690 Resistance Zones: $0.2970, $0.3080
TRON/USD Long-Term Trend – Bearish (Daily Chart)
TRON/USD is currently trading around $0.2801, down approximately 0.99% on the session. On the daily timeframe, the Money Flow Index (MFI) sits near 18.74, indicating weak inflows and lack of strong buying support.
Bias: Short
Entry: 0.2887 – 0.2905 (sell the pullback)
Targets:
• 0.2820
• 0.2770
• 0.2715
SL: Above 0.2905
Logic: Dump already in. Pullback into resistance = sell zone.
Below 0.2905, sellers stay in control.
No breakout, no hero trades. pic.twitter.com/12wtjX9lsK
The PPO histogram remains negative at -0.93%, confirming that bearish momentum is still in force. Price recently printed a long bearish candle that rejected near $0.3080 and closed near the session low. This shows a structure typically associated with seller dominance and weak buyer participation.
From a structural perspective, the market remains in a defined downtrend. A failure to reclaim $0.2970 with conviction increases the likelihood of continued downside pressure. The next major support lies at $0.2795, with a deeper target toward $0.2694 if that level fails to hold.
Alternatively, a clean reclaim of $0.2970 with volume and follow-through would reduce short-term bearish bias. It could spark a short-covering rally toward $0.3085 and eventually $0.3200.
On the 4 Hour timeframe, TRON/USD is showing persistent short-term weakness. Price is trading near $0.2800 with lower highs and lower closes developing.
The MFI is oversold at 24.50, reflecting intense selling pressure at the intraday level. The PPO histogram is negative at -0.83%, confirming short-term bearish momentum. The intraday range is defined between $0.2790 and $0.2850, with the $0.2795–$0.2805 zone acting as a short-term order block. A break below $0.2790 with expanding volume and failure to reclaim it would likely lead to a sweep toward $0.2750 or lower.
TRON/USD Market Statistics
Current Price:$0.2800 Market Capitalization: $24.2 Billion 24H Trading Volume: $487 Million
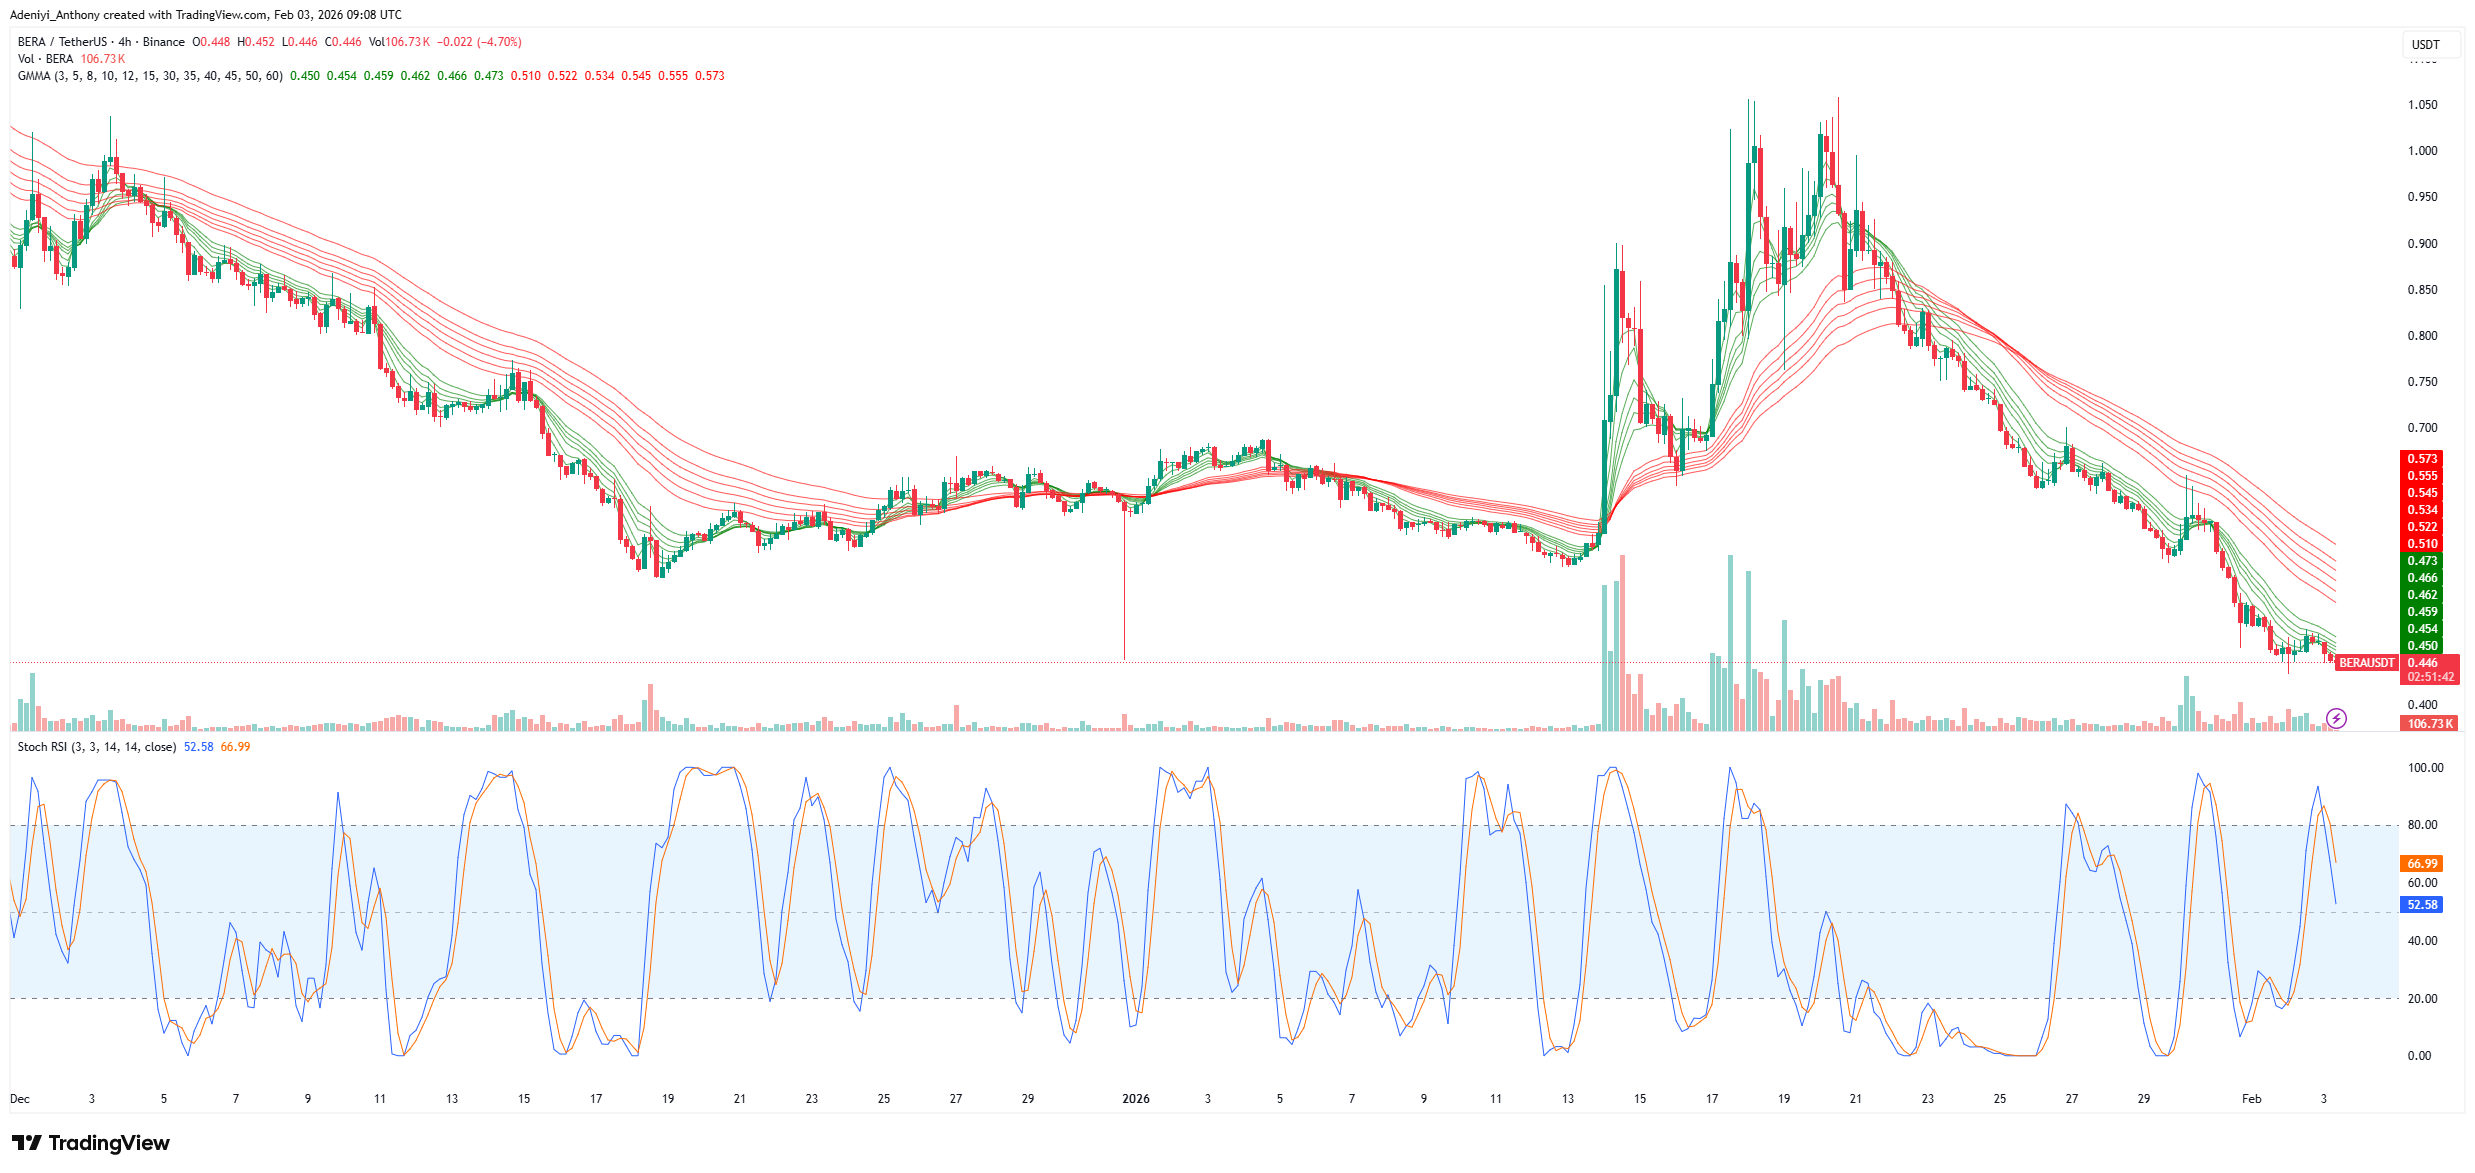
Berachain (BERA) is having a time staying above support levels with a stark 31% drop this week, significantly underperforming the 4.20% recovering crypto market. However, it appears that the Berachain price has seen another 24-hour decline, as the price dropped 1.62%, with investor sentiment remaining deeply bearish due to technical weakness.
As it stands, the primary concern at the moment remains the $30.8 million token unlock, a 41.7% increase in circulating supply into the market. To this end, this massive influx of sellable tokens creates high dilution risk and heavy selling pressure, leaving BERA in a dangerous position as it trades well below key support levels.
Major Resistance Levels: $0.550, $1.060, and $1.200
Major Support Levels: $0.430, $0.400, and $0.300
Technical Analysis
On the 4-hour timeframe, Berachain against Tether appears to be stuck in a downward-sloping pattern. The Guppy Multiple Moving Averages (GMMA) seems to be trending downward with increasing momentum as the gap between the sets of Exponential Moving Averages widens.
Additionally, the Stochastic RSI signals that the momentum favors the sellers as the lines head south. To this end, if the price stays above $0.45, it could finally start to bounce back soon.
Meanwhile, @Cexscan reported in a recent post on X that Berachain (BERA) was facing a significant downtrend. The firm noted that the Berachain price appears to be trading below its key Exponential Moving Averages (EMAs), signaling a bearish sentiment. Also, the relative strength index seems to be exhibiting bearish momentum despite the steadiness in the market. To this end, it was concluded that BERA’s technical indicators suggested continued downward pressure and weakness in its current price action.
Technical Analysis: BERA/USDT
Executive Summary
Berachain (BERA) is currently experiencing a significant downtrend, trading below its key Exponential Moving Averages (EMAs) and exhibiting bearish signals from the Relative Strength Index (RSI). Despite a relatively stable market… pic.twitter.com/ZCbmhK5Egc
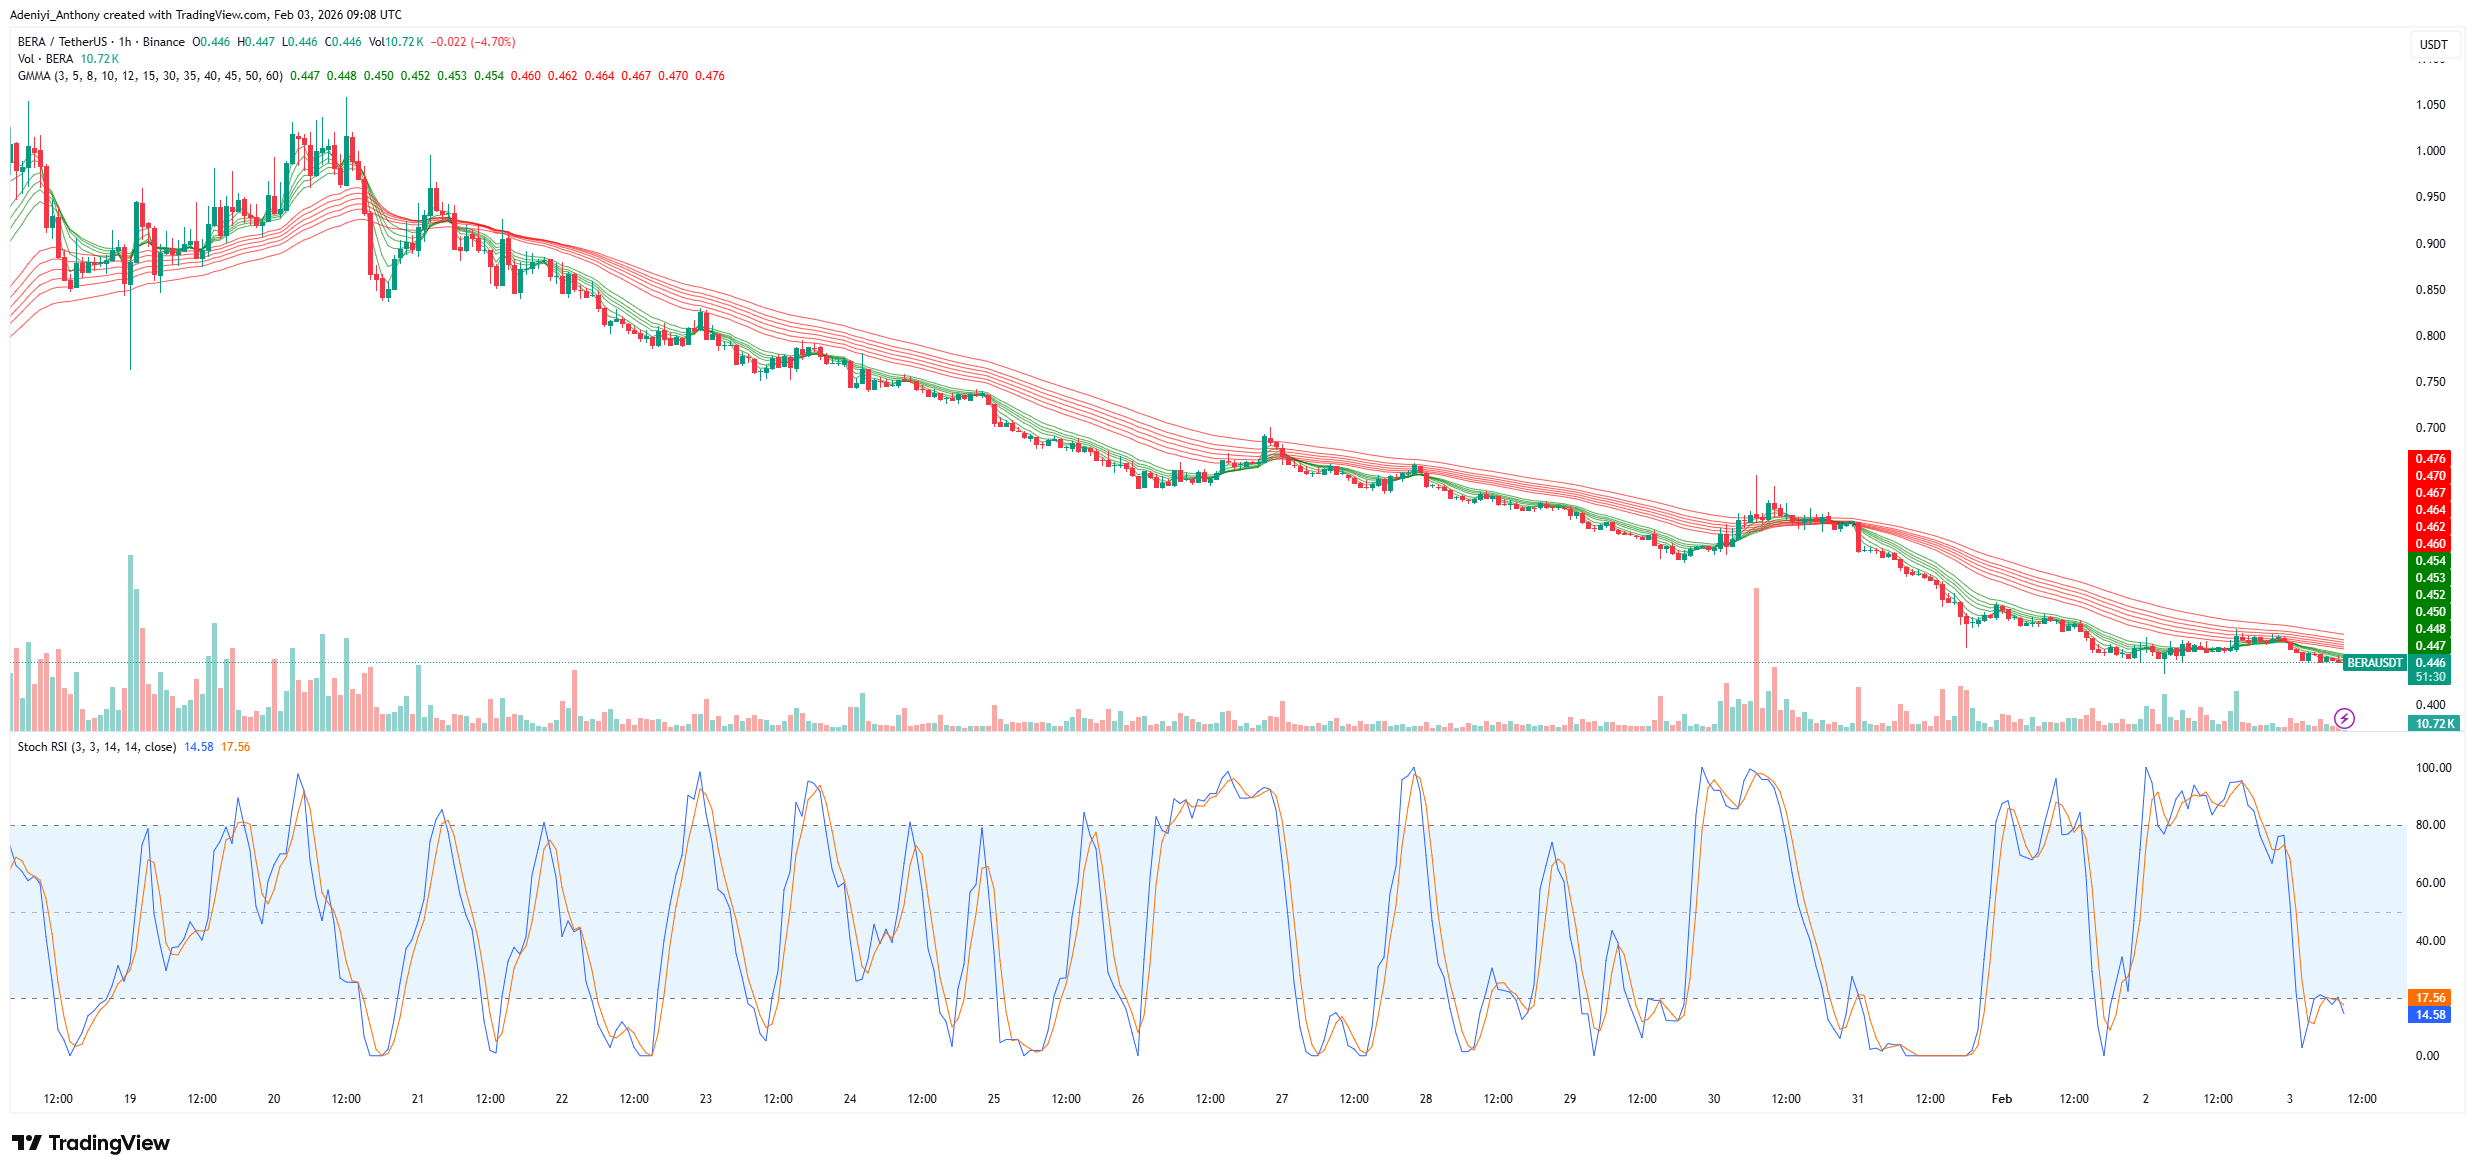
On the hourly chart, BERA/USDT analysis showed that the price is moving sideways. Berachain price appears to be squeezing between $0.45 and $0.48, a pattern that precedes a quick up or down. The GMMA seems to be exhibiting a sign that impending relief is on the horizon, with the price still operating within the bearish structure.
However, the momentum oscillator signals an oversold condition, suggesting a bounce in the coming session, provided the pair manages to hold above the $0.45 mark. To this end, a break below the current level would signal a move towards $0.300.
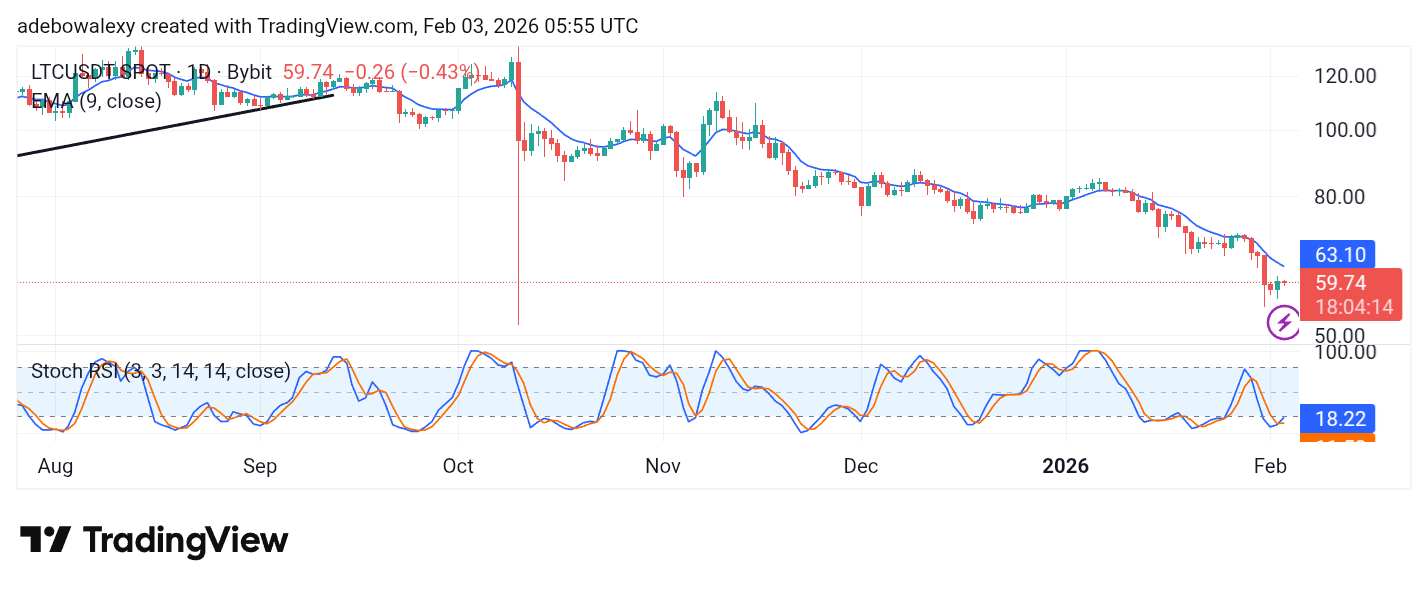
The crypto market was shaken as Bitcoin’s price collapsed below the $80,000 baseline. This development also influenced the Litecoin market, sending its price action crashing through the $60 level. More details about the market are outlined below.
LTC/USDT Long-Term Trend — Bearish (Daily Chart)
Key Price Levels
Resistance: $65, $70, $75
Support: $55, $50, $45
The Litecoin market edged lower over the previous session. Currently, the token trades below the 9-day Exponential Moving Average (EMA) line. The ongoing session is represented by a small red price candle. Even so, the market still stands slightly above the base of the previous session. Meanwhile, the Stochastic Relative Strength Index (SRSI) indicator lines maintain an upward bias following an upside crossover in the oversold region.
Litecoin (LTC) Price Prediction: LTC/USDT May Be Yielding Bearish Pressure Already
Observing the daily chart, downward forces appear to be prevailing in the ongoing session. The latest price candle is red and has formed below the 9-day EMA curve. This move followed a brief pullback attempt by the bulls.
However, bearish activity remains limited, and as a result, the SRSI indicator lines remain tilted upward. Nonetheless, the fact that price action remains below the 9-day EMA curve continues to threaten bullish prospects.
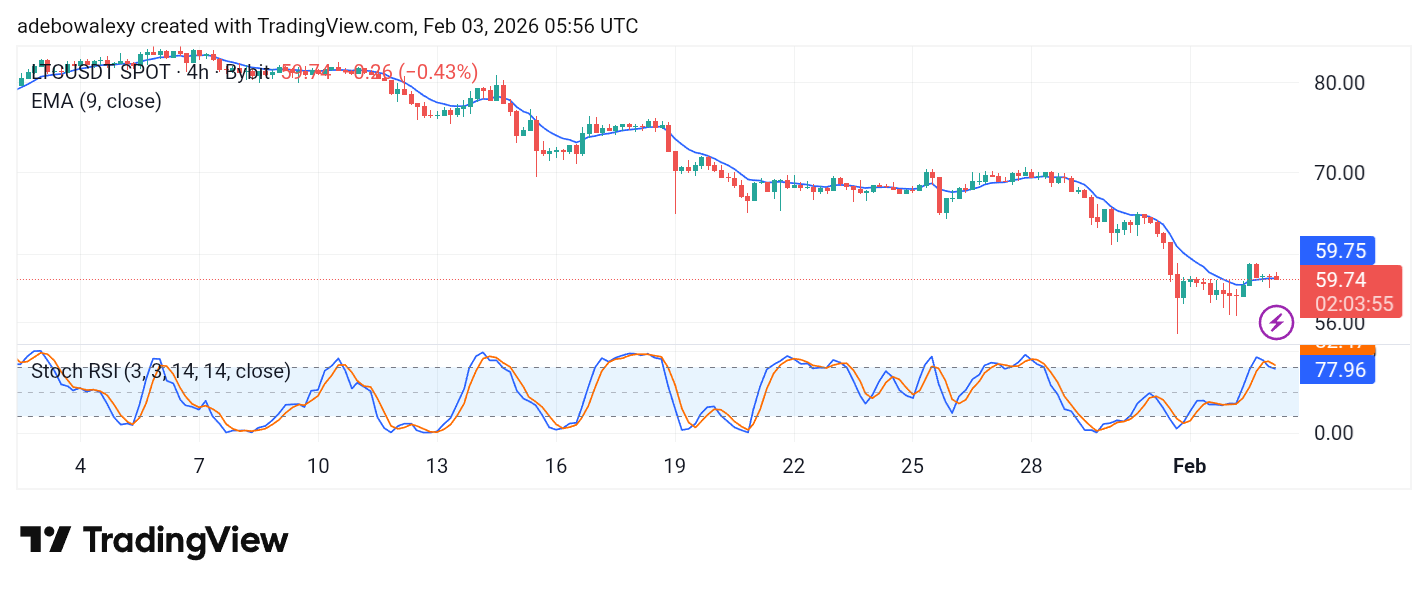
Litecoin (LTC) Price Prediction: LTC/USDT Crawls Sideways Above the EMA (4-Hour Chart)
The Litecoin 4-hour chart indicates that bearish pressure is still present. The most recent price candles are bearish but remain just above the 9-day EMA line.
Meanwhile, the SRSI indicator lines have delivered a downward crossover and are now pushing toward lower levels. Although the SRSI remains in the overbought region above the 80 mark, the slight dip of the latest price candle just below the 9-day EMA suggests weakness. Despite this, traders may still anticipate a rebound above the $60 level toward the $65 mark in the short term.
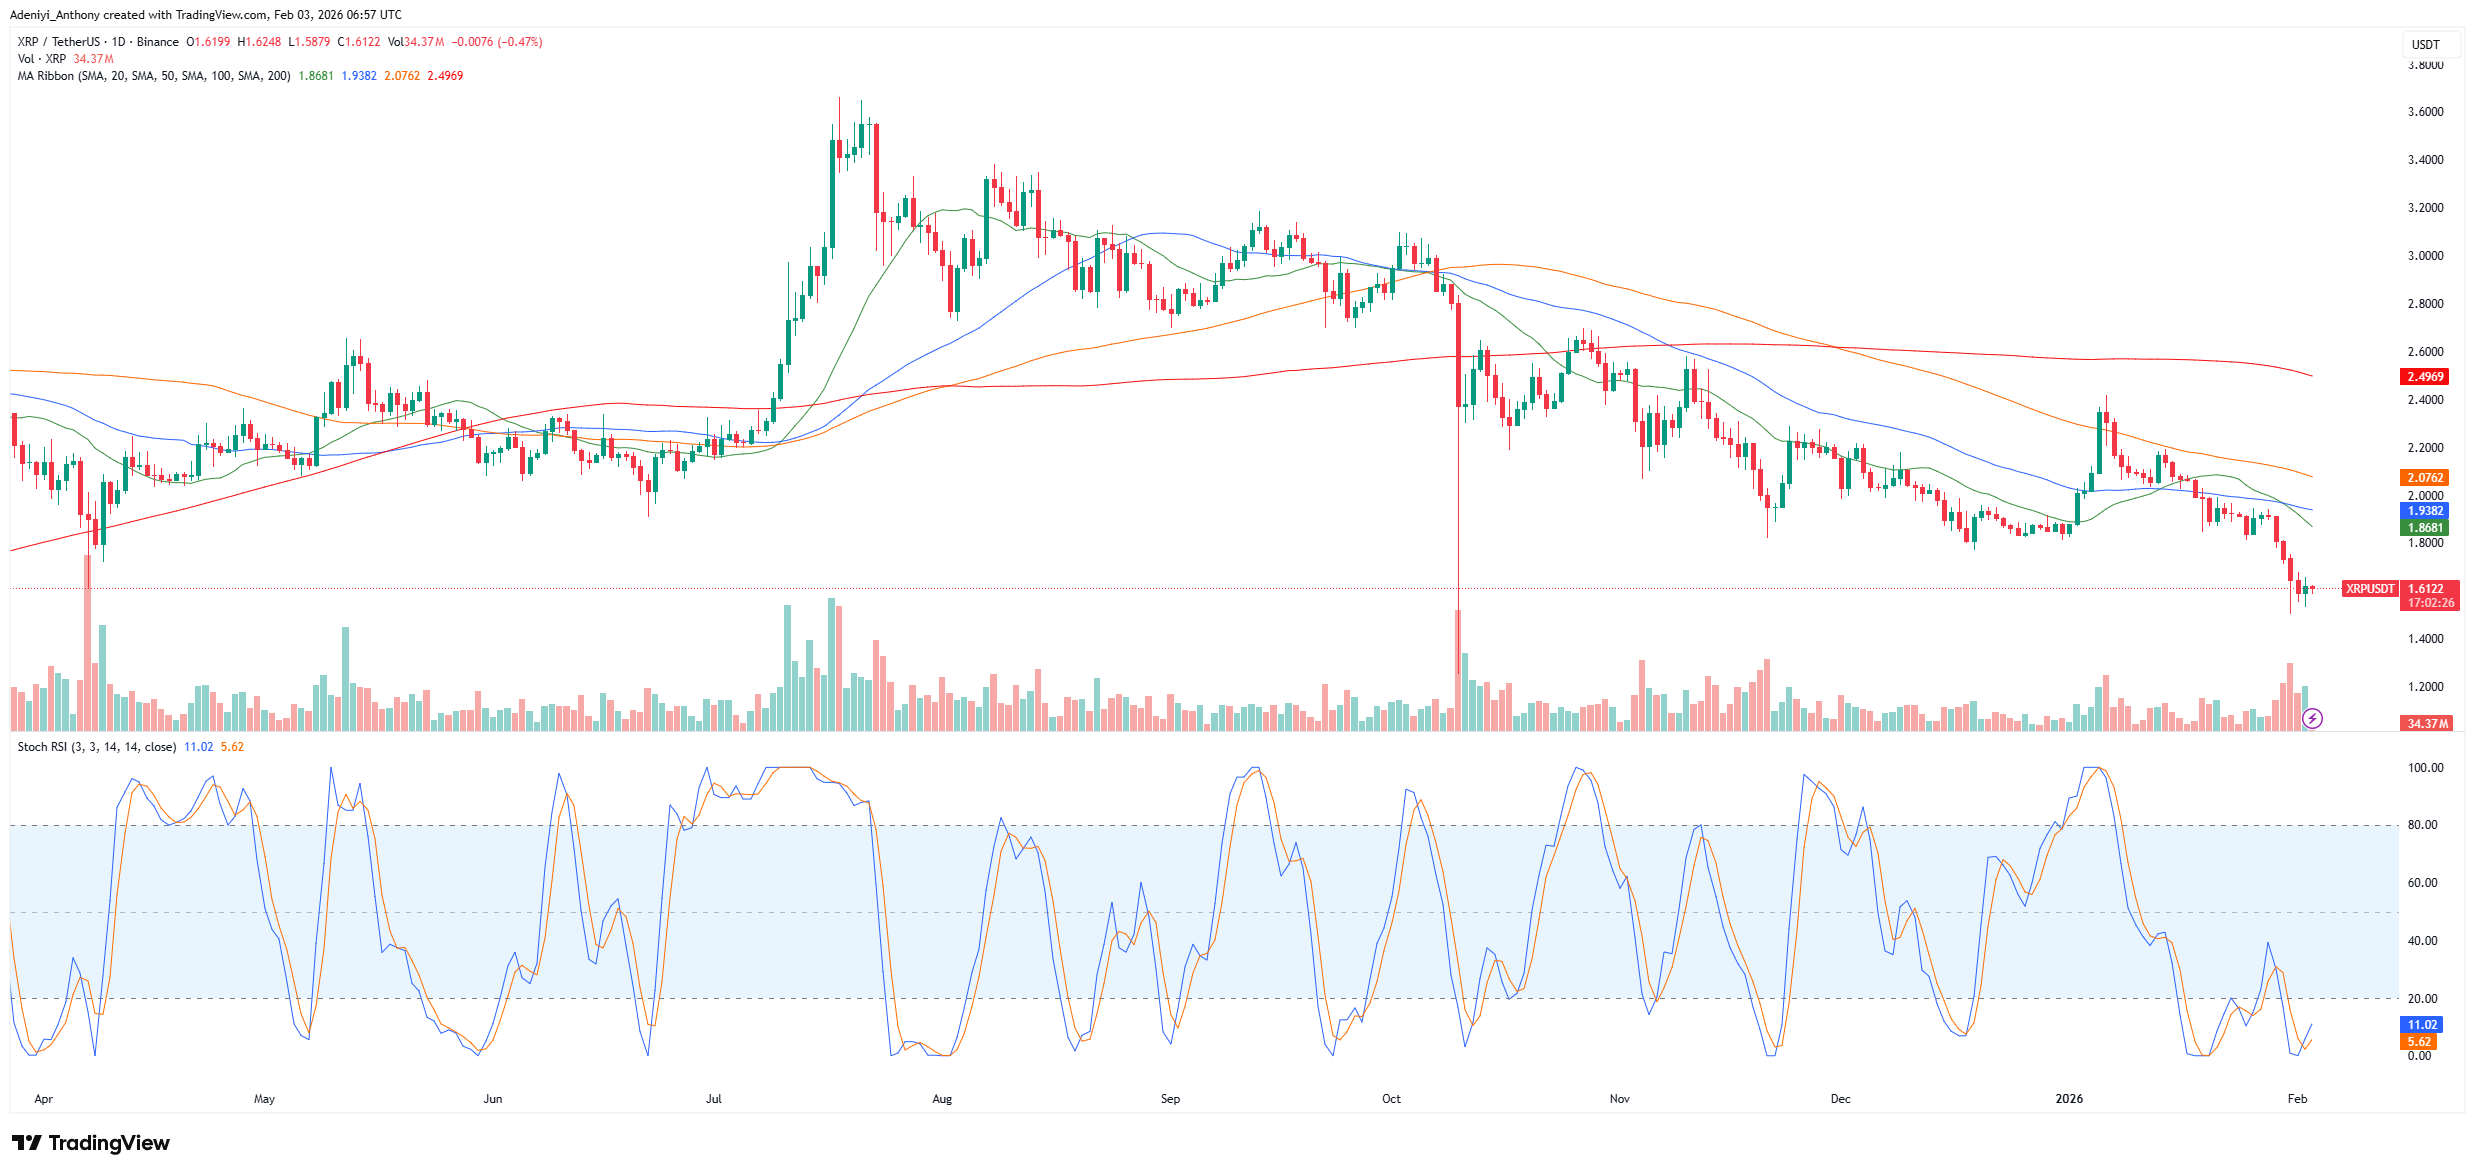
In the last 24 hours, XRP prices have recorded a 4.29% rise following a technical rebound. However, despite the bounce and alignment with the broader market crypto rise, the token is still down by 15% from the weekly perspective.
Meanwhile, the propelling factor for this rise appears to be favorable Japanese regulatory sentiment towards Ripple and improved activities from large investors, which have culminated in an improvement in the relative strength index condition.
Currently, XRP trades at $1.6122 with over 34 million traded volumes on the daily chart.
XRPUSDT-Daily Chart
Technical Indicator
Major Resistance Levels: $1.86, $2.07, and $2.49
Major Support Levels: $1.60, $1.42, and $1.25
Technical Analysis
On the daily chart, the XRP price is currently navigating a distinct bearish trend on the daily timeframe despite recent gains. As it stands, the price appears to be situated below all major moving averages, indicating that the downside pressure still persists.
Meanwhile, the Stochastic RSI shows an oversold condition with an improving sign of recovery at the bottom. This indicates that while XRP is technically oversold, a bullish reversal is forming. To this end, an increased bullish participatory level is needed for a confirmed break above $1.86; the current trend continues.
XRP Price News Before the Breakout Attempt
Analysis of XRP price shows the token is currently testing a critical Fibonacci support level at $1.55. This is a floor established during the broader Wave 4 correction that began in January 2025. However, while the current bounce remains muted, technical indicators suggest the move down could be nearing completion.
Additionally, the token’s projection shows that a confirmed structural shift into five upward waves could eventually target a major resistance zone between $2.69 and $2.84, with a long-term goal of $5.00+. However, caution is advised, as the market may still form a standard ABC structure.
Meanwhile, it was reported that a successful defense of this $1.55 zone and a break above the immediate resistance range of $1.64 to $1.89 would signal the potential start of a bullish Wave 5.
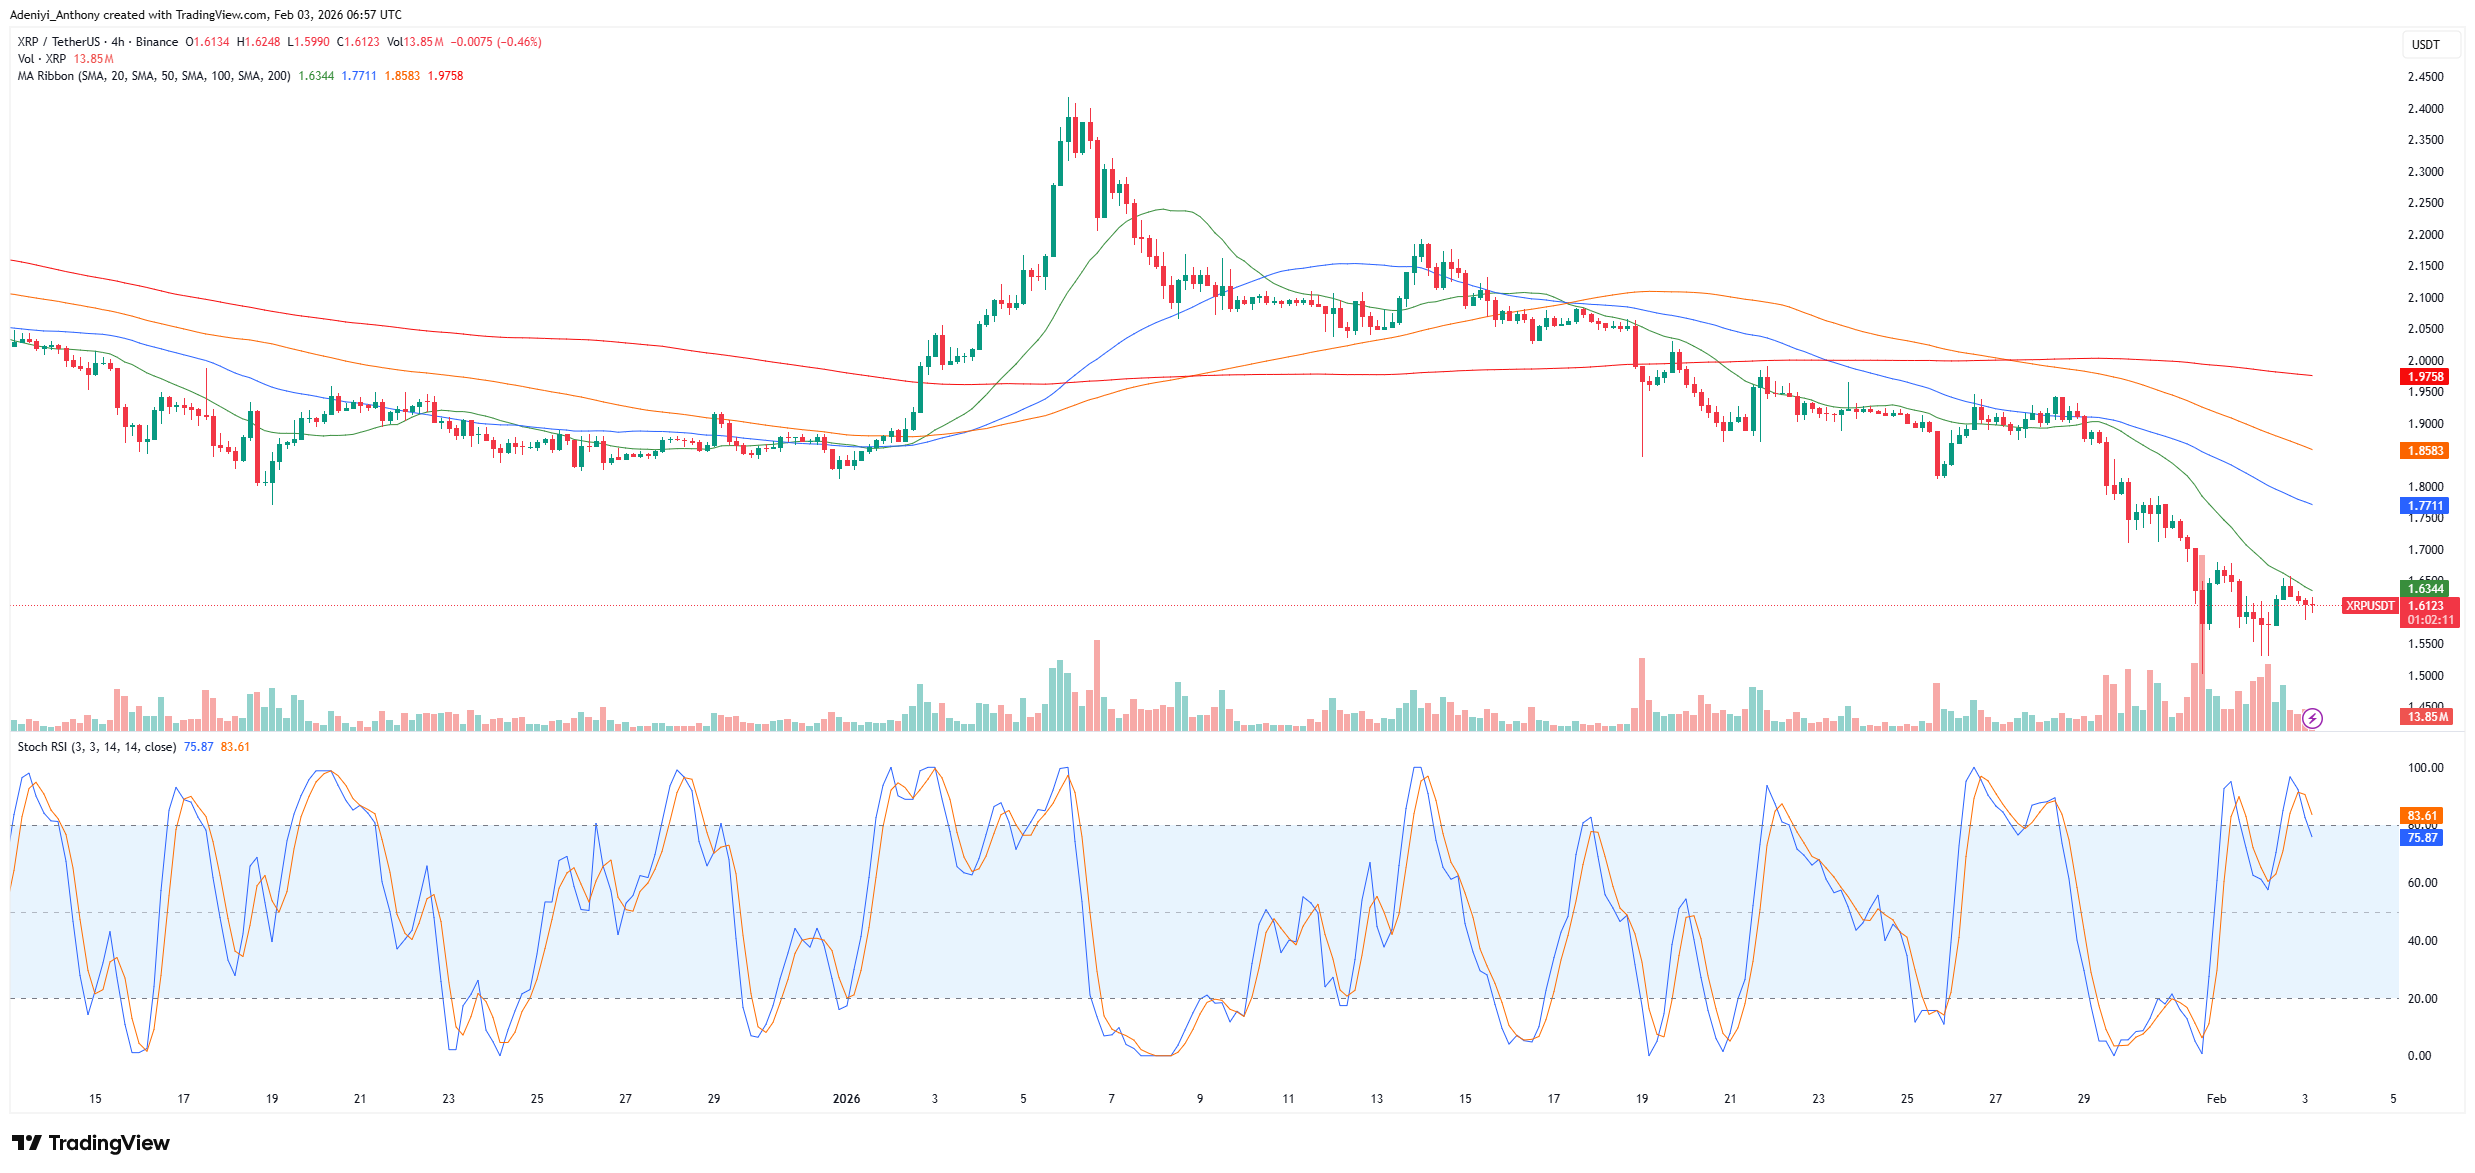
The XRP price on the 4-hour chart seems to be going into a sharp bearish correction after a prolonged consolidation. The price action indicates that after a significant drop from the $2.35 peak seen in early January, the XRP/USDT has entered a lower-low sequence, failing to hold above the psychological support of $1.80, and is currently grappling with a local support zone between $1.60.
From the momentum side, the Stochastic RSI signals an overbought region with the lines pointing to the south. This suggests a $1.25 downside risk without a significant increase in buying volume to reclaim $1.80.
Women are championing various fields, and financ is no exception. Naturally skilled planners, women often approach trading with structure and discipline—qualities that make well-planned trades more profitable. In financial markets, women are steadily reaching new heights, gaining greater control over their finances and increasing their participation in trading and investment activities.
According to available data, about 5 out of every 100 crypto traders are women, while approximately 20 out of 100 forex traders are female. In the U.S. stock market, women accounted for roughly 15 out of every 100 traders, based on reports published in 2021. Another report indicated that by 2023, about 60% of women in the United States were involved in stock trading, up from 44% in 2018. Overall, women currently represent an estimated 12–15% of active traders globally.
More Women Are Becoming Successful Traders: Why?
Over the years, trading has evolved significantly. Success is no longer about taking the biggest risks; instead, it revolves around process, patience, and discipline—areas where many women excel.
This shift matters because:
Trading rewards proper planning over aggression
Risk management is more important than speculation
Consistency outweighs one-time large wins
Many women approach trading as a professional obligation rather than a form of gambling. They tend to avoid emotional decision-making, manage losses carefully, and plan trades methodically.
This mindset is especially common among professional women who already value discipline, structure, and accountability in their careers. As financial markets become increasingly data-driven, these strengths translate naturally into strong trading performance. As a result, more women are gaining credibility and respect in trading, as modern markets reward analytical thinking and consistency—not noise or bravado.
The Best Female Traders in the World
When people think of legendary traders, names like George Soros, Stanley Druckenmiller, and Paul Tudor Jones often come to mind. However, there are also influential women who have made significant contributions to trading, finance, and philanthropy.
Tamiko Bolton Soros
Tamiko Bolton Soros, the wife of George Soros, began her career in online entrepreneurship before later collaborating with Soros on various initiatives. Through her involvement in writing projects and support of the Open Society Foundations’ mission, she exemplifies how women can contribute meaningfully to global empowerment and social impact.
Kathy Lien: A Standout in Global Trading
Kathy Lien ranks among the world’s top forex traders, regardless of gender. Her success reinforces a simple truth: sustainable profits are built on deep market knowledge. She began her career at just 18 and has held key roles at institutions such as JPMorgan, FXCM, and other forex-focused firms, each sharpening her understanding of financial markets.
Beyond trading, Kathy Lien is widely respected as a leading forex analyst and author. Her books focus on practical, actionable strategies and have become essential resources for aspiring traders. Notable titles include High Probability Trading Setups for the Currency Market, Millionaire Traders: How Everyday People Are Beating Wall Street at Its Own Game, Day Trading, and Swing Trading the Currency Market. These works offer a strong foundation for anyone entering the trading world.
Linda Bradford Raschke: A Top Commodity and Futures Trader
Linda Bradford Raschke is another prominent figure in the trading industry. Known for her short-term trading style, she has earned widespread recognition in the commodities and futures markets. She began her trading career in 1981 and launched her own hedge fund in 2002.
As a short-term trader, Raschke places strong emphasis on technical analysis. With over four decades of experience, she possesses a deeply grounded understanding of financial markets. She has authored several influential books, including Street Smarts: High-Probability Short-Term Trading Strategies, Trading Sardines, Professional Trading Techniques, and Building a Trading Foundation, among others.
Jennifer Fan: A Leading Figure in Commodities Trading
Jennifer Fan began her trading journey at a young age and earned her degree from New York University’s Stern School of Business. Her expertise in commodities is rooted in extensive hands-on experience within the sector.
Throughout her career, she has worked with major firms such as Wall Street trading desks, Arbalet Capital, Millennium Management, and Arrowhawk. Her accomplishments earned her a spot on Forbes’ Under 30 list in finance in 2012. Today, she serves as the Chief Investment Officer of a commodity-focused hedge fund managing approximately $650 million in assets.
Jennifer Fan strongly believes that commodity markets influence everyday human behavior. Her insights have inspired many traders to shift their focus from equities to commodities in pursuit of deeper market understanding.
Trading as a Career Path for Women
Trading is often misunderstood as a shortcut to quick wealth, but in reality, it is a profession built on discipline, skill, and continuous learning. For women exploring modern finance careers, trading offers an attractive alternative that values performance over titles.
Its appeal lies in location flexibility, a direct connection between planning and results, and independence from office politics. Trading rewards patience, sound decision-making, and long-term thinking. It can also be viewed as a practical business venture, requiring capital management, strategic planning, and lifelong education—much like running a company.
Successful traders treat the profession with seriousness, maintain realistic expectations, and focus on gradual improvement over time. This mindset transforms trading from a casual pursuit into a sustainable and respected career.
Conclusion
Women possess many of the qualities essential for successful trading, including patience, discipline, and sound decision-making. Today, trading offers an opportunity for personal growth and financial independence.
The women highlighted above achieved success because they remained committed, resilient, and confident in their abilities. Many began without mentors, yet through persistence and conviction, they became successful traders and established their own firms—proving that meaningful success can indeed be built from the ground up.
Stellar Lumens (XLM/USD) continues to trade under sustained bearish pressure, with price action rejecting below the $0.2000 pivot and compressing into a narrow range near $0.1910. Sellers remain in control across multiple timeframes, and momentum indicators lean decisively bearish. However, early oversold signals are starting to emerge, suggesting that a short-term relief bounce is possible if demand re-enters the market.
XLM/USD Daily Chart (Daily Key Levels):
Support Zones: $0.1970, $0.1800 Resistance Zones: $0.2000, $0.2160
XLM/USD Long-Term Trend – Bearish (Daily Chart)
XLM/USD is currently trading around $0.1910, down approximately 3.49% on the session. On the daily timeframe: The Money Flow Index (MFI) sits near 41.91, indicating weak inflows and lack of strong buying support.
Charts like $XLM show 6 + months of protected shorts and appear to be on MM liq harvesting mode with rallies capped before any froth can reemerge. The second some spot demand returns and forces dealers to cover / inventory spot, its a powder keg. Markets waiting on something pic.twitter.com/OtVxIa4Rcv
The PPO histogram remains negative at -2.30%, confirming that bearish momentum is still in force. Price recently printed a long bearish candle that rejected near $0.1996 and closed near the session low. This shows a structure typically associated with seller dominance and weak buyer participation.
From a structural perspective, the market remains in a defined downtrend. A failure to reclaim $0.2000 with conviction increases the likelihood of continued downside pressure. The next major support lies at $0.1974, with a deeper target toward $0.1800 if that level fails to hold.
Alternatively, a clean reclaim of $0.2000 with volume and follow-through would reduce short-term bearish bias. It could spark a short-covering rally toward $0.2165 and eventually $0.2648.
XLM/USD Short-Term Trend – Bearish (4-Hour Chart)
On the 4-hour timeframe, XLM/USD is showing persistent short-term weakness: Price is trading near $0.1916 with lower highs and lower closes developing.
The MFI is oversold at 22.67, reflecting intense selling pressure at the intraday level. The PPO histogram is negative at -0.76%, confirming short-term bearish momentum. The intraday range is defined between $0.1905 and $0.1996, with the $0.1910–$0.1920 zone acting as a short-term order block. A break below $0.1900 with expanding volume and failure to reclaim it would likely lead to a sweep toward $0.1850 or lower.
XLM/USD Market Statistics Current Price: $0.1910 Market Capitalization: $5.65 Billion 24H Trading Volume: $145 Million