Mantle (MNT/USD) Rebounds From Bearish Trendline as Buyers Defend Support

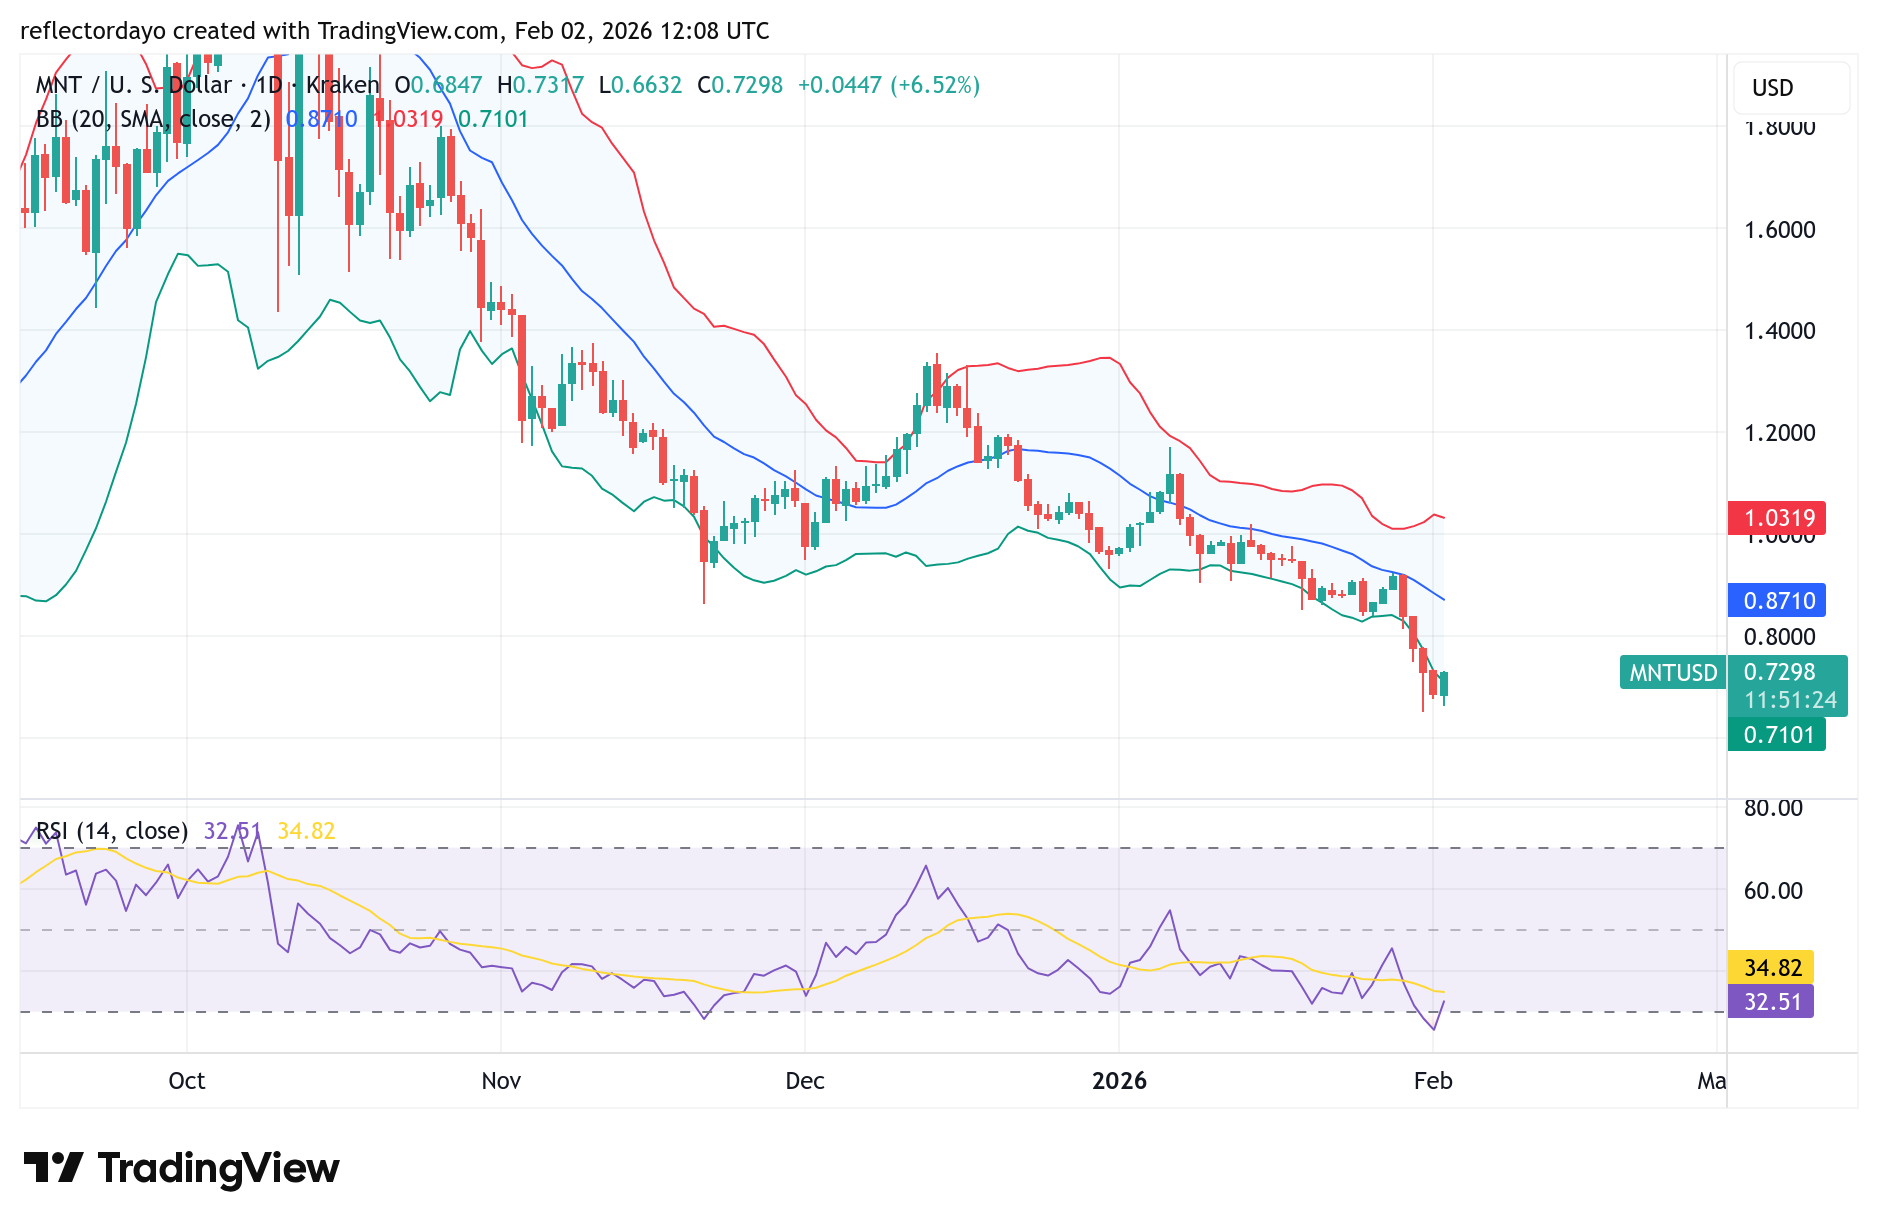
The Mantle market, after spending the previous daily session under bearish pressure, is now beginning to stage a rebound after successfully confirming the pivotal support level around the $0.65 price mark. This support zone was identified in earlier trading sessions—specifically over the last three daily sessions—where price action consistently respected $0.65 despite the ongoing bearish run. The repeated defense of this level has reinforced its importance and has given traders increased confidence to step in and buy the market.

Mantle (MNT/USD) Market Data

  • MNT/USD Price Now: $0.72
  • MNT/USD Market Capitalization: 2.26 million
  • MNT/USD Circulating Supply: 3.3 billion MNT
  • MNT/USD Total Supply: 6.2 billion MNT
  • MNT/USD CoinMarketCap Ranking: #34

Mantle (MNT) Is Facing a Notable Pullback

MNTCoin is experiencing a notable pullback today, with price trending lower as selling pressure intensifies across the market. Currently trading around the $0.80 level, MNT has declined by roughly 10% over the past 24 hours, signaling a clear short-term shift toward bearish sentiment. A drop of this magnitude in a single session suggests that sellers are dominating market activity, likely driven by profit-taking after recent gains or a broader softening in overall market risk appetite. As price momentum turns sharply lower, stop-loss triggers and reactive selling may have further accelerated the decline. The $0.80 zone now stands as an important short-term support area, where traders are closely watching to see whether buyers step in to absorb selling pressure. If price stabilizes around this level, the move could be viewed as a routine correction within a broader structure. However, a decisive breakdown below this zone may signal continued bearish momentum and open the door to deeper retracements. Market sentiment and volume behavior will remain key, as heightened volume during the sell-off would reinforce bearish conviction, while lighter volume could increase the chances of a short-term relief bounce.

Key Levels to Monitor

  • Resistance: $0.80, $0.87, $0.93
  • Support: $0.64, $0.60, $0.55

Mantle (MNT/USD) Rebounds From Bearish Trendline as Buyers Defend Support

Mantle Market Analysis: Technical Viewpoint

Since the breakdown below the $0.95 price level, the Mantle market has continued to form lower highs and lower lows, confirming a prevailing bearish trend. However, in recent trading sessions, the Mantle market gained strong downward momentum, leading to increased volatility. This sharp decline may have created conditions that support a short-term bullish reaction around key support levels.

Real Recognize Real — Made Possible by Mantle Super Portal

Put your $MNT to work the smart way. The Mantle Super Portal unlocks multiple opportunities to deploy your tokens, earn real yields, and stack extra incentives—all from one seamless hub. No complexity, no guesswork—just efficient, effortless access to real on-chain gains.

Smarter. Simpler. Built for results.
Only on @byreal_io 🚀

Technical Viewpoint (Continued)

Traders identified the oversold conditions in the crypto signal and took advantage of buying opportunities near the critical $0.65 support zone. Currently, the ongoing bullish recovery is facing resistance around the $0.72 level. Despite this rebound, the broader outlook for the Mantle market remains bearish. However, if bulls continue to successfully defend the $0.65 support, price action may enter a consolidation phase around this region.

Mantle (MNT/USD) Rebounds From Bearish Trendline as Buyers Defend Support

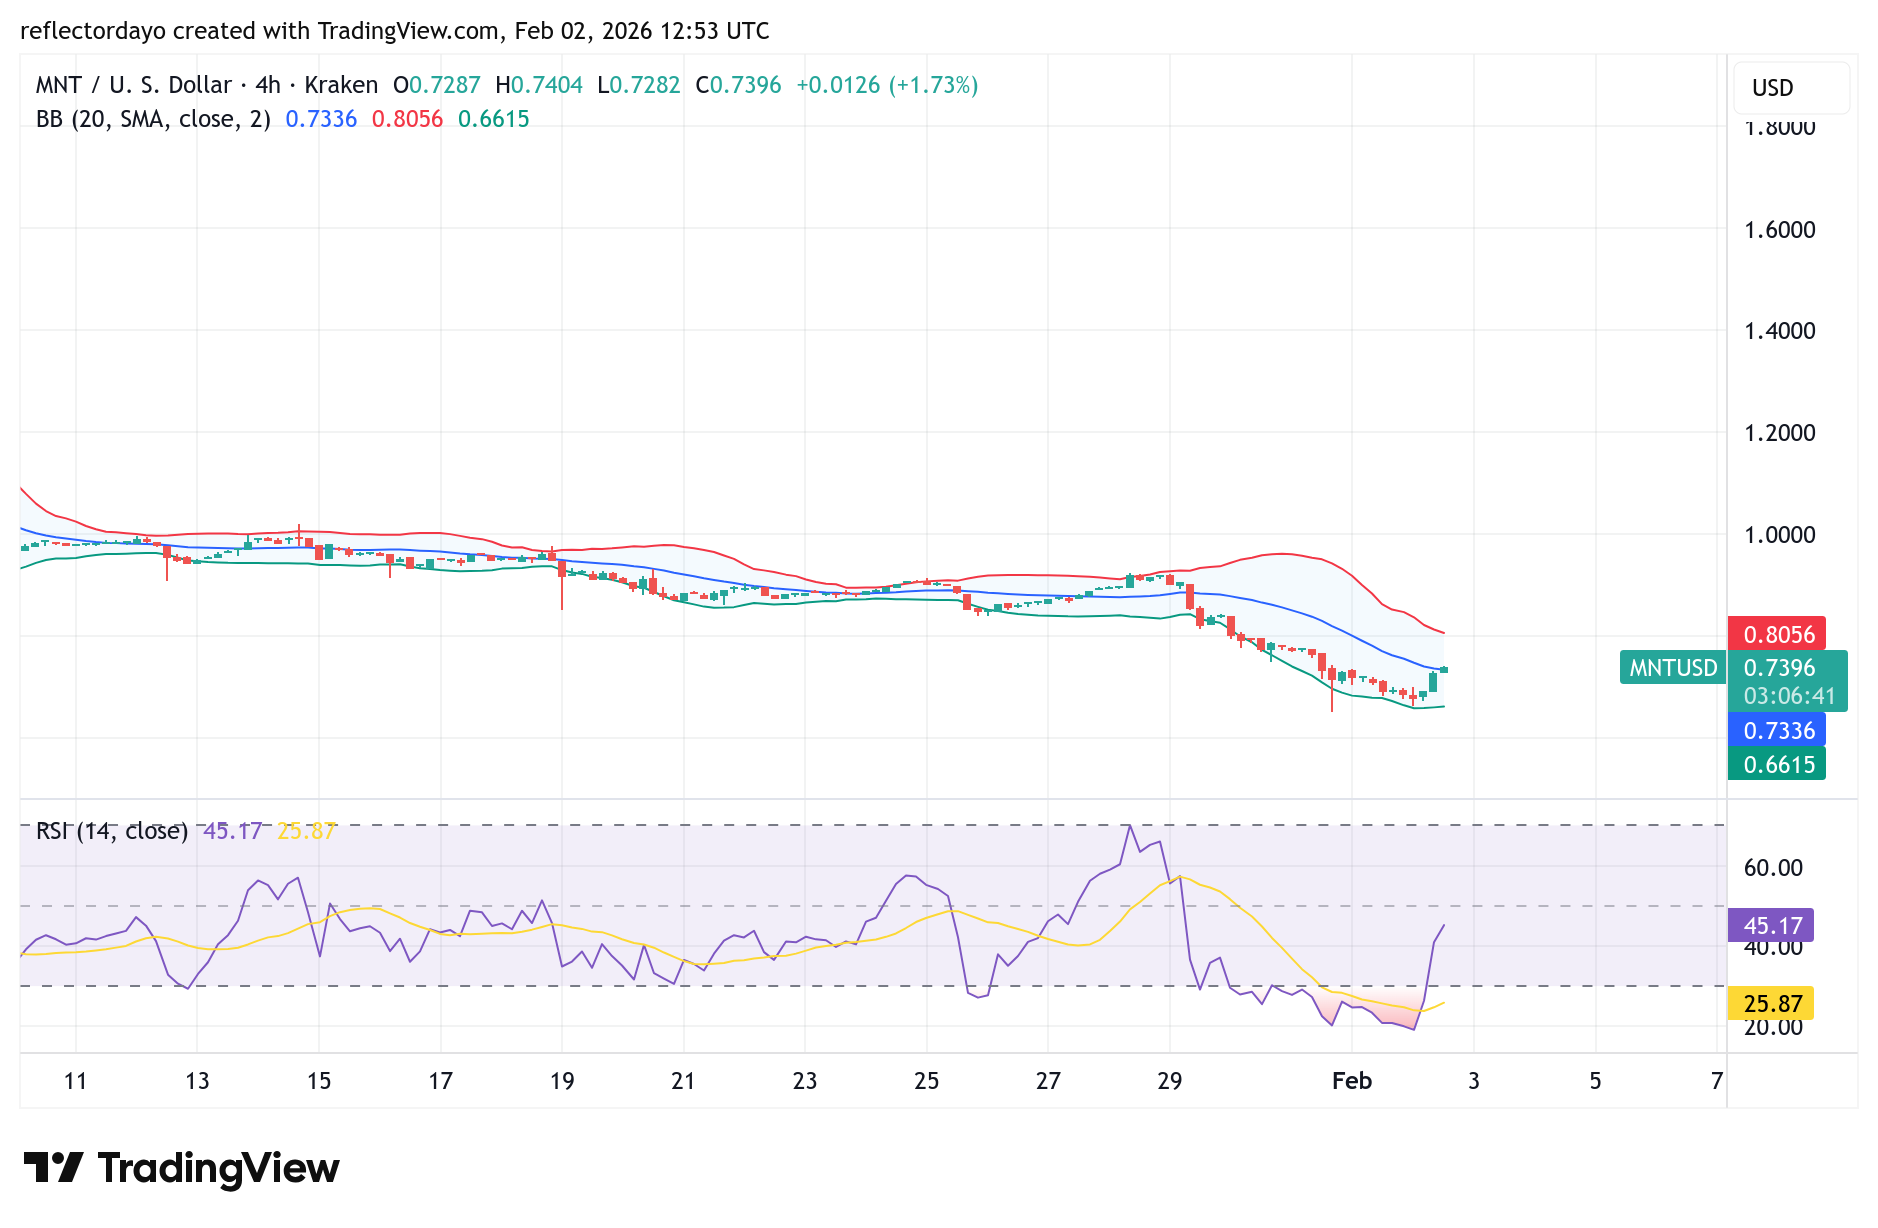
MNT/USD 4-Hour Chart Outlook

The key test for the ongoing bullish recovery lies at the critical resistance level around $0.73. On the 4-hour chart, this level aligns with the 20-period moving average, where the bullish recovery has begun to lose momentum and flatten out. This price behavior suggests that traders are becoming increasingly cautious around this zone.

Should the bullish recovery face rejection at this resistance, while the $0.65 support level remains firmly defended, the market may enter a consolidation phase within this price range.

Trade crypto coins on BYBIT

BNB Price Plummets Toward Critical Support as Sellers Overpower Bulls

The market for BNB against Tether has dropped 5.43% in the last 24 hours, extending its weekly decline to 15%. The market has not seen upside for some time as the BNB price dips below the broader crypto market’s slump. As it stands, it has been noticed that this downturn is primarily fueled by a market-wide selloff triggered by Bitcoin falling below $80,000, suggesting massive capital flow away from altcoins as investors consider other safe assets.

Meanwhile, from the technical perspective, the BNB price has breached key support levels, and while its RSI indicates oversold conditions, no clear reversal sign is in sight. Additionally, it appears that more pressure on this token stems from renewed regulatory uncertainty and shifting perceptions regarding Binance’s leadership.

Currently, BNB trades at $739.36, with more than 133,000 volumes traded on the daily chart.

BNB Price Plummets Toward Critical Support as Sellers Overpower Bulls
BNBUSDT – Daily Chart

Technical Indicators

Major Resistance Levels: $800, $880, and $921

Major Support Levels: $720, $650, and $630

Technical Analysis

Technically, the BNB against Tether on the daily chart remains bearish, as price action continues to be below the 20 to 200 SMAs. As it stands, the stance suggests that the sellers are in control, as the BNB price continues to plummet further.

It has also been observed on the 24-hour timeframe that the sellers are maintaining control of the market. This is noticeable as the bears push the price below the $800 psychological support. However, it appears the current Stochastic RSI condition hints at a possible relief bounce, but the current oversold condition suggests total domination, and until a bullish crossover is spotted, the price has to test the $720 support level.

In a post by @traderteros, it was suggested that BNB is currently in a markdown phase. It was highlighted by the trader as a period of lower highs formation, with the prevalence of strong sell-offs. It was emphasized in the post that the apparent bullish divergences are misleading signs of distribution rather than a market bottom. To this, the trader advises that the prevailing trend remains weak, as the recent bounces lack the necessary follow-through for a reversal.

BNB/USDT Analysis: Downward Trend Intensified as BNB Price Weakens

The market for BNB/USDT on the 4-hour timeframe shows no exception to the daily session. Apparently, the BNB price heads to the south with the cluster of moving averages acting as dynamic resistance. As it stands, even on a shorter timeframe, the bears are establishing their reign. However, the positioning of the Stochastic RSI, though it confirmed immediate bearish action, speaks of an impending bounce.

To this end, if the price fails to hold above the 739-$720 level till the stochastic provides a clearer crossover for the price to reclaim the nearest moving average, more downside could be recorded.

BNB Price Plummets Toward Critical Support as Sellers Overpower Bulls
BNBUSDT – 4H Chart


You can purchase crypto coins here. Buy Crypto

Dogecoin (DOGE) Price Prediction: DOGE/USDT Downward Retracement Breaches the $0.1200 Baseline

Date: February 2, 2026

As the broader crypto market experienced a sharp downturn, the Dogecoin market also faced a significant bearish retracement. As a result, price action quickly dropped below a key psychological support level.

DOGE/USDT Long-Term Trend — Bearish (Daily Chart)

Key Price Levels

Resistance: $0.1200, $0.1400, $0.1600

Support: $0.1100, $0.0900, $0.0800

Dogecoin (DOGE) Price Prediction: DOGE/USDT Downward Retracement Breaches the $0.1200 Baseline

The current session, along with the previous one, has produced modest upside price movement on the Dogecoin daily chart. This can be observed through the appearance of two small green candles. However, price action remains below the 9-day Exponential Moving Average (EMA). Meanwhile, the Stochastic Relative Strength Index (SRSI) lines are converged in the oversold region.

Dogecoin (DOGE) Price Prediction: DOGE/USDT Upside Move Remains Weak

While Dogecoin’s daily chart has shown a slight recovery in recent sessions, upside momentum remains limited. The last two price candles are still positioned notably below the 9-day EMA. 

In addition, although the SRSI lines are converging for a potential bullish crossover in the oversold region, they have yet to rise decisively. This suggests that bullish forces continue to face strong resistance before any meaningful upward movement can occur.

Dogecoin (DOGE) Price Prediction: DOGE/USDT Shows Short-Term Strength

On the 4-hour chart, Dogecoin price action is maintaining a short-term bullish bias. The most recent candle is green and shows upward movement toward the 9-day EMA. In fact, the ongoing session is currently testing the EMA level.

Dogecoin (DOGE) Price Prediction: DOGE/USDT Downward Retracement Breaches the $0.1200 Baseline

At the same time, the SRSI lines are tilted upward and have moved above the 50 threshold. This trajectory indicates that bullish momentum may be building, potentially pushing the price toward the $0.1150 target level.

Get Dogecoin (DOGE) here. Buy DOGE 

Lucky Block (LBLOCK): Finding Strength at Historic Support Amid Market Turbulence

Lucky Block (LBLOCK) is navigating a period of broad market tension, which has impacted its short-term price action. Despite this environment, the token is demonstrating notable resilience by testing and holding at a critical, historic support zone. This phase represents a crucial test of underlying strength and presents a potential consolidation area from which a sustainable recovery can be built.

Daily Chart Analysis: Stabilizing at a Long-Term Foundation

The daily chart reveals that LBLOCK is probing a significant multi-month support level. The Parabolic SAR indicator continues to suggest a prevailing downtrend, which aligns with the broader negative market sentiment. However, the MACD, while in negative territory, shows signs of slowing bearish momentum, which can often precede a stabilization period. The token is engaging with a vital price floor, a zone where previous declines have found a base and reversed.

Lucky Block (LBLOCK): Finding Strength at Historic Support Amid Market Turbulence
LBLOCKUSDT – Daily Chart

The immediate and critical support level is now at 0.00000960, with an even stronger historical floor at 0.00000939. Holding this zone is paramount for maintaining the broader structure. The initial resistance levels for any recovery are 0.00001123 and 0.00001822.

4H Chart Analysis: Consolidation in a Defined Range

The 4-hour chart shows the token entering a phase of tight consolidation after a period of decline. The price action is contained within a narrow range, indicating a balance between selling pressure and emerging buying interest at these lower levels. The MACD on this timeframe is flattening near its lows, suggesting the momentum of the downtrend is waning, which is the first step toward a potential reversal.

Lucky Block (LBLOCK): Finding Strength at Historic Support Amid Market Turbulence
LBLOCKUSDT – 4H Chart

Key resistance to overcome on an intraday recovery is 0.00001123. A break above this level would be an early positive signal. The current consolidation is centered around the support at 0.00000960, with a firm base at 0.00000939.

Conclusion: A Strategic Inflection Point

While broader market tensions have undoubtedly influenced LBLOCK’s price, the token’s descent to a definitive multi-month support zone creates a high-conviction technical scenario. This is a level where long-term value has been established in the past. For strategic investors, periods of maximum pessimism and tests of key support often present the most compelling opportunities. Lucky Block is now at such an inflection point, where holding this foundational support could set the stage for a robust recovery once market sentiment improves.

Invest wisely, and let Lucky Block’s potential work in your favor. You can purchase Lucky Block here.  Buy LBLOCK

Chainlink Price Faces Critical Compression Near Yearly Low

Chainlink price has recently gone down by 7.23% in recent times. This change shows that the token is slightly outpacing the broader market’s 6.17% decline.  At the present time, the decline seems to be fueled by a wave of extreme fear across the crypto sector.

Technically, the decline accelerated after LINK failed to stay strong above the $10.41 support level, as the breakdown triggered heavy selling pressure and stop-loss liquidations.

Currently, Chainlink trades at $9.94 with a moderate 946,000 traded volume at the time of writing.

Chainlink Price Faces Critical Compression Near Yearly Low
LINKUSDT – Daily Chart

Technical Indicators

Major Resistance Levels: $11.10, $12.35, and $14.50

Major Support Levels: $9.50, $8.30, and $7.50

Technical Analysis

Technically, the Chainlink price on the daily timeframe appears to be displaying a falling trend channel. The price action shows that Chainlink against Tether has failed to hold above the $10 psychological level, as seen with the bearish crossover of the Guppy Multiple Moving Averages (GMMA).

From another angle, the Stochastic RSI displays an oversold condition, operating at the extreme selling level. However, the current direction of the blue line suggests momentum may be tilting, and a bounce to the north may be seen. Meanwhile, without a push past $11.58, the sell pressure remains strong.

Chainlink’s Current Wave Structure

Recently, the Chainlink price has hit a significant support level at $8.90. This is coinciding with a broader crypto market sell-off. Though current patterns suggest a complex downward correction, it is believed that this support level could be the starting point of a potential upside. However, the price needs to successfully break above $11.20 and $14.50 to signal that the long-term slump is over.

As it stands, the expectation of a five-wave upward movement to confirm a trend reversal is high, despite the current downtrend. To this end, further minor dips are possible, but the focus remains on clearing key resistance levels to prove that the recent selling pressure is exhausted.

LINK/USDT Analysis: Can Chainlink Price Reclaim the $10.47 Level?

The 4-hour chart of LINK/USDT seems to be projecting the broader charts. However, it appears the bulls are forcing themselves back into the market. Meanwhile, the recent downward trend seems to be sudden after a prolonged sideways move. The GMMA still maintains the previous structure despite the signal from the SRSI.

To this end, without a sustained hold above $11.47 in the coming session, the token may choose to consolidate between the $9.00 and $11.00 levels.

Chainlink Price Faces Critical Compression Near Yearly Low
LINKUSDT – 4H Chart


You can purchase crypto coins here. Buy Crypto

Top Five Trending Coins for January 31: ADA, PI, MOLT, BULLA, LINK

Most of the trending coins today are trading in the red over the past 24 hours (with the exception of BULLA/USD), reflecting the current downturn in Bitcoin. While this downside volatility highlights ongoing bearish pressure, it is important to note that such volatility can also set the stage for a meaningful rebound once bearish momentum becomes exhausted.

Amid this broader market weakness, the BULLA market has moved against the prevailing trend, recording a strong surge to the upside. In the following sections, we will take a closer look at each market and analyze their price action one after the other.

Cardano (ADA)

Major Bias: Bearish

The Cardano market is currently exhibiting strong selling momentum, which may explain why it ranks among the top trending assets today, driven by heightened volatility on the bearish side of the market. However, with such intense downside momentum, signs of exhaustion may be beginning to emerge.

Technical indicators suggest that the market is approaching an oversold condition, as price action has extended beyond the lower standard deviation band. Additionally, the presence of a notable lower shadow beneath the recent bearish candlestick indicates that some traders are already stepping in to buy the dip around the $0.28 level. This activity in the crypto signal is helping to establish a potentially pivotal support zone.

Current Price: $0.285

Market Capitalization: $10.2 billion

Trading Volume: $1.19 billion

Top Five Trending Coins for January 31: ADA, PI, MOLT, BULLA, LINK

Pi (PI)

Major Bias: Bearish

The Pi Network has identified the $0.15 price level as a key support zone, following a bearish candlestick that tested this level on January 19. Since then, price action has continued to drift toward the downside, retesting the $0.15 area.

However, given that recent bearish pressure was rejected at this level, there is a possibility that the price could rebound once again from this support. As a result, some traders may be positioning themselves around this key level, anticipating a potential bounce in price.

Current Price: $0.1547

Market Capitalization: $1.37 billion

Trading Volume: $27.27 million

Top Five Trending Coins for January 31: ADA, PI, MOLT, BULLA, LINK

Moltbook (MOLT)

Major Bias: Indecision

Given the limited market data available, the asset appears to be newly launched. Another factor supporting this view is the market’s initial price behavior, which was characterized by a sharp surge shortly after trading began. The asset opened around the $0.000528 level, and increased trading activity quickly pushed the price above $0.0011 before selling pressure set in.

As the price continues to decline, support is beginning to form around the $0.00055 level. From this area, a rebound could potentially occur if buying interest strengthens.

Current Price: $0.000556

Market Capitalization: $55.9 million

Trading Volume: $145.9 million

Top Five Trending Coins for January 31: ADA, PI, MOLT, BULLA, LINK

Bulla (BULLA)

Major Bias: Bullish

In contrast to the general downward movement across most crypto markets, this asset has recorded an impressive upward price surge. While many markets remain influenced by Bitcoin’s performance, this rally suggests that additional macroeconomic factors or heightened social activity may be driving the upside momentum.

Prior to the bullish breakout, price action remained relatively stable around the $0.029 level. However, the market experienced a strong breakout with significant bullish bias on Thursday, pushing the price sharply higher to around $0.247.

The immediate key resistance is located near the $0.25 level, while a potential new higher support zone may emerge around $0.20.

Current Price:  $0.247

Market Capitalization: $69 million

Trading Volume: $138 million

Top Five Trending Coins for January 31: ADA, PI, MOLT, BULLA, LINK

Chainlink (LINK)

Major Bias: Bullish

The Chainlink market is currently experiencing downward volatility; however, there are emerging signs of bearish exhaustion. Notably, the ongoing trading session shows lower shadows beneath recent bearish candlesticks, suggesting that buying interest is beginning to appear at lower price levels.

In addition, both the Bollinger Bands and the RSI are indicating oversold market conditions. Traders should take note that the $9–$10 price zone may be attracting investors, increasing the likelihood of a price bounce that could push the market back above the $10 level.

Current Price: $0.186

Market Capitalization: $8.15 million

Trading Volume: $297,000 million

Top Five Trending Coins for January 31: ADA, PI, MOLT, BULLA, LINK

Trade crypto coins on BYBIT

Emotion-Driven Trading Mistakes: Emotional Bias and Trading Accounts

Emotion-driven trading mistakes remain one of the most common reasons retail traders lose money in financial markets.

Market educators with decades of experience have explained that losing trades in most cases are not caused by poor strategies alone. They are of the opinion that this condition is often triggered by unmanaged emotional responses before, during, and after a trade.

According to a veteran trading coach with over 23 years of experience, emotional bias interferes most when traders face uncertainty, Despite the fact that technical setups appear strong. This analysis examines how emotion-driven trading mistakes consistently damage trading accounts and why disciplined professionals respond differently.

Emotion-Driven Trading Mistakes at Key Trade Stages

Market educators have reported that some emotions repeatedly surface at foreseeable points of trade.

Fear, they explained, usually appears before entry. Traders reportedly hesitate when price setups look ideal, imagining potential losses instead of assessing probability. As a result, they often enter too late or miss profitable moves entirely.

Emotion-Driven Trading Mistakes: Emotional Bias and Trading Accounts

Greed, according to experienced traders, tends to emerge during winning positions. It was stated that traders do overlook calculated profit targets after seeing unrealized gains. One of the reasons behind this is that the price may extend further. Most times, this behavior often leads to reversals, eroding seen profits.

From another angle, hope was described as the most dangerous emotion. To this, educators explained that traders sometimes refuse to respect stop losses when positions move against them. Instead, they reportedly wait for reversals that never come, allowing small losses to grow into account-threatening drawdowns.

Why Professional Traders Control Emotion

Professional traders, according to industry veterans, do not avoid emotions. Instead, they prevent emotions from influencing decisions.

As it stands, they are often seen using strict pre-trade, during-trade, and post-trade processes to guide actions regardless of of where their tilts towards. Consequently, this structure ensures that decisions are based on seen price movement instead of assumed expectations.

Additionally, experts have emphasized that emotion-driven trading mistakes occur when traders focus on what they think should happen instead of what price action shows. Therefore, fear focuses on imagined loss, greed on imagined profit, hope on imagined recovery, and regret on imagined alternative outcomes. Professionals, they explained, treat emotions as signals, not instructions.

To this end, by responding only to confirmed market behavior, disciplined traders reportedly reduce emotional damage and preserve capital over time.


In order to place winning trades with us via Bybit, you can open an account here.

Cointelegraph and Google Search Visibility: What Happened?

Industry observers have reported that Cointelegraph’s Google search visibility has dropped. This became evident in late 2025 after several Google algorithm updates. SEO analysts said the cryptocurrency news outlet lost a significant share of its organic rankings, with some experts stating that Cointelegraph briefly failed to appear even for branded searches such as its own name.

According to analysts, such declines are commonly linked to stricter quality, trust, and spam controls. This is bound to happen especially in sensitive sectors like finance and crypto. While Cointelegraph reportedly continued publishing at its usual pace, specialists explained that fewer readers were discovering its articles through Google search.

Cointelegraph Google Search Visibility Drop and SEO Concerns

Market analysts explained that the Cointelegraph Google search visibility drop coincided with signals that Google had tightened enforcement around link quality and site trust. SEO professionals said backlink data from Ahrefs showed millions of incoming links using “non-GamStop casino” anchor text pointing to Cointelegraph pages. To this, experts have noted that such casinos target users who previously self-excluded from gambling platforms, and this could be a factor that could raise red flags for search engines.

Cointelegraph and Google Search Visibility: What Happened?
Cointelegraph visibility Source: Goodmoneyguide.com

Analysts suggested that Cointelegraph had no direct control over these links and that the pattern resembled a negative SEO attack by third parties. From another angle, some specialists added that, if Google interpreted the links as manipulative or harmful, the site’s rankings could have been suppressed either algorithmically or through manual review.

Security Incident and Ongoing Access to Cointelegraph

Aside from SEO concerns, commentators have also pointed to a mid-2025 security breach as a contributing factor that can affect organic reach. Cointelegraph has confirmed this by stating that at the time of the attack, hackers injected malicious pop-ups designed to trick users into connecting crypto wallets or claiming fake airdrops. During that period, the new outlet warned readers to avoid interaction while the issue was fixed.

To this, analysts said that even short-term security incidents can weaken browser and search engine trust signals.

However, regardless of these challenges, observers stressed that Cointelegraph never went offline. The site reportedly continues to publish daily blockchain and cryptocurrency information through direct visits or its mobile app. To this end, researchers concluded that it appears that reduced search visibility has created the impression that Cointelegraph disappeared. However, it is just the reach that has simply been narrowed.


In order to place winning trades with us via Bybit, you can open an account here.

XRP Millionaire Wallet Growth Suggests Quiet Whale Accumulation

XRP millionaire wallets have begun to increase again, even as price movement remains weak. According to blockchain analytics firm Santiment, the number of XRP addresses holding at least one million tokens has gone up for the first time since the third quarter of 2025.

Santiment reported on social media platform X on January 28, 2026, that this development occurred while XRP was still down by about 4% year to date, suggesting that large holders may be accumulating quietly despite subdued market conditions.

XRP Millionaire Wallets Rise Despite Soft Prices

Santiment explained that a net increase of 42 XRP millionaire wallets had returned to the ledger since the start of January. The firm noted that this marked a clear reversal after several months of decline. Right now, data from the XRP Ledger showed that wallet growth resumed in early January, but XRP’s price remained largely stagnant.

XRP Millionaire Wallet Growth Suggests Quiet Whale Accumulation
Source: Santiment

However, analysts have described the gap between wallet expansion and limited price movement as a constructive divergence, often linked to long-term positioning by large investors.

The analytics firm further stated that the previous decline had been significant. Between early October and late December 2025, the number of XRP wallets holding at least one million tokens reportedly fell by around 784 addresses. Santiment added that this drop stabilized toward the end of December before shifting into modest growth at the beginning of 2026.

On-Chain XRP Data Points to Structural Change

Market observers said the recovery in XRP millionaire wallets came after the earlier contraction, not alongside a sharp price rebound. As it stands, this timing suggests that accumulation may be taking place underneath. Analysts also highlighted that exchange balances for XRP have been trending lower over the past year, which could indicate tightening available supply.

In addition, commentators pointed to the approval of several spot XRP exchange-traded funds in November 2025 as an important factor shaping the current market structure. While Santiment cautioned that millionaire wallet totals are still below mid-2025 levels, analysts described the recent increase as an early recovery signal rather than a full return to previous concentration.


In order to place winning trades with us via Bybit, you can open an account here.