POL (Prev. MATIC) Price Prediction: POL/USDT Coils Up but Remains Vulnerable

Date: January 31, 2026

The downward retracement in the POL (Prev. MATIC) market has been decisive. Even now, price action continues to drift lower as momentum weakens, which is reflected in the recent candlestick formations.

POL/USDT Long-Term Trend — Bearish (Daily Chart)

Key Price Levels

Resistance: $0.1200, $0.1400, $0.1600

Support: $0.1100, $0.0900, $0.0750

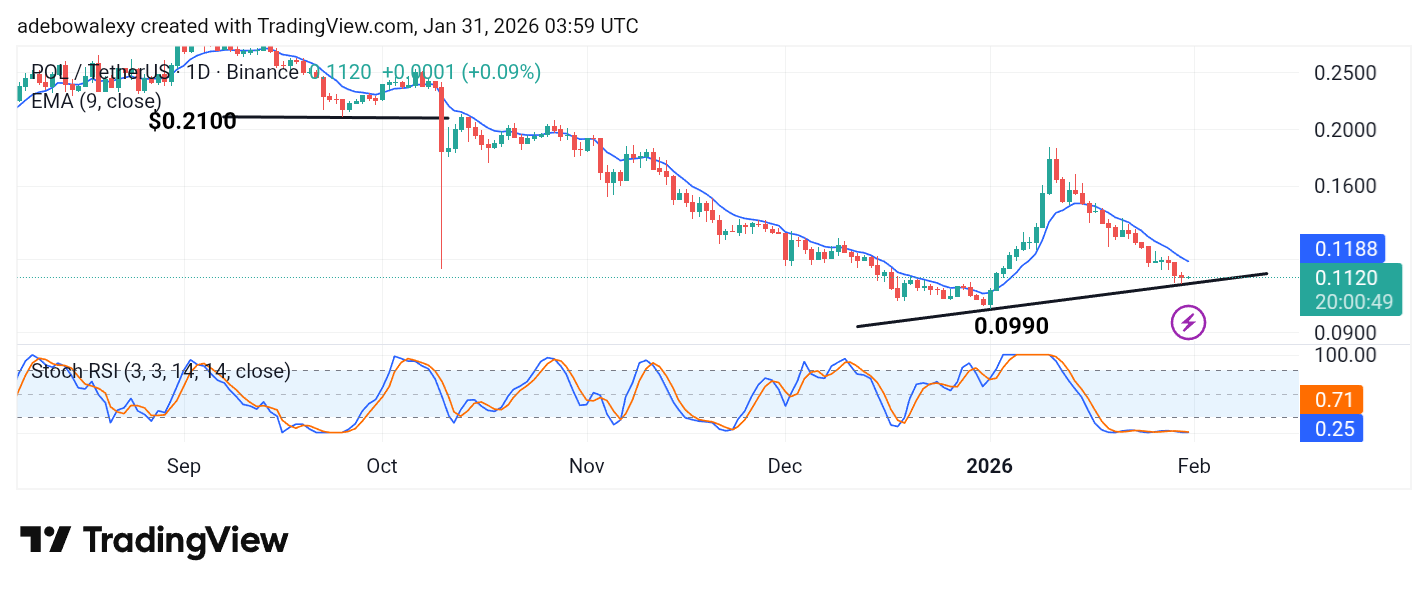
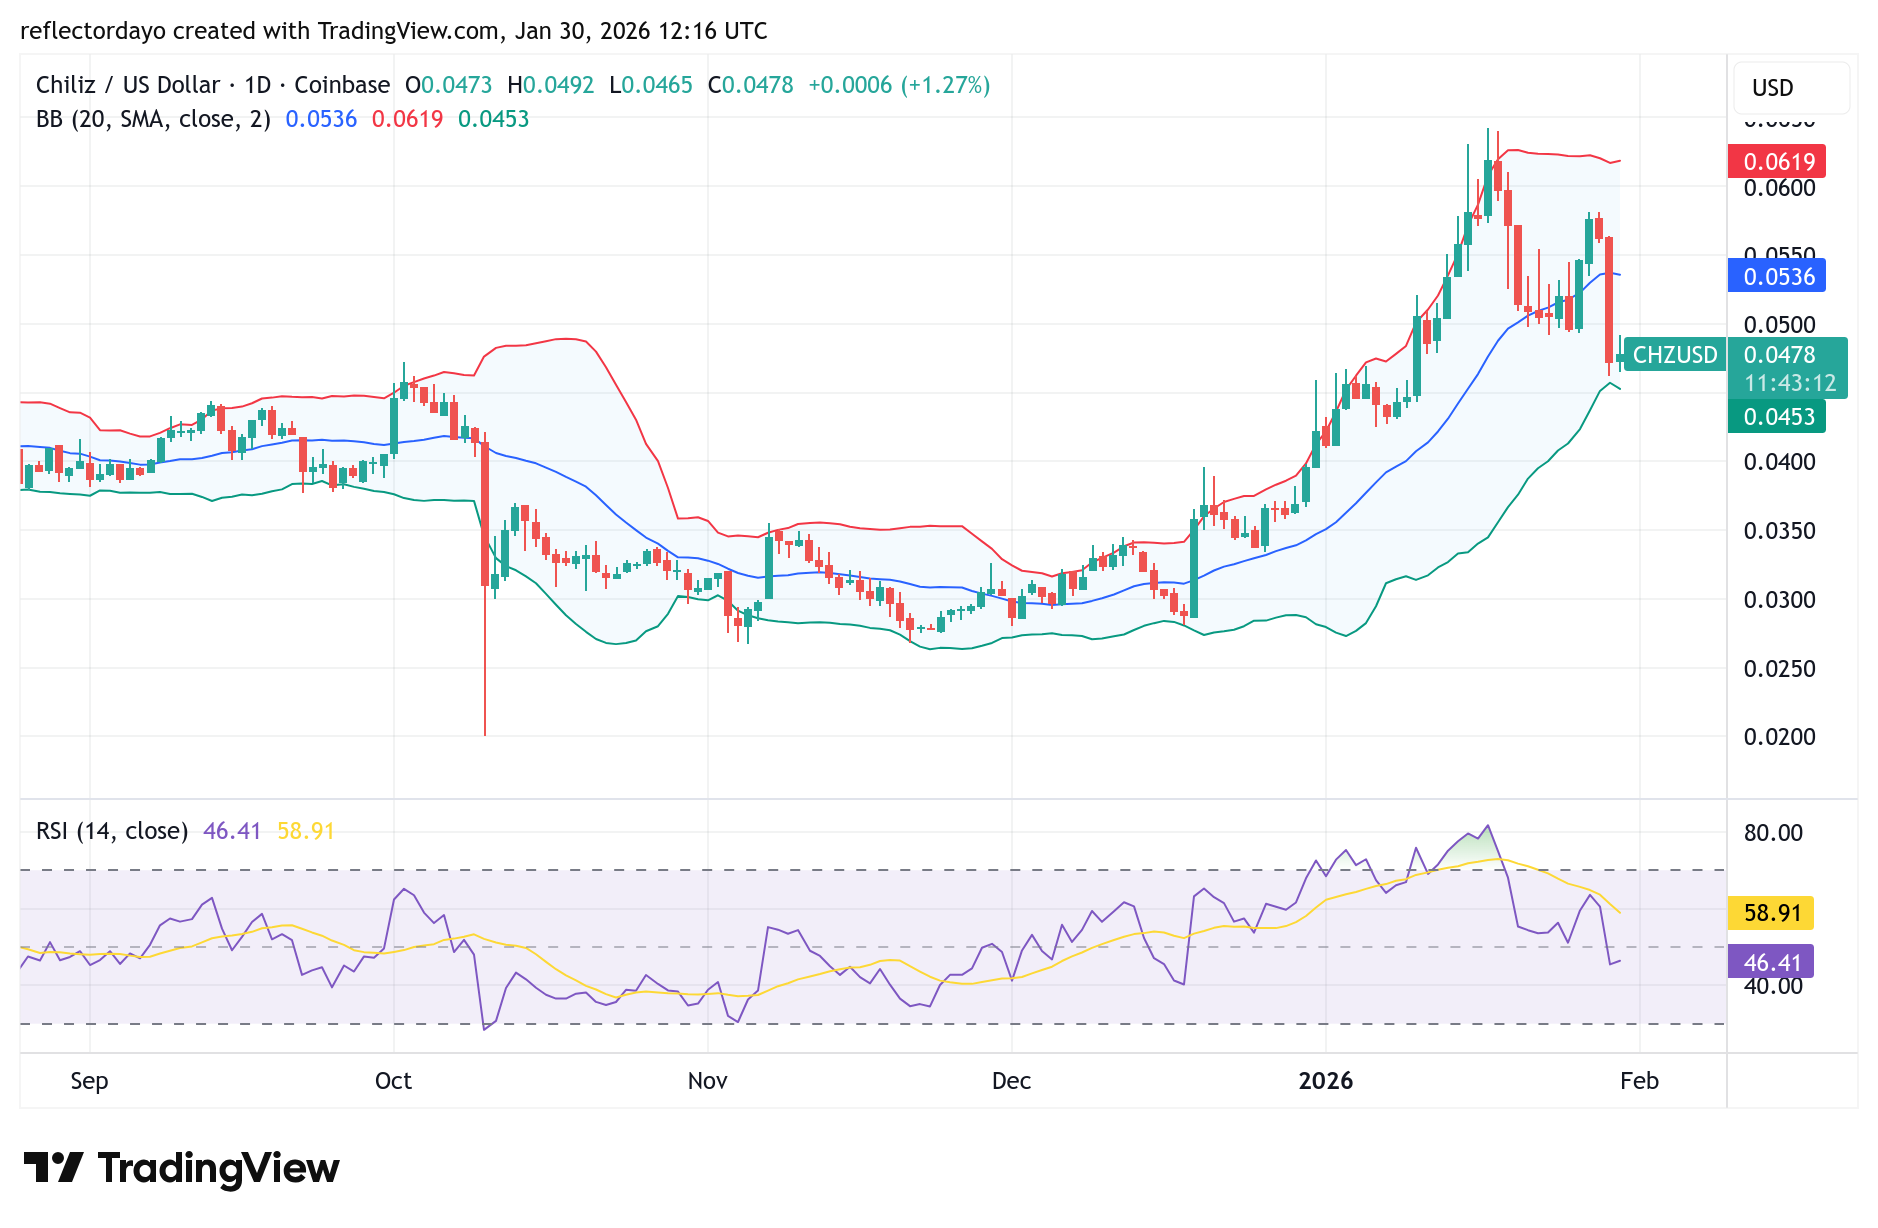
The POL (Prev. MATIC) market has remained bearish for weeks, with price action sliding toward lower levels. The current session is green but still trades below the 9-day Exponential Moving Average (EMA). In addition, the Stochastic Relative Strength Index (SRSI) lines continue to move sideways within the oversold region, indicating persistent weakness.

POL/USDT Price Prediction: POL (Prev. MATIC) Buyers Still Outnumbered (Daily Chart)

An examination of the POL (Prev. MATIC) daily chart shows that selling pressure has dominated for several weeks, keeping the market below the 9-day EMA. Although the most recent candlestick is green, the gain is minimal, giving the market a subdued appearance.

Furthermore, the SRSI clearly suggests that downward forces remain in control, as its lines continue to drift sideways in the oversold zone. Overall, bearish pressure still appears to dominate the market for now.

POL/USDT Price Prediction: POL (Prev. MATIC) May Break Out in Either Direction (4-Hour Chart)

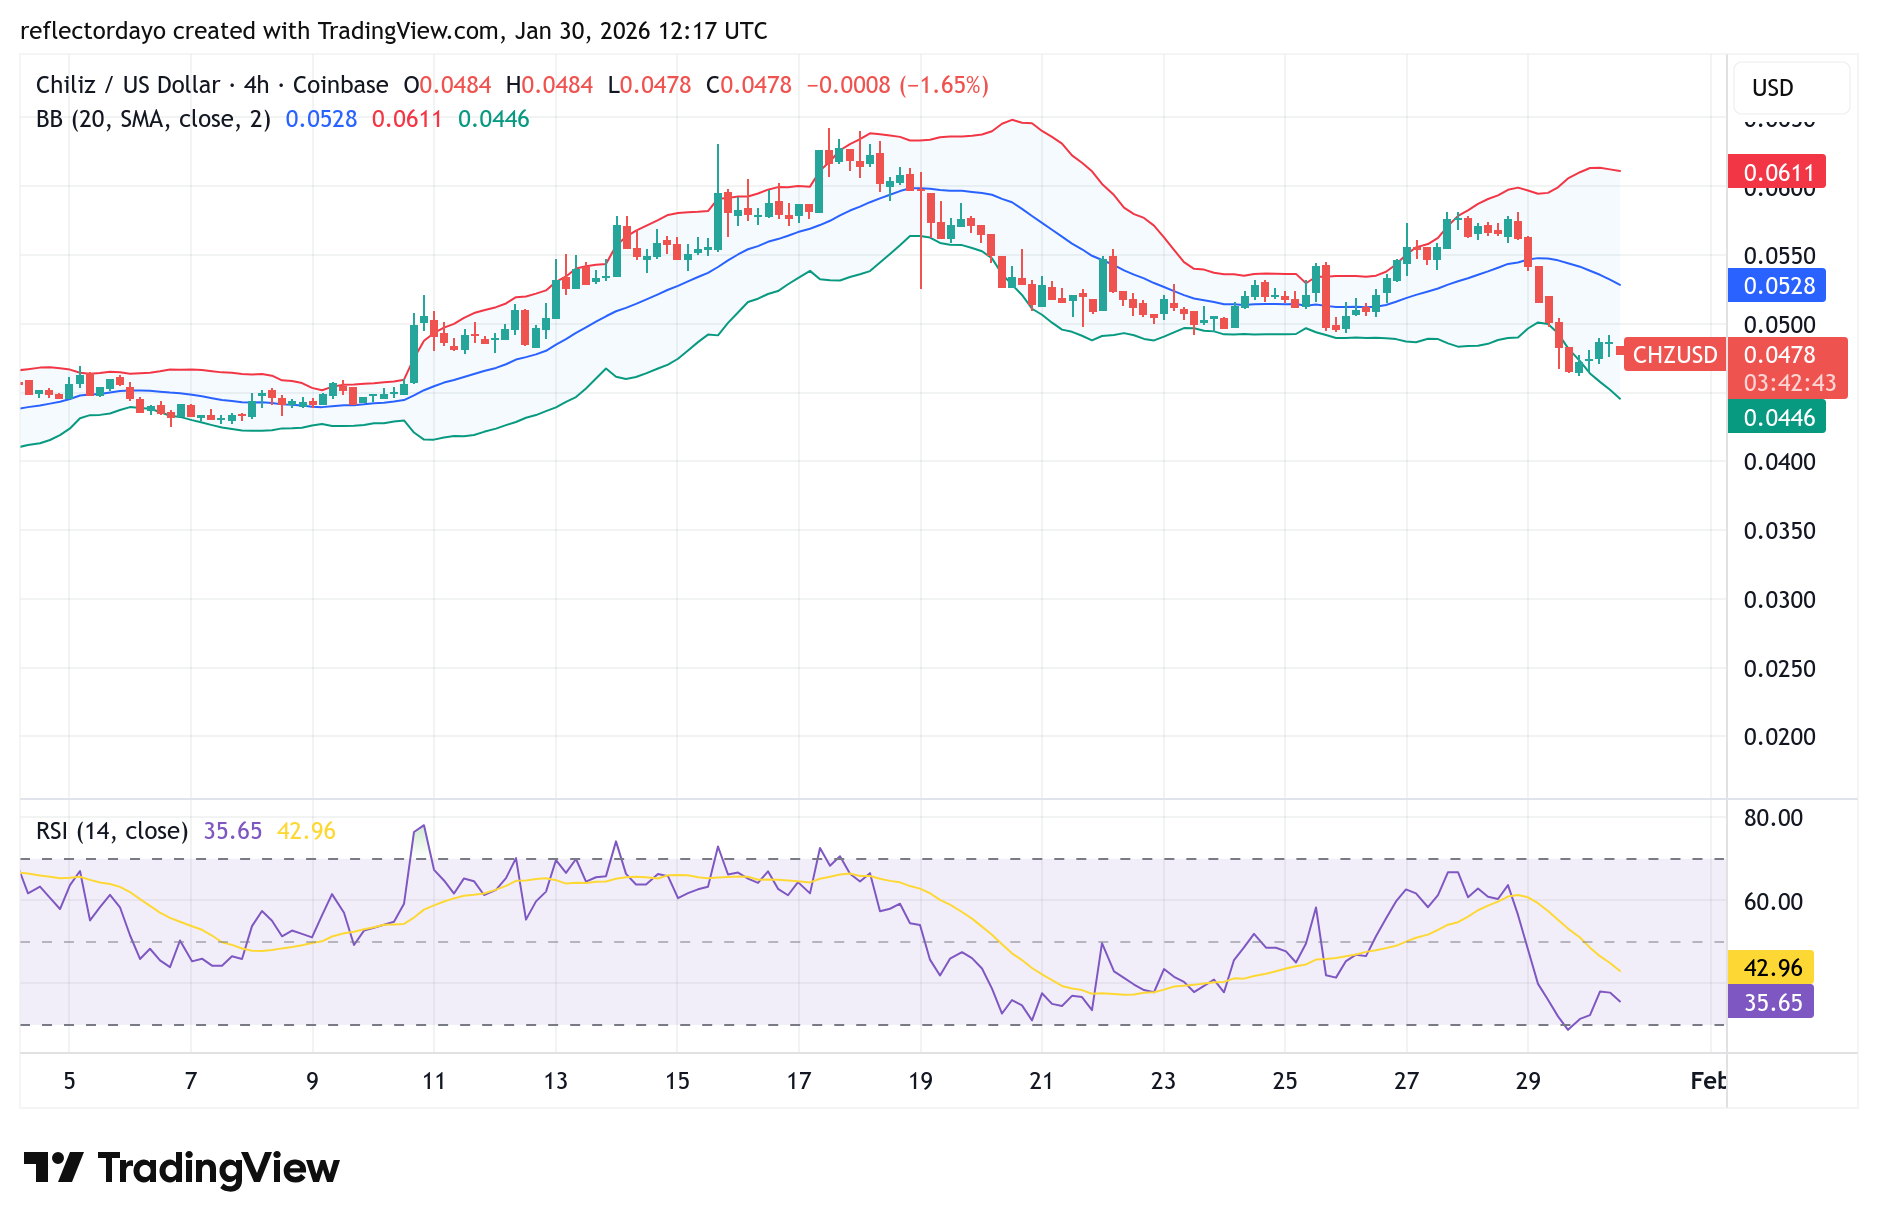
On the 4-hour chart, price action is forming a symmetrical triangle pattern, signaling that a breakout may be approaching. However, the direction of the move remains uncertain.

POL (Prev. MATIC) Price Prediction: POL/USDT Coils Up but Remains Vulnerable

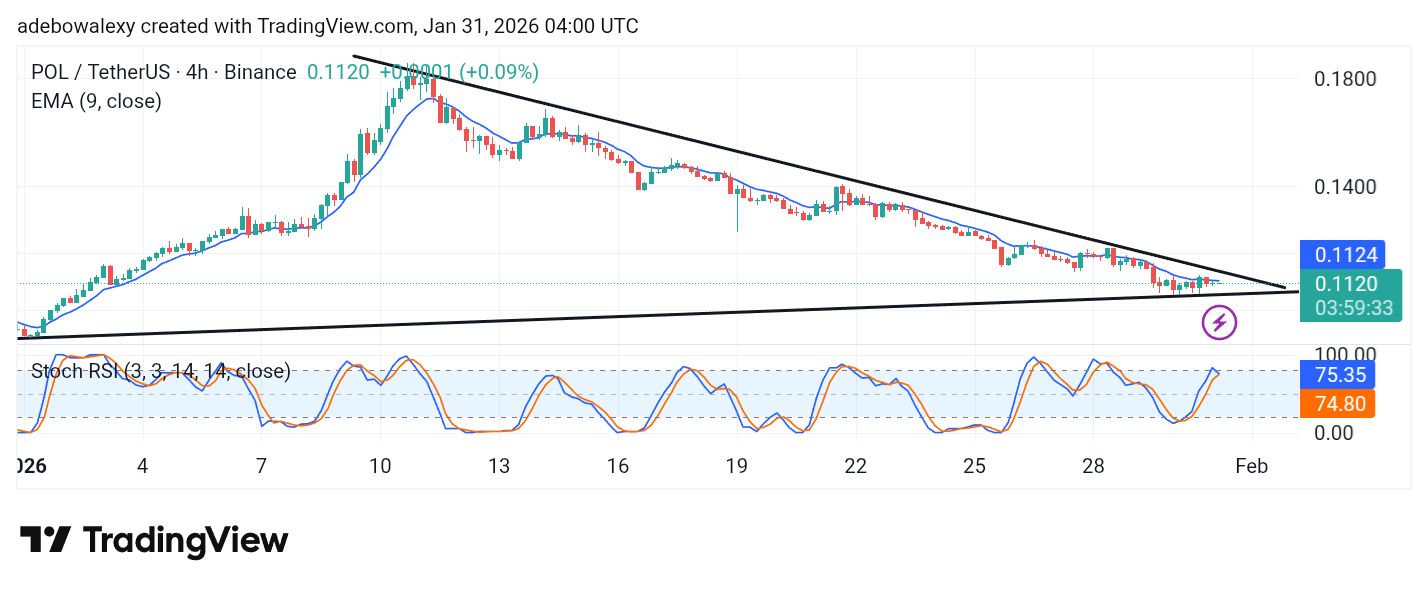
The last two candlesticks are green but continue to trade below the 9-day EMA. Meanwhile, the SRSI lines are positioned above the 70 level and appear to be converging toward a potential crossover.

Based on these signals, the market could still dip lower and test the $0.1000 level. Alternatively, traders may wait for a decisive move above the 9-day EMA before targeting higher price levels.

Get POL (prev. MATIC) here. Buy POL 

Compound (COMP/USD) Bears Gain Strength After Consolidation

COMP/USD Price Analysis: COMP/USD Enters Consolidation Twice in a Downtrend

COMP/USD shows a downtrend of about -57.50% from August to January, consolidating twice at the price levels of $30.00 and $23.80. This signals that the trend is losing momentum.

COMP/USD Key Levels

Resistance Levels: $38.61, $60.26
Support Levels: $24.30, $24.10

Compound (COMP/USD) Bears Gain Strength After Consolidation

The daily timeframe shows price in the oversold zone on the Stochastic Relative Strength Index (Stoch RSI) near the price level of $23.80. This suggests a potential trend reversal or pullback, although price has broken below the support area. Candles forming below the Simple Moving Average (SMA) show the market remains in a downtrend, even as bearish momentum weakens.

Zooming in on the 4-hour timeframe, the market broke the neckline of the double bottom pattern near the price level of $28.00, giving an early signal before the breakdown toward $23.80.

Compound (COMP/USD) Bears Gain Strength After Consolidation

Market Expectation

On the 4-hour timeframe, price broke below the lower Bollinger Band with momentum after brief market indecision from January 20 to January 28. This means sellers remain in control of the market.

You can purchase Lucky Block here.  Buy LBLOCK

Note: Cryptosignals.org is not a financial advisor. Do your research before investing your funds in any financial asset or presented product or event. We are not responsible for your investing result.

Supercycle: What Does It Mean?

A supercycle in the context of cryptocurrency markets are fascinating phenomena in which prolonged periods of rising prices attract both investor interest and public attention. During these phases, the value of cryptocurrencies can climb to unprecedented levels, often driven by a combination of technological advancements, increasing adoption, and positive market sentiment.

Crypto Supercycles Explained: What Sets Them Apart

A crypto supercycle emerges when market growth breaks free from the usual boom-and-bust rhythm. Instead of sharp rises followed by expected pullbacks, momentum extends over a longer period, often fueled by major blockchain innovations, deeper institutional involvement, or transformative regulatory changes.

During these phases, digital assets gain broader real-world relevance, pushing their perceived usefulness and value to new heights. This convergence sparks heightened speculation and sustained interest, drawing in participants ranging from retail traders to large institutional investors.

Supercycle: What Does It Mean?

How Key Drivers Play Out in a Supercycle

The main drivers of a cryptocurrency supercycle are usually technological breakthroughs and major developments, such as Bitcoin’s Lightning Network, which improves scalability and efficiency, and Ethereum’s shift toward proof of stake. These innovations strengthen crypto’s potential and real-world use, making them an important part of a supercycle.

Another key driver is the macroeconomic environment. Financial conditions such as inflationary pressures or changes in interest rates can encourage investors to explore cryptocurrencies as an alternative asset class. Additionally, geopolitical and socio-economic events can accelerate crypto adoption by positioning it as a decentralized alternative to traditional financial systems.

Understanding Supercycles in Market Behavior

A supercycle represents an extraordinary phase in market activity that goes beyond normal historical patterns, making direct comparisons with past cycles less reliable. During periods of accelerated expansion, participants may underestimate the speculative elements that often accompany rapid price appreciation. While these phases can unlock substantial gains, they also carry the risk of overheating driven by excessive optimism.

Supercycle: What Does It Mean?

History shows that even extended growth periods tend to end with market corrections. For this reason, investors in the crypto market should apply careful analysis and restraint when trends appear overly optimistic. Maintaining a balance between confidence and informed risk management is essential for navigating the shifts that may follow a supercycle.

Supercycle: A Visionary Phase in the Market

When viewed in a broader context, a supercycle is more than just a phase within a market cycle. It often represents a period of significant transformation, driven by technological progress, evolving market needs, or expanding adoption. As a result, supercycles embody a forward-looking momentum that sets them apart from typical boom-and-bust cycles.

Recognizing the possibility of a supercycle underscores the importance of closely tracking technological developments alongside broader economic signals. By understanding how these forces interact, market participants can better navigate the complexities and sharp fluctuations that often define supercycle-driven markets.

Bitcoin (BTCUSD) Breaks Below $83,130 as Momentum Weakens Toward Support

Bitcoin Price Analysis – January 30, 2026

Bitcoin (BTCUSD) has slipped below the $83,130 support zone amid an acceleration of bearish momentum. After failing to sustain rallies near the mid-range and higher resistance bands, price action has deteriorated into a more pronounced downtrend on the daily. Indicators are confirming weakening demand, and unless bulls can reclaim key levels with conviction, downside risk remains elevated.


BTCUSD Market Key Levels

Resistance levels: $83,131, $93,740
Support levels: $73,998, $65,000

Bitcoin (BTCUSD) Breaks Below $83,130 as Momentum Weakens Toward Support


BTCUSD Long-Term Trend – Bearish (Daily Chart)

BTCUSD is currently trading around $82,080, down sharply as sellers continue to dominate price action. The broader trend has transitioned from range to downtrend after multiple failures to reclaim higher resistance levels such as $93,740 and $100,360. The recent breakdown below $83,131 marks a clear structural shift toward bearish control.

What is the market Outlook for BTCUSD?

MFI (Money Flow Index) is in low territory around 15–25, indicating persistent selling pressure and weak buying demand. PPO (Percentage Price Oscillator) trends further into negative territory, suggesting that downward momentum is strengthening with no clear sign of reversal.

This combination reflects an expanding downtrend rather than simple consolidation. Sellers are actively defending lower levels, and buyers have been unable to generate meaningful rebound strength.

From a structural standpoint, the breakdown below $83,130 increases the probability of a deeper retracement toward the next major demand zone at $73,998. As long as price remains under the $83,000–$85,000 zone, the bearish trend retains control and rallies should be viewed as corrective bounces rather than trend rev

BTCUSD Short-Term Trend – Bearish (4-Hour Chart)

On the 4-hour timeframe, BTCUSD shows clear signs of intraday weakness. Price has dipped below short-term support and continues to form lower highs. Short-term momentum indicators are firmly negative, confirming persistent selling pressure.

Candles on the 4-hour chart show expanding downside range and little buyer enthusiasm near lower levels. This suggests that short-term bearish continuation is more likely than consolidation at current levels. A short-term bounce could occur on oversold signals if BTC approaches $73,998 or lower, but buyers must first reclaim $83,131 with a strong candle close and follow-through to suggest a shift in control.

Bitcoin (BTCUSD) Breaks Below $83,130 as Momentum Weakens Toward Support

BTCUSD Market Statistics
Current Price: $82,080
Market Capitalization: $1,620,000,000,000
24H Trading Volume: $43,000,000,000

Place winning BTC trades with us. Get BTC here

Chiliz (CHZ/USD) Price Analysis: Market Finds Support Below $0.05

Following a sharp price decline, the Chiliz (CHZ/USD) market has staged a modest rebound as short-term traders step in to buy the dip, resulting in a slight 1.67% gain. Despite this brief recovery, the market remains under strong selling pressure, with bearish sentiment still dominating. Bulls are struggling to maintain support, suggesting that the current rebound may be fragile unless stronger buying momentum emerges.

Chiliz (CHZ/USD) Market Data

  • CHZ/USD Price Now: 0.048
  • CHZ/USD Market Capitalization: 493 million
  • CHZ/USD Circulating Supply: 10.24 billion CHZ
  • CHZ/USD Total Supply: 10.24 billion CHZ
  • CHZ/USD CoinMarketCap Ranking: #86

Chiliz (CHZ) Breaks Key Downtrend Channels, Eyes Higher Resistance Levels

Chiliz (CHZ) has shown a strong bullish structure after breaking out of multiple long-term downtrend channels on both the daily and weekly timeframes. On the 7-day chart, price action has been trading within a large descending channel since March 2021 and is now approaching its upper resistance zone. A closer look at the daily chart reveals that CHZ has already broken above two smaller downtrend channels, confirming a shift in momentum. From the November 2025 low, the token has rallied nearly 130%, forming a consistent pattern of higher highs and higher lows—a classic bullish signal. Notably, the long-standing $0.05 resistance level has now flipped into support after several rejections in the past, strengthening the bullish case. If this structure holds and price forms another higher high, CHZ could test the major down-channel resistance near $0.07, a level that previously acted as strong support and rejection. A decisive breakout above this zone could open the path toward higher targets, including intermediate resistance near $0.14 and long-term upside levels approaching the $0.90–$1.00 range, based on the broader channel projection.

Key Levels to Monitor

  • Resistance: $0.05, $0.06, $0.07
  • Support: $0.04, $0.03, $0.02

Chiliz (CHZ/USD) Price Analysis: Market Finds Support Below $0.05

Chiliz Market Analysis: Technical Viewpoint

The $0.05 price level had previously served as a key support zone, proving relevant in past trading sessions as bearish price action was repeatedly rejected at this level. This consistent rejection confirmed the area as a strong demand zone. However, during the previous daily session, the support failed to withstand the intense bearish pressure that originated from the $0.056 level. The heavy sell-off forced the Chiliz bulls to regroup below $0.05. The bullish recovery that followed this sharp decline has been weak and lacks strong conviction, suggesting limited buying strength in the market.

Chiliz (CHZ/USD) Price Analysis: Market Finds Support Below $0.05

CHZ/USD 4-Hour Chart Outlook

While the bullish recovery lacks conviction, as reflected by the relatively small bullish candlesticks, there are early signs that the bearish momentum may be weakening, indicated by the widening divergence of the Bollinger Bands. However, if consolidation continues and extends below the $0.05 price level, it could signal a higher likelihood of further downside movement, keeping the Chiliz market vulnerable to renewed selling pressure.

Trade crypto coins on BYBIT

Bitcoin Options Expiry: Could $8.3B Contracts Trigger Market Turbulence?

Bitcoin Options are set to dominate crypto markets this week as a major wave of contracts expires at the end of January. Approximately 91,000 Bitcoin contracts, worth around $8.3 billion, are expiring on Friday, Jan. 30, making it the largest expiry for the month and a potential catalyst for market volatility.

Crypto Markets Feel the Heat

Crypto markets have been under pressure this week, losing about $215 billion in total value. Key factors driving the sell-off include:

  • The US Federal Reserve keeping interest rates steady at 3.5%-3.75%, well above its 2% target.
  • Rising geopolitical tensions in the Middle East, adding uncertainty to risk assets.

Bitcoin has dropped 8% to $81,300, marking its lowest level since April. Ether fell 9% to roughly $2,700, while many altcoins saw double-digit losses. The total crypto market capitalization slipped below $3 trillion, a level not seen since mid-December, signaling a deepening bearish trend.

Key Insights from Bitcoin Options

The current Bitcoin Options expiry shows a put/call ratio of 0.54, meaning call options dominate over puts. According to Coinglass, the “max pain” level sits near $90,000, above current market prices, suggesting many contracts may expire out of the money.

Open interest (OI) remains concentrated at several key strike levels:

  • $100,000 strike: $1.9 billion OI on Deribit
  • $75,000, $80,000, $85,000 strikes: over $1 billion combined OI
  • Total Bitcoin options OI across all exchanges: $58 billion

Deribit analysts note that expiries often amplify price movements near critical levels, which aligns with recent volatility in Bitcoin spot markets.

Ethereum Options Expiry

Bitcoin Options Expiry: Could $8.3B Contracts Trigger Market Turbulence?

Ethereum is also experiencing a significant expiry, with roughly 440,000 contracts valued at $1.3 billion. Key details include:

  • Max pain: $3,100
  • Put/call ratio: 0.74
  • Total ETH options OI: $35 billion

Combined, Bitcoin and Ethereum options expiries reach nearly $9.6 billion, heightening the potential for short-term market swings.

Outlook for Traders

With major expiries coinciding with falling spot prices, the crypto market could experience increased turbulence. Key support and resistance levels, especially around max pain points, will likely dictate short-term price action. Traders should monitor open interest and volatility closely in the coming days to navigate the potential swings effectively.

Make money without lifting your fingers: Start using a world-class auto trading solution.

EightCapyour trusted Partner in CFDs, Cryptocurrencies and Stocks.

Cardano Price Faces Critical Pivot as Bearish Pressure Mounts

Cardano price has dropped 7.34% in the last 24 hours, extending towards its lowest point since 2024. This decline outpaced the broader market dip, and it appears to be driven by a combination of geopolitical tensions coupled with the hawkish Federal Reserve expectations. As it stands, these macro pressures have triggered a massive risk-off sentiment, leading to over $1.7 billion in liquidations across the crypto asset space.

At the moment, Bitcoin is falling, while ADA is suffering more due to some weaknesses. Without an immediate catalyst to spring it back to the upside, the Cardano price could become very vulnerable.

Currently, Cardano trades at $0.3220 with over 75 million traded volumes on the daily timeframe.

Cardano Price Faces Critical Pivot as Bearish Pressure Mounts
ADAUSDT – Daily Chart

Technical Indicators

Major Resistance Levels: $0.3704, $0.3850, and $0.4220

Major Support Levels: $0.3300, $0.3000, and $0.2700

Technical Analysis

Technically, as seen on the daily timeframe, the market condition suggests that the Cardano price remains firmly under the control of sellers. As it stands, the token has failed to maintain its position above the downward-sloping SMA, suggesting a strong bearish trend.

From another angle, the Stochastic Relative Strength Index (SRSI) has dipped into the oversold region with the blue line hitting 20.56. This signals that while the market appears oversold, the sellers still want more gains. To this end, the price action might reflect the formation of a lower high structure, unless buyers can reclaim the $0.3704 level on a daily close. However, till then, the path of the token remains downward toward the $0.27 support zone.

Preparing for Cardano Price Move

Cardano price has been confirmed to be on a persistent downtrend correction. Now, the previously considered bullish one-two setup has been removed from the chart as the price tested its invalidation point. Meanwhile, the current decline is viewed as a diagonal structure, suggesting a shift can still be recorded.

As it stands, the current projections suggest ADA is unfolding in a C-wave to complete a larger three-wave cycle. However, a brief B-wave bounce may be seen even though it may appear weak. At this point, resistance is firmly set at $0.364, and a trend reversal will only be considered once a definitive five-wave move upward occurs.

ADA/USDT Analysis: Price Consolidation Amidst Oversold Signals

The Cardano price on the shorter timeframe is attempting to find a temporary floor after the recent sharp decline. Signals from the Stochastic RSI show extreme oversold levels have been reached, a condition that often precedes a minor bounce.

However, the 4-hour moving averages remain bearishly configured, with the shorter-term averages trending steeply below the longer-term ones. This suggests that any upward movement in the short term is likely to meet heavy selling pressure. To this end, for a trend reversal to be considered on this timeframe, the price would need to break and hold above $0.3257 even with the intense bearish control.

Cardano Price Faces Critical Pivot as Bearish Pressure Mounts
ADAUSDT – 4H Chart


You can purchase crypto coins here. Buy Crypto

Solana (SOL) Price Prediction: SOL/USDT Continues South Below $120

Date: January 30, 2026

The Solana market has fallen below the long-term support at the $120 price level. The market has continued to decline, with price action moving to lower levels as it approaches the $110 mark.

Long-Term Trend: Bearish (Daily Chart)

Key Price Levels

Resistance: $115, $120, $125

Support: $110, $105, $100

Solana (SOL) Price Prediction: SOL/USDT Continues South Below $120

The Solana market has eventually broken the long-term psychological support at the $120 level. The most recent price candle is bearish and continues downward below the 9-day Exponential Moving Average (EMA). The Stochastic Relative Strength Index (SRSI) lines have completed a bearish crossover and remain pointed lower within the oversold region.

Solana (SOL) Price Prediction: Solana Continues to Descend

Over the past two sessions on the Solana daily chart, bearish pressure has remained dominant. The latest price candle is bearish and continues to trade below the 9-day EMA.

The SRSI indicator suggests renewed bearish momentum, as its lines have just formed a downward crossover in the oversold region. Consequently, selling pressure may intensify and trigger further price declines in subsequent sessions.

Solana (SOL) Price Prediction: SOL/USDT Bears Maintain a Firm Grip (4-Hour Chart)

On shorter time frames, bearish forces also remain in control. The current session’s price candle is sizeable and bearish, trading below the 9-day EMA while testing the $110 support level.

Solana (SOL) Price Prediction: SOL/USDT Continues South Below $120

The SRSI lines are also positioned in the oversold region, with their latest movement offering little indication of an imminent reversal. As a result, bears may soon breach the $110 support level.

Get Solana (SOL) here. Buy SOL 

BCH/USD Holds Near $579.03 as Momentum Slips and Sellers Regain Control

BCH/USD Price Analysis – January 28th

Bitcoin Cash (BCH/USD) remains under sustained selling pressure, with price action compressing below the key $580.00 psychological level. After failing to reclaim the $612.92 resistance zone, sellers stepped back in aggressively, forcing price into a tight consolidation range near $579.00. Momentum is weakening, and accumulation signals are fading, indicating that buyers are struggling to defend the mid-range.


BCH/USD Daily Chart (Key Levels)

Support Zones: $520.00, $446.50
Resistance Zones: $612.92, $650.70

BCH/USD Holds Near $579.03 as Momentum Slips and Sellers Regain Control

BCH/USD Long-Term Trend – Bearish (Daily Chart)

BCH/USD is currently trading at $579.00 key zone, down 1.92% on the day. The Momentum indicator has turned negative at -4.52, confirming a loss of bullish strength.

What is BCHUSD Market Outlook?

The Accumulation/Distribution line remains soft at 6.02M, suggesting weak inflows and early signs of distribution rather than sustained buying. Price action has printed a long-bodied bearish candle, rejecting sharply from the $582.10 area and closing near the session low. This candle structure reflects strong selling pressure and limited buyer participation.

As long as price remains capped below $585.00, downside risk remains elevated. If sellers maintain control, a gradual move toward $550.00 becomes likely, with a deeper extension toward $520.07 if support fails decisively.

A bullish reversal scenario would require a clean reclaim of $585.00, followed by acceptance above $600.00 key zone. The bulls would need to reclaim $585.00 with a strong, wide-bodied candle and follow-through to invalidate the bearish intraday structure. If achieved, this could force short covering and open the path toward $612.92.

BCH/USD Holds Near $579.03 as Momentum Slips and Sellers Regain Control

BCH/USD Short-Term Trend – Bearish (Daily Chart)

On the 4-hour chart, BCH/USD continues to display intraday weakness. Price is trading near $578.30, down 0.46%, with a clear sequence of lower highs and lower closes. Short-term momentum remains firmly bearish at -10.41, while the Accumulation/Distribution line is flat at 722.08K, confirming a lack of conviction from buyers.

BCH/USD Market Statistics
Current Price: $579
Market Capitalization: $11,574,000,000
24H Trading Volume: $288,000,000

Place winning BCH trades with us. Get BCH here