Crypto Fear and Greed Index Signals Prolonged Market Anxiety

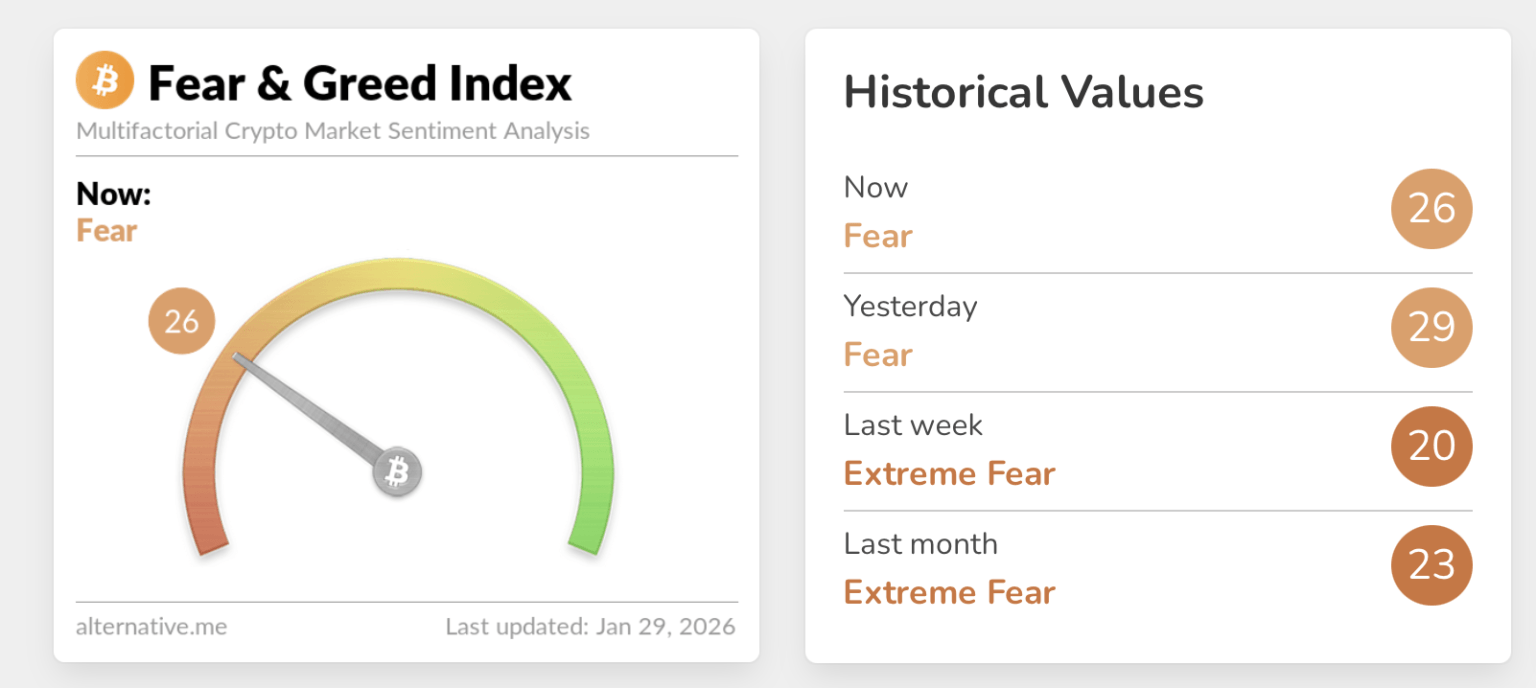
The Crypto Fear and Greed Index has continued to show deep caution in the crypto asset markets. Recently, sentiment has failed to recover meaningfully through January 2026, as displayed by the data published by Alternative.me on Thursday, Jan. 29.

Market analysts said the reading was largely unchanged from recent weeks, indicating that confidence had not returned despite several attempted price rebounds.

Also, observers are beginning to notice this prolonged weakness as traders now remain defensive and unwilling to increase risk exposure.

Crypto Fear and Greed Index Shows no Improvement

Analysts noted that the Crypto Fear and Greed Index had remained compressed for an extended period. The index stood at 29 the previous day, while it registered 20 one week earlier and 23 one month ago, both levels considered extreme fear. Commentators explained that this pattern showed stability at low sentiment levels rather than a healthy recovery.

Crypto Fear and Greed Index Signals Prolonged Market Anxiety
Crypto Fear and Greed Index by Alternative.me

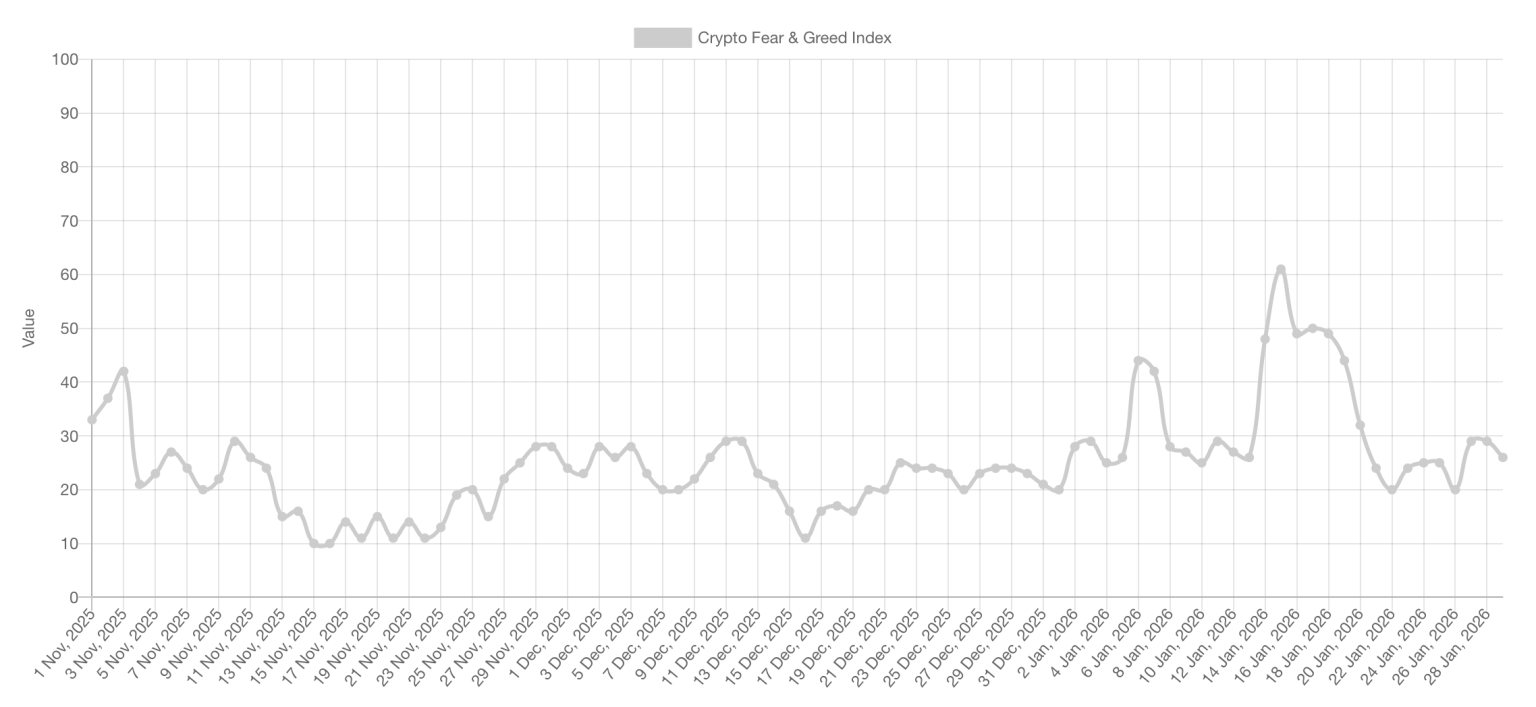
Historical data highlighted that sentiment was already fragile in early November, when readings hovered in the low-to-mid 30s. By mid-November, analysts said selling pressure intensified, pushing the index into the low teens, marking one of the most severe fear phases of the quarter.

However, December brought limited improvement, with readings fluctuating between the high teens and upper 20s. Meanwhile, market participants reportedly tested risk cautiously but avoided long-term commitments. This established the view that fear had become structural.

Macro Pressures Deepen Crypto Market Fear

Market strategists said January followed the same trend as before. As of January, early optimism briefly lifted the index toward the upper 20s before fading. Meanwhile, by mid-to-late January, renewed volatility and stronger correlations between crypto and U.S. equities pushed sentiment back toward extreme fear.

Crypto Fear and Greed Index Signals Prolonged Market Anxiety

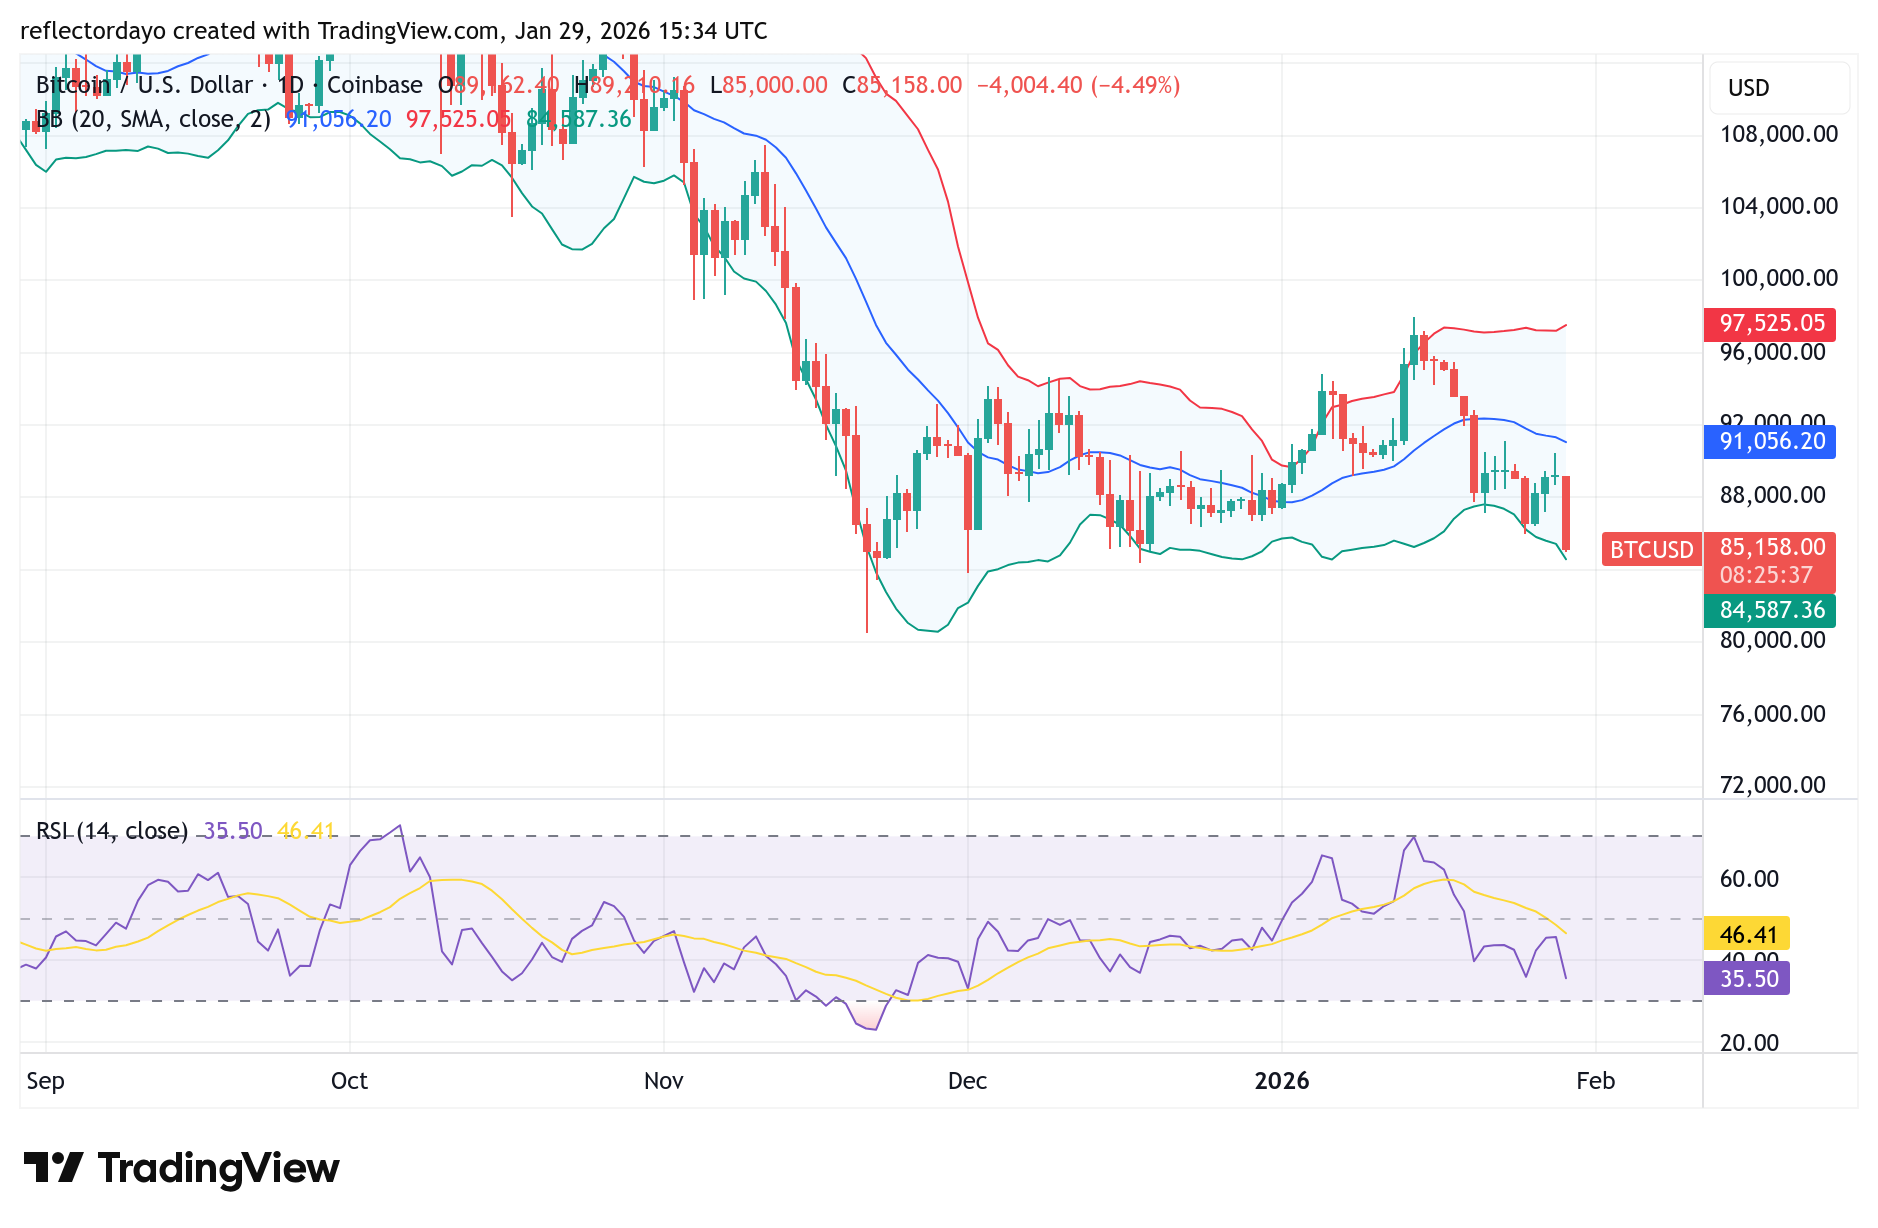
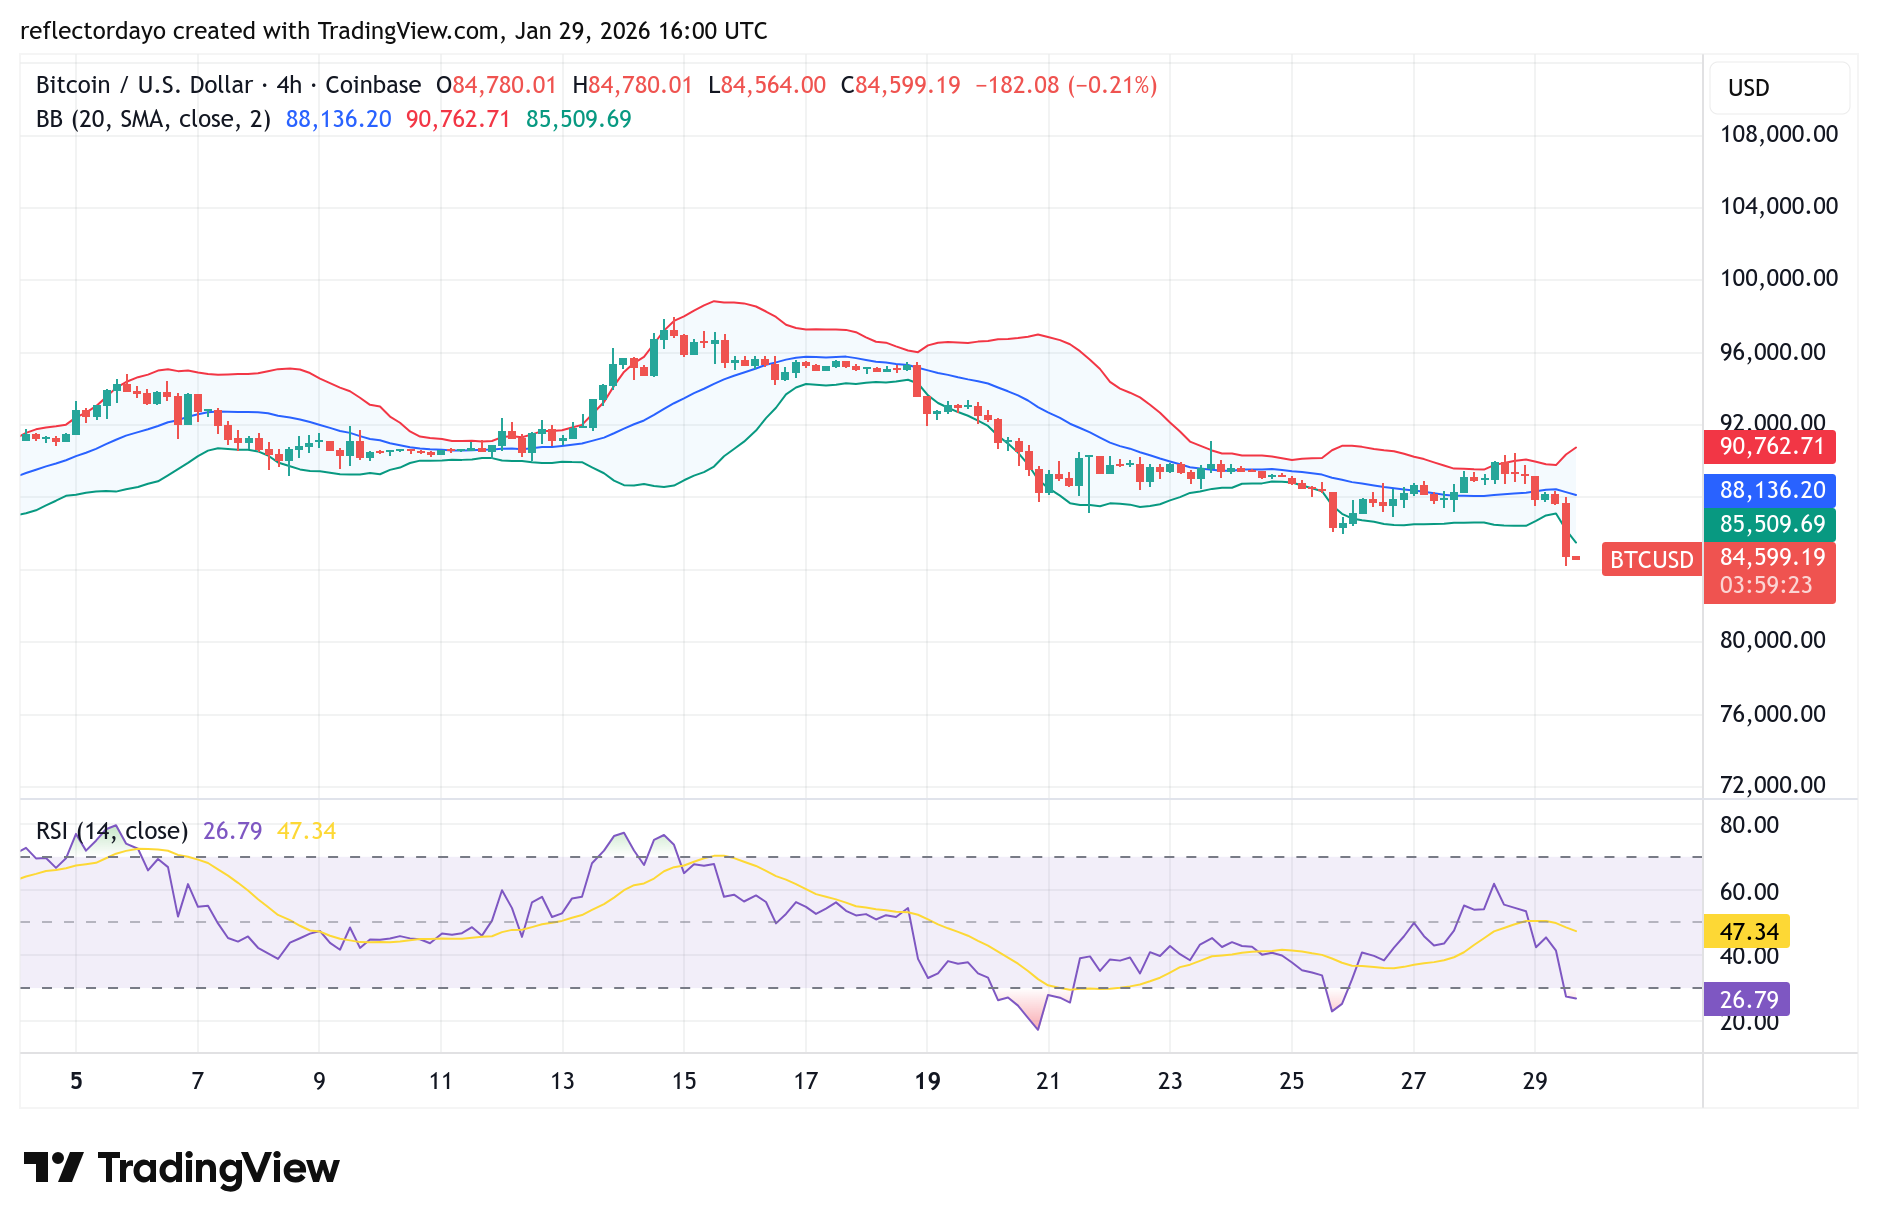
As it stands, this backdrop coincided with a sharp decline in bitcoin, with an intraday low of nearly $83,242. Currently, equity market weakness is beginning to add pressure, as Microsoft shares dropped more than 12% following their earnings, dragging the Nasdaq lower and amplifying risk aversion.

To this end, geopolitical tensions further weighed on sentiment. Now, observers are pointing to potential President Trump’s action on Iran. They suggest this could encourage flows into traditional safe havens like gold and silver. Therefore, analysts concluded that until the Crypto Fear and Greed Index can operate above the 30s, digital asset markets are likely to remain vulnerable to macro-driven sell-offs.


In order to place winning trades with us via Bybit, you can open an account here.

PEPE (PEPE/USDT) Previous Resistance Zone Becomes Support Zone

PEPE/USDT Technical Analysis: PEPE/USDT Reacts After Retesting a Breakout Resistance Zone

PEPE/USDT is currently in a long-term downtrend from August to December, breaking previous resistance at the price level of $0.00000500. This price is at a strong momentum. A double bottom pattern was formed at the price level of $0.00000370.

PEPE/USD Key Levels

Support Levels: 0.00000370, 0.00000400
Resistance Levels: 0.00000500, 0.00001000

PEPE (PEPE/USDT) Previous Resistance Zone Becomes Support Zone

On the daily timeframe, price near the support zone at $0.00000400 shows a weakening downtrend with a double bottom chart pattern followed by a liquidity grab. After the grab, the market broke the neckline of the pattern, confirming a trend shift to the upside.

The daily timeframe shows price reacting to a confluence zone of Support, Fair Value Gap (FVG), and Fibonacci discount zone at the level of $0.00000500. The Stochastic Relative Strength Index (Stoch RSI) shows price is in the oversold zone, signaling a possible bullish reversal from this area.

PEPE (PEPE/USDT) Previous Resistance Zone Becomes Support Zone

Market Expectation

On the 4-hour timeframe, price forming around the midline of the Bollinger Band shows consolidation. The Bollinger Bands squeezing together can lead to sudden market expansion, just like it did from 19 December to 4 January. All this may signal trend continuation after the corrective move.

You can purchase Lucky Block here.  Buy LBLOCK

Note: Cryptosignals.org is not a financial advisor. Do your research before investing your funds in any financial asset or presented product or event. We are not responsible for your investing result.

Bitcoin (BTC/USD) Price Analysis: BTC Endures Aggressive Headwinds Near $85,000

The Bitcoin market remains under bearish pressure, driven by a combination of economic factors including geopolitical tensions, competition from traditional safe-haven assets, and broader macroeconomic headwinds. Since the market’s decline from above the $100,000 level in November last year, price action has largely moved sideways below this psychological barrier. Despite several attempts to reclaim the $100,000 mark, each rebound has been met with strong resistance, keeping Bitcoin locked in a prolonged consolidation phase beneath this key level.

Bitcoin (BTC/USD) Market Data

  • BTC/USD Price Now: 85,125
  • BTC/USD Market Capitalization: 1.69 trillion
  • BTC/USD Circulating Supply: 19.89 million BTC
  • BTC/USD Total Supply: 19.89 million BTC
  • BTC/USD CoinMarketCap Ranking: #1

Bitcoin’s Price Action Sets the Tone for the Broader Crypto Market

In the embedded video, the analyst emphasizes Bitcoin’s dominant role in shaping the direction of the entire cryptocurrency market. As the original and most influential digital asset, Bitcoin typically leads major market moves, with capital flowing from BTC into Ethereum, large-cap altcoins, and eventually mid- and small-cap tokens once momentum strengthens. The video notes that Bitcoin has been trading in a range over the past month, briefly approaching the $100,000 level before retreating to the low $90,000 region. Despite relatively muted price action and ongoing position liquidations by market makers, the analyst suggests this period of consolidation could be a precursor to the next bullish impulse. A sustained move into the mid-$90,000 zone is highlighted as a key condition for a renewed push above $100,000, which would likely signal the start of broader altcoin activity. However, the analyst also expresses caution, noting that any break above $100,000 may struggle to hold for an extended period, reinforcing Bitcoin’s role as the market’s primary gatekeeper for the next phase of the crypto cycle.

Key Levels to Monitor

  • Resistance: $90,000, $91,000, $92,000
  • Support: $84,000, $83,000, $82,000

Bitcoin (BTC/USD) Price Analysis: BTC Endures Aggressive Headwinds Near $85,000

BItcoin Market Analysis: Technical Viewpoint

Despite the intensity of the recent pullback, Bitcoin’s broader structure still reflects a consolidation regime rather than the onset of a sustained bearish cycle. Price action remains compressed within the $84,000–$94,000 range, suggesting the market is digesting the strong upside expansion recorded during the 2025 rally. This range-bound behavior indicates equilibrium between profit-taking pressure and renewed accumulation. Notably, the 2026 yearly open continues to act as a key price magnet, attracting liquidity and guiding short-term directional bias, as traders recalibrate positions around this macro reference level. Until a decisive breakout or breakdown occurs in the crypto signal beyond this zone, Bitcoin’s market structure is likely to remain neutral-to-constructive.

Bitcoin (BTC/USD) Price Analysis: BTC Endures Aggressive Headwinds Near $85,000

BTC/USD 4-Hour Chart Outlook

On the 4-hour chart, Bitcoin is experiencing a strong bearish move within the current trading session, pushing the RSI into oversold territory and highlighting short-term selling exhaustion. While the intraday trend remains bearish, such conditions often signal a potential pause or brief corrective bounce, especially as price tests the $84,000 support zone. A rebound, however, would require clear rejection signals on the 4-hour timeframe; otherwise, downside pressure is likely to persist, and any long setup should be treated as a short-term countertrend trade.

Trade crypto coins on BYBIT

Pump.fun Price Makes a Turnaround Amidst Oversold Conditions

In the last 24 hours, Pump.fun against Tether has gone down by 7.95% and is now operating around $0.00292. This shows the pair is significantly trailing the broader market’s modest decline. As it stands, this sharp divergence stems from an internal problem, specifically a controversial token launch involving government theft allegations that shattered investor trust.

Additionally, a looming $500 million class-action lawsuit with a pivotal January 23 deadline fuels massive uncertainty. Technically, the Pump.fun price has surrendered its 200-day moving average, solidifying a bearish trend that invites continued liquidations.

Currently, Pump.fun trades at $0.003020 with more than 689 million traded volumes on the short-term timeframe.

Pump.fun Price Makes a Turnaround Amidst Oversold Conditions
PUMPUSDT – 4H Chart

Technical Indicators

Major Resistance Levels: $0.003250, $0.003500, and $0.004000

Major Support Levels: $0.002940, $0.002870, and $0.002000

Technical Analysis

After a 24-hour dip, Pump.fun against Tether appears to be changing narratives as the pair now records massive bullish participation. Pump.fun price seems to be making a turnaround after a move towards $0.002920 in recent times. As it stands, price action seems to be operating above the set of simple moving averages, as the Stochastic RSI shows signs of an impending northbound move.

To this end, if bullish momentum can increase beyond 689 million as seen on the 4-hour chart, Pump.fun price may stand the chance to hit above $0.004000. Conversely, a break below $0.002940 will signal a continuation of the previous short-term trend.

Meanwhile, @CoinGapemedia has provided a price prediction analysis for leading meme coins, highlighting Dogecoin, Shiba Inu, Pepe, and Pump.Fun. It was suggested that a wave of positive shift is ongoing in the sector as the meme coin market appears to be recovering from a recent dip. The analyst hinted that the meme coin market capitalization has reached $44.5 billion, reflecting a 1.9% growth within a 24-hour period.

PUMP/USDT Analysis: Gearing Up for More; What’s Next?

Technically, on the 1-hour timeframe, PUMP/USDT appears to be showing a positive move, extending to the north for the past six hours despite bearish efforts. As it stands, the pair seems to be projecting towards the short-term SMAs around $0.003040 and $0.003120.

To this end, if momentum is sustained, those limits may fast become support soon, but the overbought condition will pump.fun Price may experience a pullback in the coming session.

Pump.fun Price Makes a Turnaround Amidst Oversold Conditions
PUMPUSDT – Hourly Chart


You can purchase crypto coins here. Buy Crypto

Lucky Block (LBLOCK): Healthy Retest Strengthens the Breakout Case

Lucky Block (LBLOCK) is undergoing a natural and healthy retracement following its explosive 7.7% surge, a common technical phenomenon that serves to consolidate gains and establish a stronger foundation. This pullback represents a critical test of the new support levels and provides an opportunity for the trend to solidify before continuing its upward trajectory.

Daily Chart Analysis: Testing the Breakout Integrity

The daily chart shows a retracement that is testing the sustainability of yesterday’s powerful breakout. While the price has declined, the overall bullish structure remains largely intact. The Parabolic SAR indicator continues to provide a supportive signal from below the price action, confirming that the broader trend reversal initiated yesterday is still in effect. The MACD, while showing a pause in positive momentum, is undergoing a typical consolidation after a strong move.

Lucky Block (LBLOCK): Healthy Retest Strengthens the Breakout Case
LBLOCKUSDT – Daily Chart

The crucial support level to hold is now at 0.00001194, which aligns with the recent breakout zone. A successful hold here would confirm the strength of the new trend. The next higher resistance levels remain at 0.00001422 and 0.00001930. Stronger historical support sits at 0.00001037, providing a substantial safety net.

4H Chart Analysis: Short-Term Consolidation Builds Energy

The 4-hour chart details this retracement as a controlled move within a new uptrend. The price is pulling back to test the recent breakout level, a classic behavior that often precedes the next leg higher. The Parabolic SAR remains positioned to catch the price, indicating dynamic support is nearby. The MACD on this timeframe is flattening near equilibrium, reflecting a balanced momentum that typically resets before the next directional move.

Lucky Block (LBLOCK): Healthy Retest Strengthens the Breakout Case
LBLOCKUSDT – 4H Chart

Immediate resistance to regain is 0.00001366, with a break above that reopening the path toward 0.00001930. The current pullback is finding tentative support at 0.00001194, with a more substantial floor at 0.00001037.

Conclusion: A Constructive Pause in a New Uptrend

The current retracement is a standard and constructive phase following a significant breakout. It allows the market to absorb yesterday’s rapid gains and build a more stable base for the next advance. The preservation of the key bullish trend signals, particularly the Parabolic SAR’s supportive stance, suggests this is a pause within a new upward trend rather than a reversal. This consolidation offers a potential strategic opportunity ahead of the next wave of upward momentum.

Invest wisely, and let Lucky Block’s potential work in your favor. You can purchase Lucky Block here.  Buy LBLOCK

Ethereum Price Consolidates Within Critical Range; What’s Next?

Today, the Ethereum price has declined by 1.35%, lagging behind the broader market’s 0.9% dip. As it stands, the Ethereum price has failed to maintain a hold above the psychological $3,000 as the bears dominate with stalled recovery attempts.

Meanwhile, compounding technical breakdown is not the only problem, as renewed anxiety over the SEC’s latest regulatory framework resumes. This has sparked fresh compliance fears. Right now, Ethereum remains particularly vulnerable to this prevailing “risk-off” sentiment as investors retreat from larger altcoins.

Currently, Ethereum trades at $2,963.20 with over 95,000 traded volumes on the daily timeframe.

Ethereum Price Consolidates Within Critical Range; What’s Next?
ETHUSDT – Daily Chart

Technical Indicators

Major Resistance Levels: $3,095.91, $3,210.00, and $3,422.50

Major Support Levels: $2,900.00, $2,850.00, and $2,769.32

Technical Analysis

Technically, the Ethereum price appears to be declining after a prolonged period of sideways movement. Now, the operation is under the dynamic band level, as the participatory level suggests stalled activities for the day.

However, the momentum oscillator at the moment seems to be pointing to an upside move, but the bend of the blue line signal consolidation may be seen. To this end, if the $3,095 is reclaimed, the $2,769 may be the next hold.

Elliott Wave Structure Suggests Ethereum Price Is Approaching Critical Resistance

Ethereum is currently in a corrective phase, likely a wave B bounce within a larger downward move. This anticipated move is expected to face resistance around $3,033, where the market has already shown signs of consolidation. As it stands, while a bullish scenario exists, the primary view suggests one more decline to complete a fifth wave, which may potentially drive Ethereum prices toward the $2,258 area.

Meanwhile, in the short term, the market may see a minor upside move, probably toward $3,074, before a pullback. At this point, the structural support for this retracement is identified around $2,895, with deeper Fibonacci support between $2,839 and $2,943.

ETH/USDT Analysis: Short-term Momentum Battles Mid-Range Resistance

ETH/USDT on the 4-hour appears to bring every detail to the limelight, as recent candlestick development shows an intense struggle between the market forces. Meanwhile, with the contraction of the Bollinger, the consolidation may continue.

However, with the condition of the Stochastic RSI, an upside may be spotted after this moment, provided the bullish participatory level increases. Meanwhile, for now, the Ethereum price continues to hover around $2,962.23.

Ethereum Price Consolidates Within Critical Range; What’s Next?
ETHUSDT – 4H Chart


You can purchase crypto coins here. Buy Crypto

Uniswap (UNI) Price Prediction: UNI/USDT Fails to Gather the Needed Push

Date: January 29, 2026

The Uniswap market has continued to trade below the psychological price level at the $5.00 mark. Even the ongoing session remains below this psychological level.

UNI/USDT Long-Term Trend — Bearish (Daily Chart)

Key Price Levels

Resistance: $5.00, $6.00, $7.00

Support: $4.50, $3.00, $2.50

Uniswap (UNI) Price Prediction: UNI/USDT Fails to Gather the Needed Push

Price activity in the Uniswap daily market has continued to slide to lower levels below the 9-day Exponential Moving Average (EMA) line. The last price candle corresponding to the ongoing session has appeared red off the 9-day EMA curve. Be that as it may, the Stochastic Relative Strength Index (SRSI) indicator lines are still poised upward, rising from the oversold region with only a slight deflection from their upward path.

Uniswap Price Prediction: UNI Slight Deflection Threatens Continued Price Growth

While the Uniswap market rebounded upward during the previous session, it can be seen that the 9-day EMA curve has presented a barrier to further upward price movement.

As such, the ongoing session has faced rejection at this technical region. Meanwhile, the SRSI retains its general upward bearing. However, this resistance at the 9-day EMA curve appears strong and is likely to be respected, given the current market momentum.

Uniswap Price Prediction: UNI/USDT Downward Rebound Threatens Short-Term Gains (4-Hour Chart)

On the Uniswap 4-hour chart, the earlier downward rejection on the daily timeframe appears to have dampened short-term upside expectations. In this timeframe, the previous session caused a strong downward pullback below the 9-day EMA curve.

Uniswap (UNI) Price Prediction: UNI/USDT Fails to Gather the Needed Push

However, the ongoing session has shown a modest upward recovery and therefore keeps the market below the 9-day EMA line. At the same time, the SRSI indicator lines are still dropping rapidly into the oversold region. In the short term, the market may descend toward the $4.50 price level.

Get Uniswap (UNI) here. Buy UNI 

Enjin (ENJ/USDT) Downtrend Emerges after a Double Top Pattern

ENJ/USD Price Analysis: Breakdown Below Double Top Neckline Triggering a Downtrend

ENJ/USD broke below the double-top neckline at $0.0660 with strong momentum, then retested the level before making an impulsive move to the downside. Triggering a downtrend that begins on October

ENJ/USD Key Levels:

Support Levels: $0.0270, $0.0250
Resistance Levels: $0.0360, $0.0660

Enjin (ENJ/USDT) Downtrend Emerges after a Double Top Pattern

On the daily timeframe, price around $0.0270 shows a weakening downtrend with short-term consolidation. Bulls attempted an upside breakout but were rejected by bears near $0.0360. Candles forming around the Bollinger Band midline further confirm fading momentum from the prior trend.

On the daily timeframe, the Relative Strength Index (RSI) indicates the price is in the oversold zone, signaling a potential uptrend. The market touching the lower Bollinger Band suggests a possible uptrend and a likely breakout of the trendline and $0.0360 supply zone.

Enjin (ENJ/USDT) Downtrend Emerges after a Double Top Pattern

Market Expectation

On the 4-hour timeframe, the price action from January 5 to January 25 shows a visible confluence zone and a liquidity sweep rather than a continuation of the downtrend. Another ranging market occurred from January 25 to January 28. Two confluence points in the trend signal that a breakout may happen soon.

You can purchase Lucky Block here.  Buy LBLOCK

Note: Cryptosignals.org is not a financial advisor. Do your research before investing your funds in any financial asset or presented product or event. We are not responsible for your investing results

InfoFi Explained: How Information Is Becoming a Tradable Asset in Web3

The digital economy runs on attention, data, and influence — but until now, the financial rewards from these assets have largely gone to big tech companies. InfoFi, short for Information Finance, is emerging as a new Web3 movement that aims to change that by turning information itself into a financial instrument.

At its core, InfoFi uses blockchain and AI to assign measurable value to knowledge, attention, and data. Instead of platforms harvesting user behavior for advertising profits, InfoFi systems allow individuals to directly own, trade, and monetize the information they generate.

This shift represents a fundamental rethink of how value flows on the internet — one where users are no longer the product, but participants in an open market for information.

From Attention Economy to Information Markets

In traditional Web2 platforms, user attention is captured and sold behind the scenes. Algorithms determine what goes viral, data is extracted silently, and profits are concentrated in a few corporations.

InfoFi flips this model by bringing transparency and ownership to information markets. Using smart contracts, protocols can create open marketplaces where information, predictions, and reputation are priced in real time. Users can speculate on outcomes, back emerging narratives, or share data selectively—all without intermediaries.

The idea gained major visibility in 2024 when Ethereum co-founder Vitalik Buterin described InfoFi as a way to improve social media, governance, research, and even journalism by aligning financial incentives with truth and insight rather than engagement bait.

How InfoFi Protocols Function

InfoFi platforms typically operate by turning information into tokens or market instruments that can be traded. These markets rely on collective intelligence — the idea that crowds can often price outcomes more accurately than centralized institutions.

Prediction Markets

In prediction-based platforms, users trade shares representing future outcomes. The price of each share reflects the market’s belief about the likelihood of an event occurring, turning knowledge into a liquid asset. This model has gained traction around elections, economic data, and policy decisions.

Attention and Mindshare Markets

Some InfoFi applications focus on attention itself. Users can invest in creators, narratives, or topics before they become popular. As interest grows, early supporters benefit financially, linking virality directly to economic reward.

User-Owned Data Markets

Rather than giving away personal data for free, users can choose to sell access to their on-chain activity or social signals to advertisers, researchers, or AI models in exchange for crypto incentives—reclaiming control over their digital identity.

Key Projects Driving the InfoFi Narrative

Several protocols are already shaping the InfoFi ecosystem:

  • Polymarket has become the most recognized decentralized prediction market, where users trade on the outcomes of real-world events, effectively creating live probability markets.

  • Kaito uses AI to filter high-value insights from crypto social media and governance forums, rewarding users who contribute meaningful analysis rather than noise.

  • Ethos focuses on reputation, enabling users to vouch for one another on-chain and build credibility-based networks that help reduce misinformation and scams.

Why InfoFi Matters

As AI increases the volume of content online, separating signal from noise becomes harder—and more valuable. InfoFi offers a way to financially reward accuracy, insight, and early knowledge, rather than clicks and outrage.

If successful, Information Finance could reshape how we interact with news, social media, research, and even governance—replacing opaque algorithms with open markets where truth has tangible value.

Trade crypto coins on BYBIT