Polkadot Price Faces Critical Test as Oscillator Signals Turnaround

Polkadot against Tether in recent times has gone down significantly over 24 hours, sliding below the $2.00 psychological level. As it stands, the Polkadot price appears to be operating under the recent support as the price declines by 1.11% towards $1.70. Fundamentally, some factors seem to be exacerbating this decline, as it appears that the January 20th network upgrade seems to be triggering a classic sell reaction. Right now, investors are rotating capital into Bitcoin amid a risk-off macro environment. Currently, Polkadot remains stagnant despite its upcoming March 2026 supply cap, with the price trading at $1.843 at the time of writing.

Polkadot Price Faces Critical Test as Oscillator Signals Turnaround
DOTUSDT – Daily Chart

Technical Indicators

Major Resistance Levels: $2.100, $2.480, and $3.89

Major Support Levels: $1.700, $1.500, and $1.300

Polkadot Price Technical Turnaround

In a recent report, @GainMuse opined that the Polkadot price is showing signs of a technical turnaround after a prolonged decline. The analyst suggests the token is forming a bottom in a zone often marked by investor interest.

As it stands, the analyst is pointing to a $1.80–$1.85 support level, stating that the token is positioned for a potential upside move toward an immediate target of $1.95.

Technical Analysis

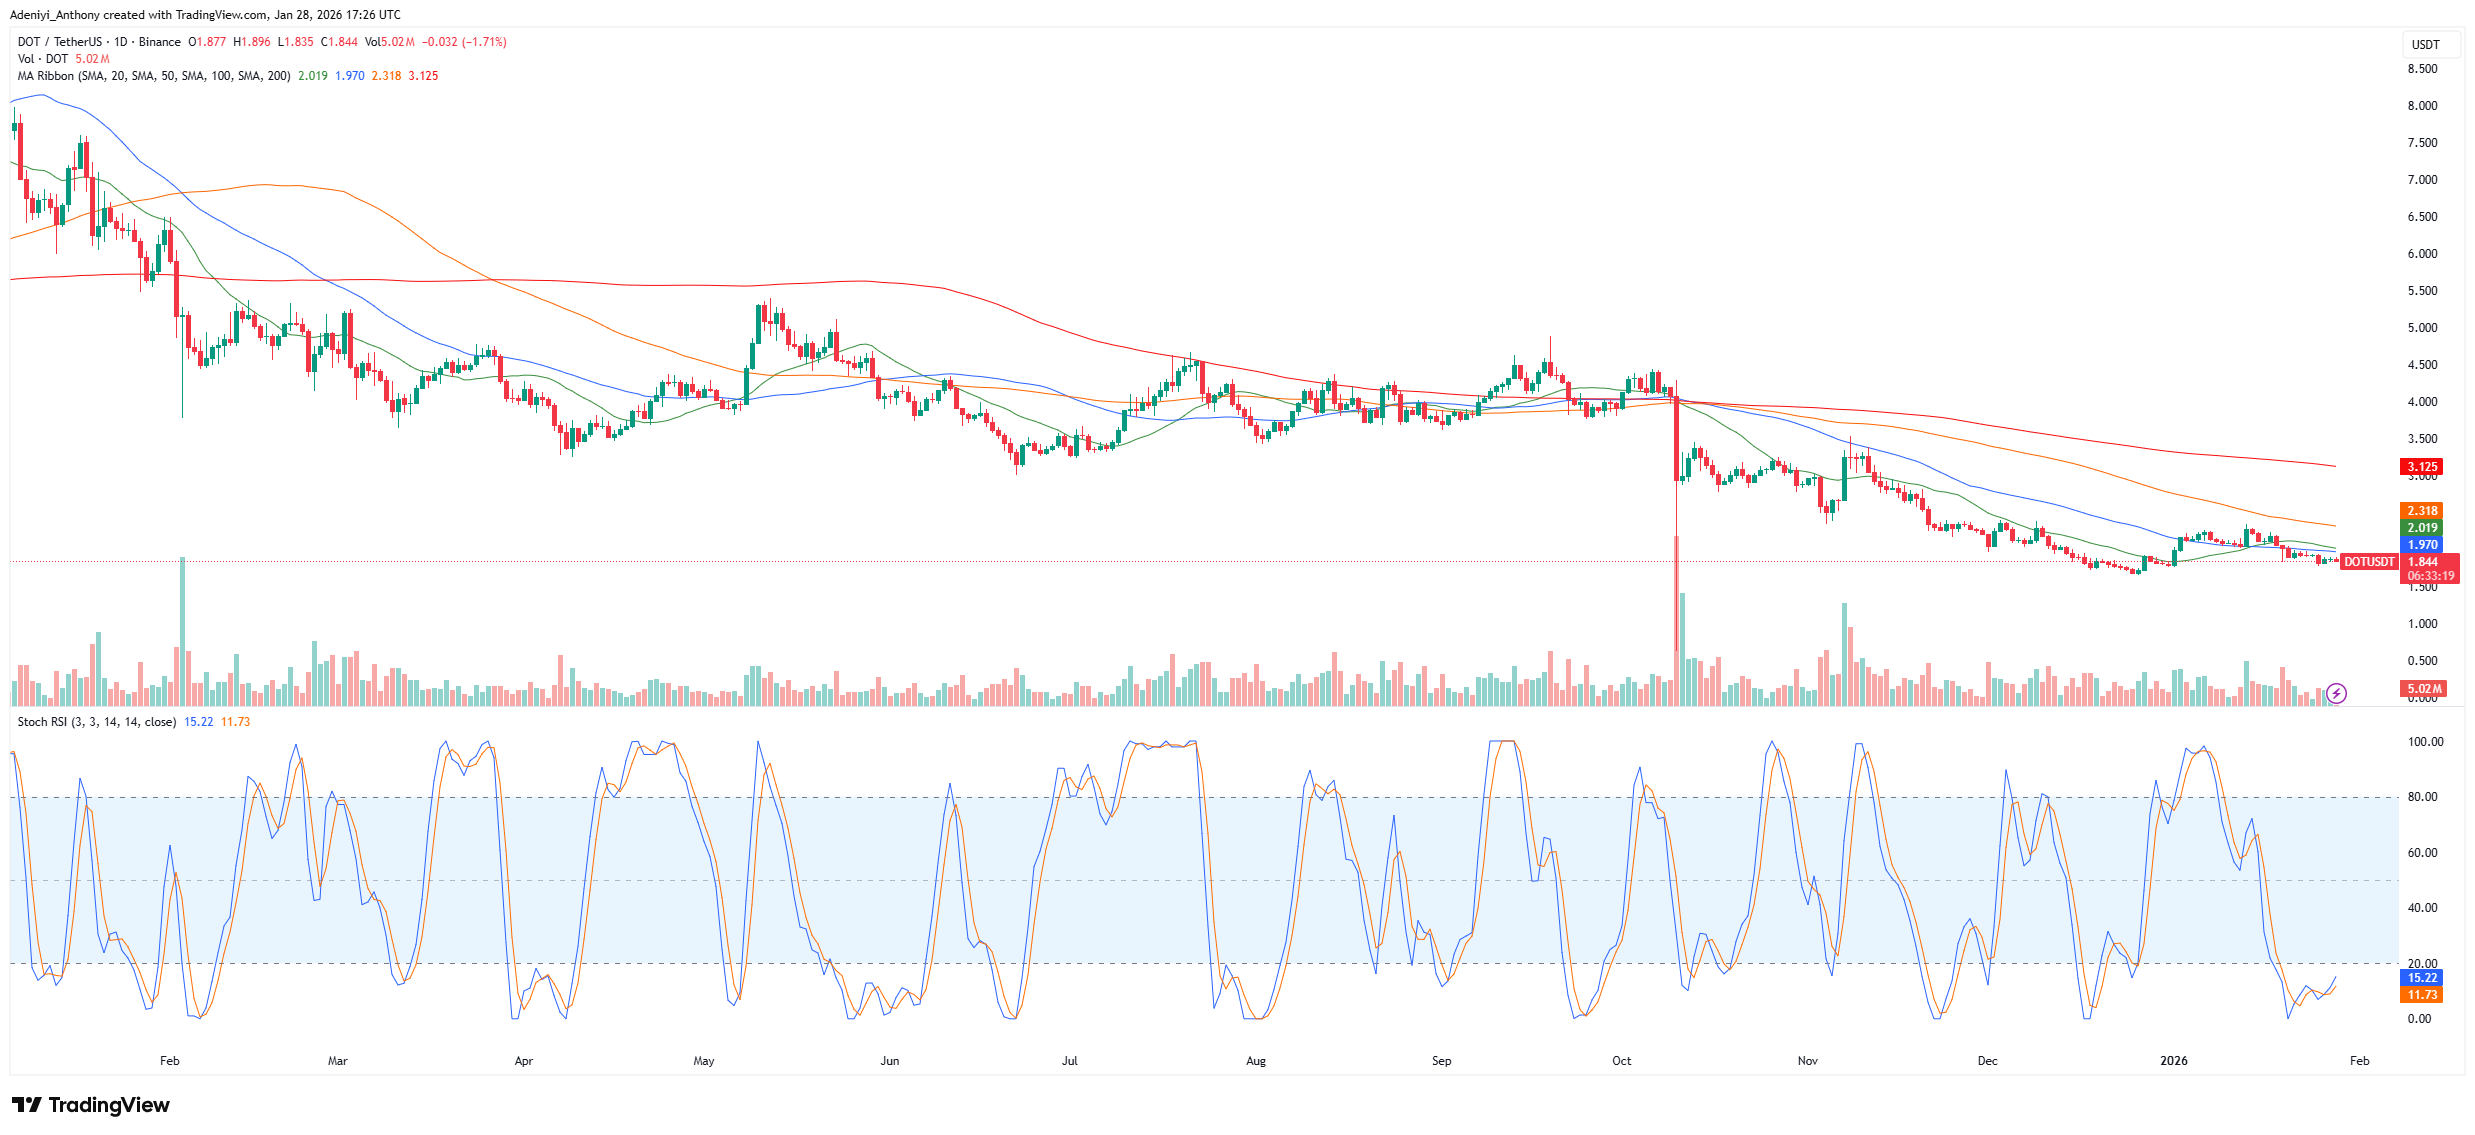
On the daily timeframe, Polkadot price appears trapped within a broader downtrend with the formation of a lower high as the price remains under $1.970 (50-SMA).

However, the Stochastic RSI appears to be displaying a contrasting view. The line of the momentum oscillator seems to be recovering from the oversold region.

At the moment, the volume indicator shows 5.02 million has been traded so far on the 1-day chart. To this end, if the $2.019 remains unbroken, the larger trend may continue.

Polkadot at a Crucial Position

Polkadot price remains in a critical accumulation phase, oscillating near psychological support levels. However, the immediate technical floor sits at $1.79, with a secondary zone between $1.51 and $1.54. Meanwhile, this condition may change if Bitcoin dominance continues.

To this end, a confirmed trend reversal requires a breakout above $2.50 to shift the daily market structure. However, current stagnant price action suggests a lack of momentum.

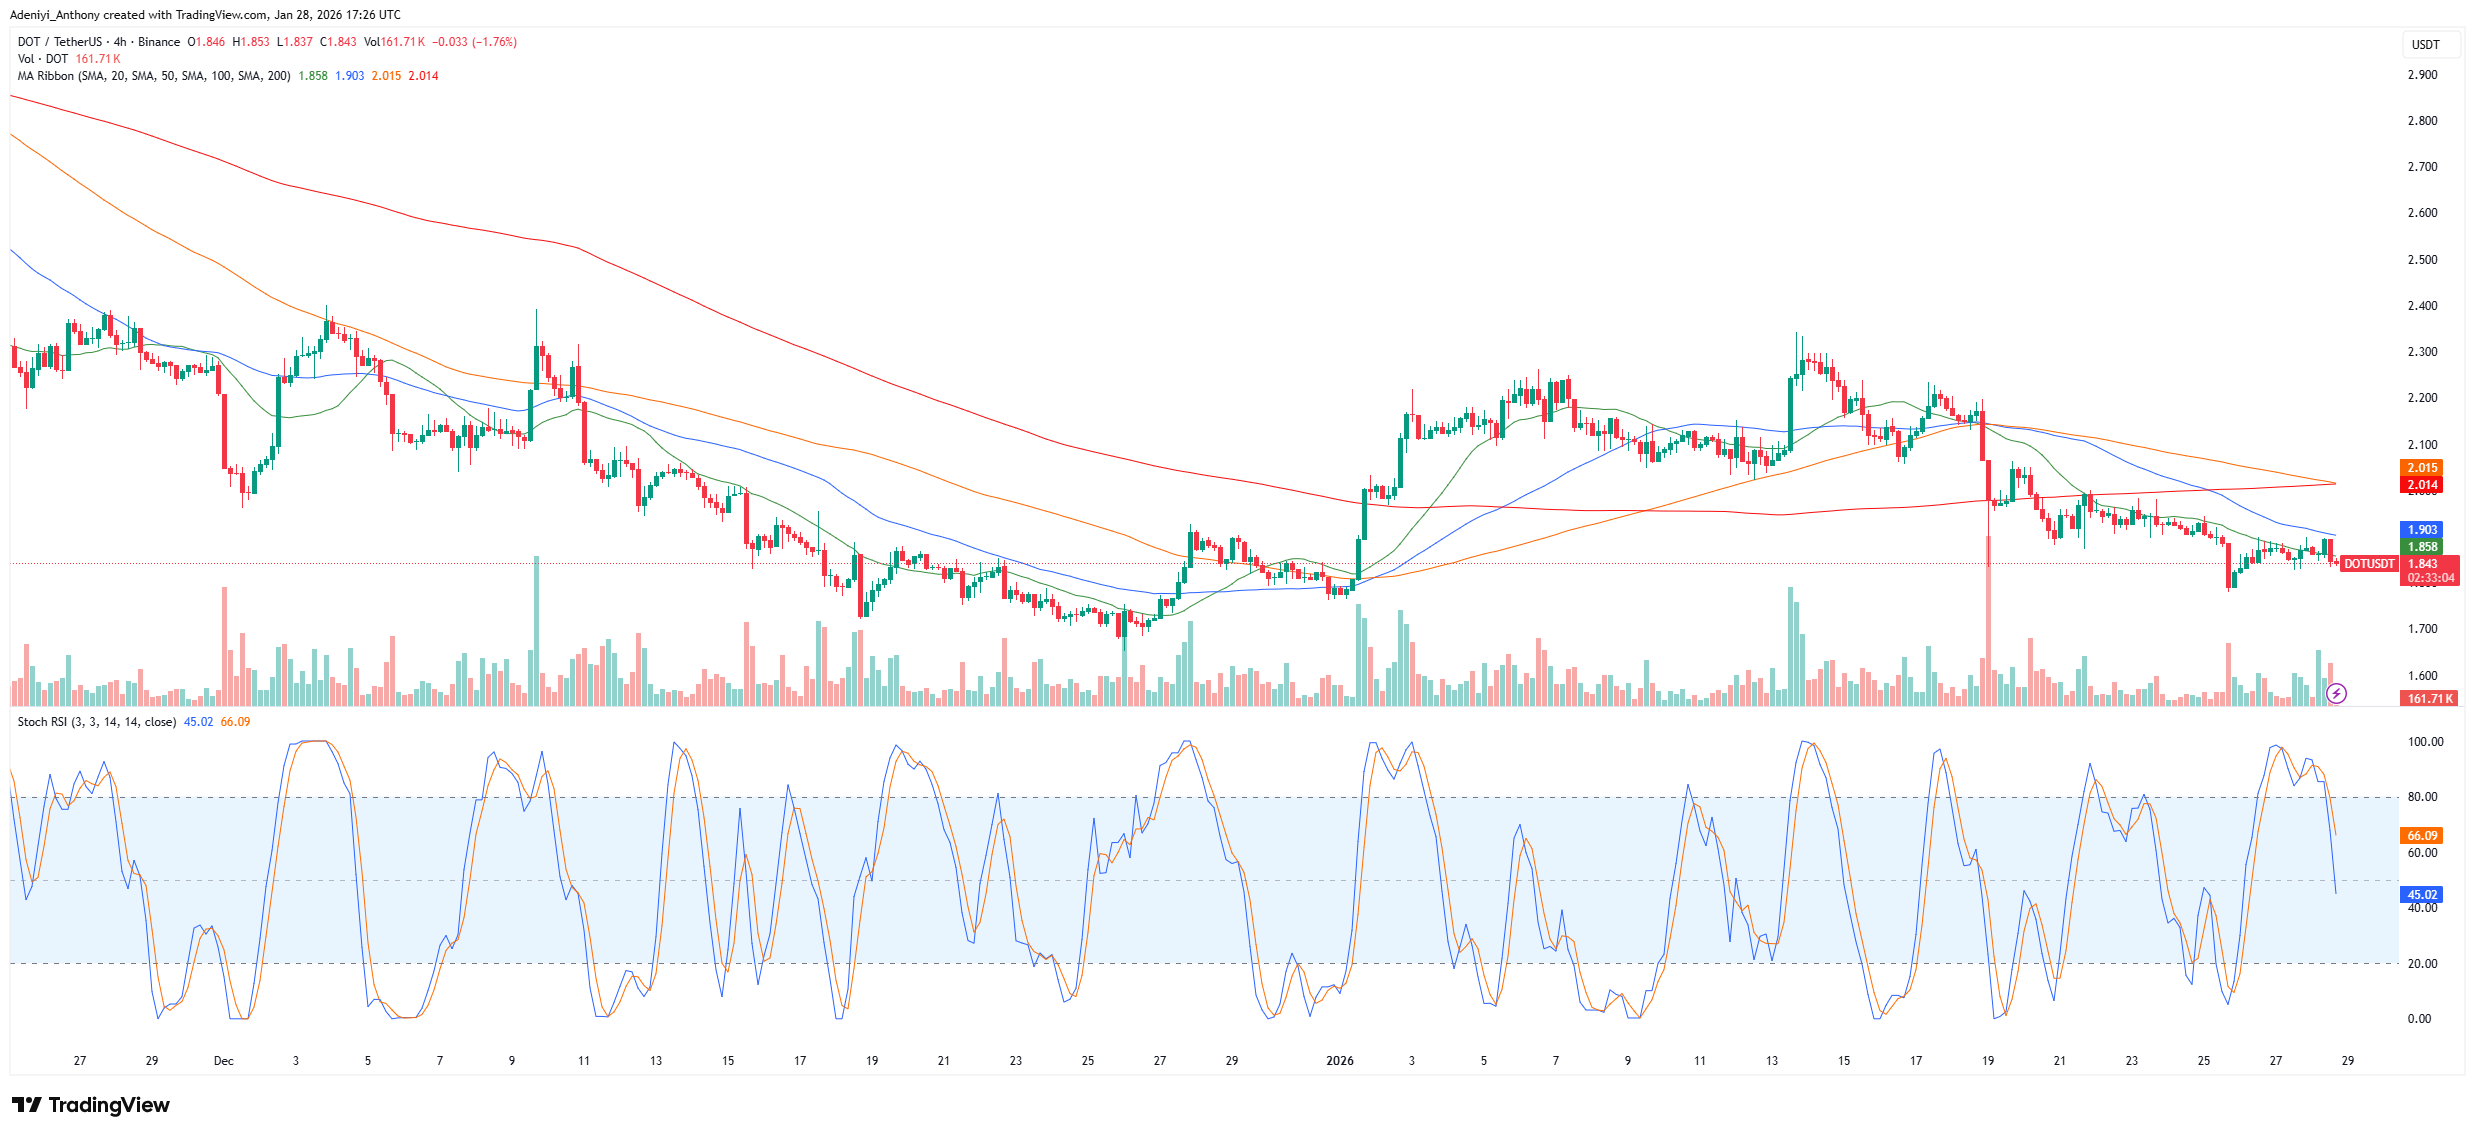
DOT/USDT Analysis: Suspension Above $1.858 Seems to be Failing

DOT/USDT on the 4H chart appears to present an opposing view. Though the Polkadot price operates below the moving averages, the Stochastic momentum oscillator is creating an impression that the price might need to test a lower level for a move north if bullish momentum increases. To this end, if the price fails to maintain the $1.800 range for an upside move, a rapid move to $1.79 may occur.

Polkadot Price Faces Critical Test as Oscillator Signals Turnaround
DOTUSDT – 4H Chart


You can purchase crypto coins here. Buy Crypto

SUI/USDT Holds Near $1.4560 as Momentum Builds with Modest Bullish Bias

SUI/USDT Price Analysis – January 27th

SUI (SUI/USDT) has shown resilience above the $1.4560 level, with price action stabilizing after a dip earlier in the week. Buyers have regained control, but momentum remains moderate, with both bullish and bearish forces battling near key levels. Despite the recovery from recent lows, momentum indicators suggest caution.


SUI/USDT Daily Chart Outlook (Key Levels)

Support Zones: $1.2710, $0.5800
Resistance Zones: $1.8140, $3.0903

SUI/USDT Holds Near $1.4560 as Momentum Builds with Modest Bullish Bias

SUI/USD Long-Term Trend – Neutral (Daily Chart)

SUI/USD is currently trading at $1.4566, up 0.88% on the session. The Momentum indicator remains negative at -0.3300, but the Accumulation/Distribution line has increased to 460.9M, suggesting rising demand and accumulation.

What is the market outlook for SUI?

Price action recently printed a bullish candle, closing near the high of $1.4630, indicating that buyers are stepping in. However, the Momentum readings remain weak, and the price must hold above $1.4600 for further upside potential.

If the $1.4600 level is reclaimed with volume, the next resistance targets lie at $1.6000 and $1.8140. Failure to hold $1.4400 could lead to a retest of $1.4000 and $1.2718. The overall market sentiment remains cautiously bullish.

The recent rally from $1.4400 toward $1.4630 is encouraging, but the Momentum indicator still signals potential exhaustion. A clean break above $1.4600 would signal renewed bullish momentum, but failure to hold key support levels could open the path toward lower levels.

SUI/USDT Holds Near $1.4560 as Momentum Builds with Modest Bullish Bias

SUI/USDT Short-Term Trend – Bullish (4-Hour Chart)

On the 4-hour chart, SUI/USD is showing signs of intraday strength. Price is currently at $1.4567, up 1.56%, and candles are forming higher lows and higher closes, indicating short-term bullish intent. The Momentum indicator is slightly positive at 0.0111, confirming short-term accumulation. Additionally, the Accumulation/Distribution line at 282.18M suggests that demand is increasing at these levels.

The market is ranging between $1.4327l0 and $1.4574, with liquidity clustering near the $1.4450–$1.4550 zone. If price breaks above $1.4600 with volume, a rally toward $1.5000 and $1.6000 is likely. Conversely, failure to hold $1.4400 could lead to a pullback toward $1.4000.


SUI/USDT Market Statistics

Current Price: $1.4566
Market Capitalization: $1.03B
24H Trading Volume: $350.00M

Place winning SUI trades with us. Get SUI here

Pyth Network (PYTH/USD) Regains Ground Above $0.060 as Bulls Return

The Pyth Network has cleared an important milestone by breaking above the $0.06 price level and sustaining trading above it. This move typically attracts renewed bullish interest; however, given the current market volatility, bulls will need to push price beyond the $0.068 and $0.070 resistance levels to firmly establish a sustained bullish recovery. Until then, upward momentum remains tentative, and further confirmation is needed to validate continuation to the upside.

Pyth Network (PYTH/USD) Market Data

  • PYTH/USD Price Now: $0.066
  • PYTH/USD Market Capitalization: $327.8 million
  • PYTH/USD Circulating Supply: 5.7 billion PYTH
  • PYTH/USD Total Supply: 9.9 billion PYTH
  • PYTH/USD CoinMarketCap Ranking: #127


Beyond the Price: Exploring Equity Perps and Market Structure with BitMEX

In this discussion, @sudhu_aru from @BitMEX dives deep into the evolving derivatives landscape, covering equity perpetuals, market structure, and the growing role of Pyth Pro in providing high-quality price data. The conversation highlights how institutional-grade data and innovative market design are shaping the future of onchain and offchain trading infrastructure.

Key Levels to Monitor

  • Resistance: $0.07, $0.71, $0.72
  • Support: $0.06, $0.055, $0.05

Pyth Network (PYTH/USD) Regains Ground Above $0.060 as Bulls Return

Pyth Network Analysis: Technical Viewpoint

The Bollinger Bands currently span a wide range between $0.052 and $0.072, indicating a significant increase in market volatility. This heightened volatility could challenge the ongoing bullish recovery, as bears may also take advantage of the expanded price swings. A key resistance zone has formed between $0.068 and $0.070, and a decisive breakout above this area would help establish and confirm a stronger bullish recovery for the Pyth Network.

Pyth Network (PYTH/USD) Regains Ground Above $0.060 as Bulls Return

PYTH/USD 4-Hour Chart Outlook

Zooming into the 4-hour chart, we can see that the bullish recovery is progressing with caution. At the current price level around $0.066, demand and supply are evenly balanced, resulting in a four-price doji on the ongoing 4-hour trading session. The continuation of the bullish move now depends on a decisive break and hold above the $0.066 level, which could encourage a further price surge toward the $0.070 resistance zone.

Trade crypto coins on BYBIT

Gold Streaming Model Powers Wheaton’s $3B Expansion Strategy

Wheaton Precious Metals is positioning itself for long-term growth as rising gold prices reshape the mining industry. Speaking with Kitco News at the Vancouver Resource Investment Conference (VRIC) 2026, Wheaton CEO Randy Smallwood explained that the gold streaming model allows the company to remain protected from rising production costs that are increasingly affecting traditional miners.

He stated that while higher gold prices improve revenues, they also force miners to process lower-quality ore, which raises costs and compresses margins. According to Smallwood, Wheaton avoids this pressure by locking in metal purchase prices through long-term streaming contracts.

Gold Streaming Model Shields Wheaton From Rising Costs

Smallwood said that Wheaton’s contracts fix the price it pays for gold in advance, which removes exposure to inflation in labor, fuel, and processing. As of Jan. 27, gold was trading above $5,000 per ounce, a level that has encouraged miners to extract material that was previously uneconomic.

Gold Streaming Model Powers Wheaton’s $3B Expansion Strategy

He noted that this trend increases operational costs for producers but does not affect streaming companies. In reported remarks, Smallwood explained that this cost gap between miners and streamers is expected to widen over the next two to three years, strengthening Wheaton’s margins in a high-price gold environment.

Gold-Focused Capital Strategy and Growth Outlook

Smallwood highlighted Wheaton’s recently secured Helo gold stream as an example of the company’s approach. He described the project as a historic Canadian asset that lacked investment under previous owners. Wheaton provided $300 million in development funding in exchange for a gold stream, valuing the metal rather than taking an equity stake. He said this structure avoids shareholder dilution and pays full net asset value for gold production.

Looking ahead, Smallwood reported that Wheaton expects to generate over $3 billion in cash flow in 2026. He stated that this capital will be directed toward late-stage gold projects with completed feasibility studies and permits. He added that gold is increasingly behaving like a currency rather than a typical commodity, supported by central bank demand and its role as a neutral store of value. This shift, he said, reinforces the long-term case for gold-focused streaming agreements.


In order to place winning trades with us via Bybit, you can open an account here.

Bitcoin (BTC) Price Prediction: BTC/USDT Heads Back Upward

Date: January 27, 2026

Price action has remained capped below a psychological resistance level in the Bitcoin market. Earlier attempts to break above this resistance failed, resulting in a downward retracement over two sessions. Let’s take a look at what may unfold next.

BTC/USDT Long-Term Trend — Bullish (Daily Chart)

Key Price Levels

Resistance: $90,000, $92,500, $95,000

Support: $89,000, $88,000, $87,000

Bitcoin (BTC) Price Prediction: BTC/USDT Heads Back Upward

The Bitcoin market recorded a positive rebound in the previous session. The latest price candle is heading toward the psychological $90,000 resistance level; however, it features an upper shadow and remains below the 9-day Exponential Moving Average (EMA). Meanwhile, the lines of the Stochastic Relative Strength Index (SRSI) are beginning to turn upward following a bullish crossover.

Bitcoin Price Prediction: BTC/USDT Buyers Are Converging

The BTC market appears to be aligning for a notable upward rebound. The most recent price candle suggests continuity in the ongoing upside retracement.

Nevertheless, price action remains below the 9-day EMA curve while closing in on the $90,000 threshold. At the same time, the SRSI indicator lines are still in the oversold region but have delivered a bullish crossover. The lines are now slightly tilted upward, indicating potential for continued upward movement.

Bitcoin Price Prediction: BTC/USDT Short-Term Targets Stay in Focus (4-Hour Chart)

The 4-hour Bitcoin chart clearly highlights recent market behavior. Here, the last two price candles are green, mirroring the price action seen on the daily chart.

Bitcoin (BTC) Price Prediction: BTC/USDT Heads Back Upward

The most recent candle is larger than those of previous sessions and continues to trade above the 9-day EMA. Additionally, the SRSI indicator lines are converging toward a bullish crossover just above the 80 level. From a technical standpoint, this supports the view that the market could gain momentum toward the $90,000 price level.

Get Bitcoin (BTC) here. Buy BTC

CoinMarketCap 20 Index (CMC20/USD) Holds Near $178.90 as Momentum Slips and Sellers Reassert Control

CMC20/USD Price Analysis – January 26th

The CoinMarketCap 20 Index (CMC20/USD) remains under sustained pressure, with price action compressing below the critical $180.00 pivot. After a failed recovery attempt toward the $186.00 zone, sellers stepped back in aggressively, forcing price lower and trapping late buyers. The crypto price continues to lean bearish, and momentum signals suggest downside risk remains active.


CMC20/USD Daily Chart Outlook (Key Levels)

Support Zones: $176.90, $97.40
Resistance Zones: $202.83, $217.50

CoinMarketCap 20 Index (CMC20/USD) Holds Near $178.90 as Momentum Slips and Sellers Reassert Control

CMC20 Long Term Trend- Bearish (Daily Chart)

CMC20/USD is currently trading around $178.90, down 4.03% on the session. Momentum readings are firmly bearish, with the Momentum indicator printing -22.73, reflecting a clear loss of bullish control. Although volume data is unavailable, the nature of recent candles suggests distribution rather than accumulation.

What is the market outlook for CMC20?

Price recently printed a strong bearish daily candle, rejecting sharply from the $186.60 region and closing near the session low. This type of candle structure typically signals aggressive selling interest and weak buyer defense.

As long as price remains capped below $180.00, downside continuation toward $176.97 remains the base case. A deeper extension toward the mid-$160s cannot be ruled out if support fails with acceptance.

From a structural standpoint, the index remains below its key resistance band, with no confirmed bullish reversal signals. Traders should remain patient and reactive, watching for either a clean reclaim above $186.00 or a breakdown below $176.50 to confirm the next directional impulse.

CoinMarketCap 20 Index (CMC20/USD) Holds Near $178.90 as Momentum Slips and Sellers Reassert Control

CMC20 Short Term Trend- Bearish (4-Hour Chart)

On the 4-hour timeframe, CMC20/USD continues to show intraday weakness. Price is hovering near $178.90, down 0.32%, while forming a sequence of lower highs and lower closes. Short-term momentum remains negative at -7.91, reinforcing the bearish intraday bias.

The bulls must reclaim $180.00 with a strong, wide-bodied candle and follow-through to invalidate the short-term bearish structure. If achieved, this could force short covering and open the path toward $186.00, followed by $202.83.

CMC20/USD Market Statistics
Current Price: $185.00
Market Capitalization: $6.65M
24H Trading Volume: $4.50M

You can purchase DTF here: BUY DTF

Chiliz (CHZ/USD) Surges after It Breaks Two Resistance Levels

CHZ/USD Price Analysis: CHZ/USD Breaks the Neckline of a Double Bottom Chart Pattern

CHZ/USD rallied and broke the double bottom neckline at level $0.0280 and two resistance zones at price levels $0.0380 and $0.0460. This shows the momentum of buyers in the market.

CHZ/USD Key Levels

Support Levels: $0.0280, $0.0260
Resistance Levels: $0.0380, $0.0460

Chiliz (CHZ/USD) Surges after It Breaks Two Resistance Levels

On the daily timeframe, a double bottom pattern formed on a support, which makes that level a confluence zone and more valid at price level $0.0280. After breaking the neckline of the bullish double pattern at price level $0.0280, the direction of the trend is confirmed. The market moves with impulse with small pullbacks.

On the daily timeframe, price pulled back and reversed from another confluence zone of Order Block and Fibonacci discount zone (below 0.5%) at price level $0.0520, continuing the uptrend. The Stochastic Relative Strength Index (Stoch RSI) shows the price is in the oversold area, meaning price may continue the uptrend.

Chiliz (CHZ/USD) Surges after It Breaks Two Resistance Levels

Market Expectation

The 4hr timeframe shows a double bottom chart pattern forming at the confluence zone at price level $0.0520. Price broke above the neckline at price level $0.0550. This is a good continuation signal. The candlestick forming close to the upper band of the Bollinger Band is also a good uptrend confirmation.

You can purchase Lucky Block here.  Buy LBLOCK

Note: Cryptosignals.org is not a financial advisor. Do your research before investing your funds in any financial asset or presented product or event. We are not responsible for your investing results.

Pi Network (PI/USD) Breaks Consolidation to the Downtrend

PI/USD Price Analysis: PI/USD Breaks Below the Strong Support

PI/USD makes a second breakout attempt within the months of August to January below the ranging market. This move shows sellers are trying to take control again. Like the first breakout, this may be a short bearish trend because of the lack of momentum from the bears.

PI/USD Key Levels

Support Level: $0.1950, $0.1950
Resistance Level: $0.2750, $0.3423

Pi Network (PI/USD) Breaks Consolidation to the Downtrend

PI/USD was in the consolidation phase from 25 September to 18 January before price broke below. The lack of a momentum candle in the breakout and the Stochastic Relative Index (Stoch RSI) showing the price is in the oversold area mean the market may reverse back to the uptrend. This may signal a false breakout or a short downtrend.

On the daily timeframe, the bears tried to push the market below at price level $0.3420 after the falling wedge pattern, but they lacked momentum to follow through, triggering a consolidation phase. Another breakout of the consolidation zone, though with weak momentum, can be seen.

Pi Network (PI/USD) Breaks Consolidation to the Downtrend

Market Expectation

The 4hr timeframe shows price breaking below both the lower Bollinger Band and the support zone at price level $0.1960. A double bottom is already forming at price level $0.1700, which is either a signal for trend reversal or a pullback. The market is currently in a downtrend with no strong momentum. This may be a short downtrend or a false breakout.

You can purchase Lucky Block here.  Buy LBLOCK

Note: Cryptosignals.org is not a financial advisor. Do your research before investing your funds in any financial asset or presented product or event. We are not responsible for your investing results.

Mana (MANA/USDT) Undergoing a Trend Shift

MANA/USDT Price Analysis: MANA/USDT broke below the falling wedge and change trend

MANA/USDT broke below the falling wedge pattern, thereby having a strong momentum candle in the month of October. It later retested before continuing its downtrend.

MANA/USDT Key Levels

Support Levels: $0.2440, $0.3540
Resistance Levels: $0.1160, $0.1150

Mana (MANA/USDT) Undergoing a Trend Shift

The daily timeframe shows a Downtrend from a falling wedge pattern which lasted from October – December, and price reach the $0.1160 support zone which triggered trend reversal. The Candlestick forming close to the upper band of the Bolllinger Band in January also confirm the market is now in an uptrend.

On the daily timeframe, the stochastic Relative Strength Index (Stoch RSI) is in the oversold area. This happens when the market reaches the Point of Interest (POI), which is the support level of $0.1160, further confirming the market bias.

Mana (MANA/USDT) Undergoing a Trend Shift

Market Expectation

The 4hr timeframe shows the market Change of Character (CHOCH) in the uptrend direction at price level $0.1630, which is a good confirmation that the Uptrend is gaining strength. A liquidity grab can also be seen at the price level $0.1450. After this price manipulation, the market can be expected to continue in its initial direction with more momentum.

You can purchase Lucky Block here.  Buy LBLOCK

Note: Cryptosignals.org is not a financial advisor. Do your research before investing your funds in any financial asset or presented product or event. We are not responsible for your investing results.