Axelar (AXL/USD) Pushes Through Resistance; Coin Going to the Moon?

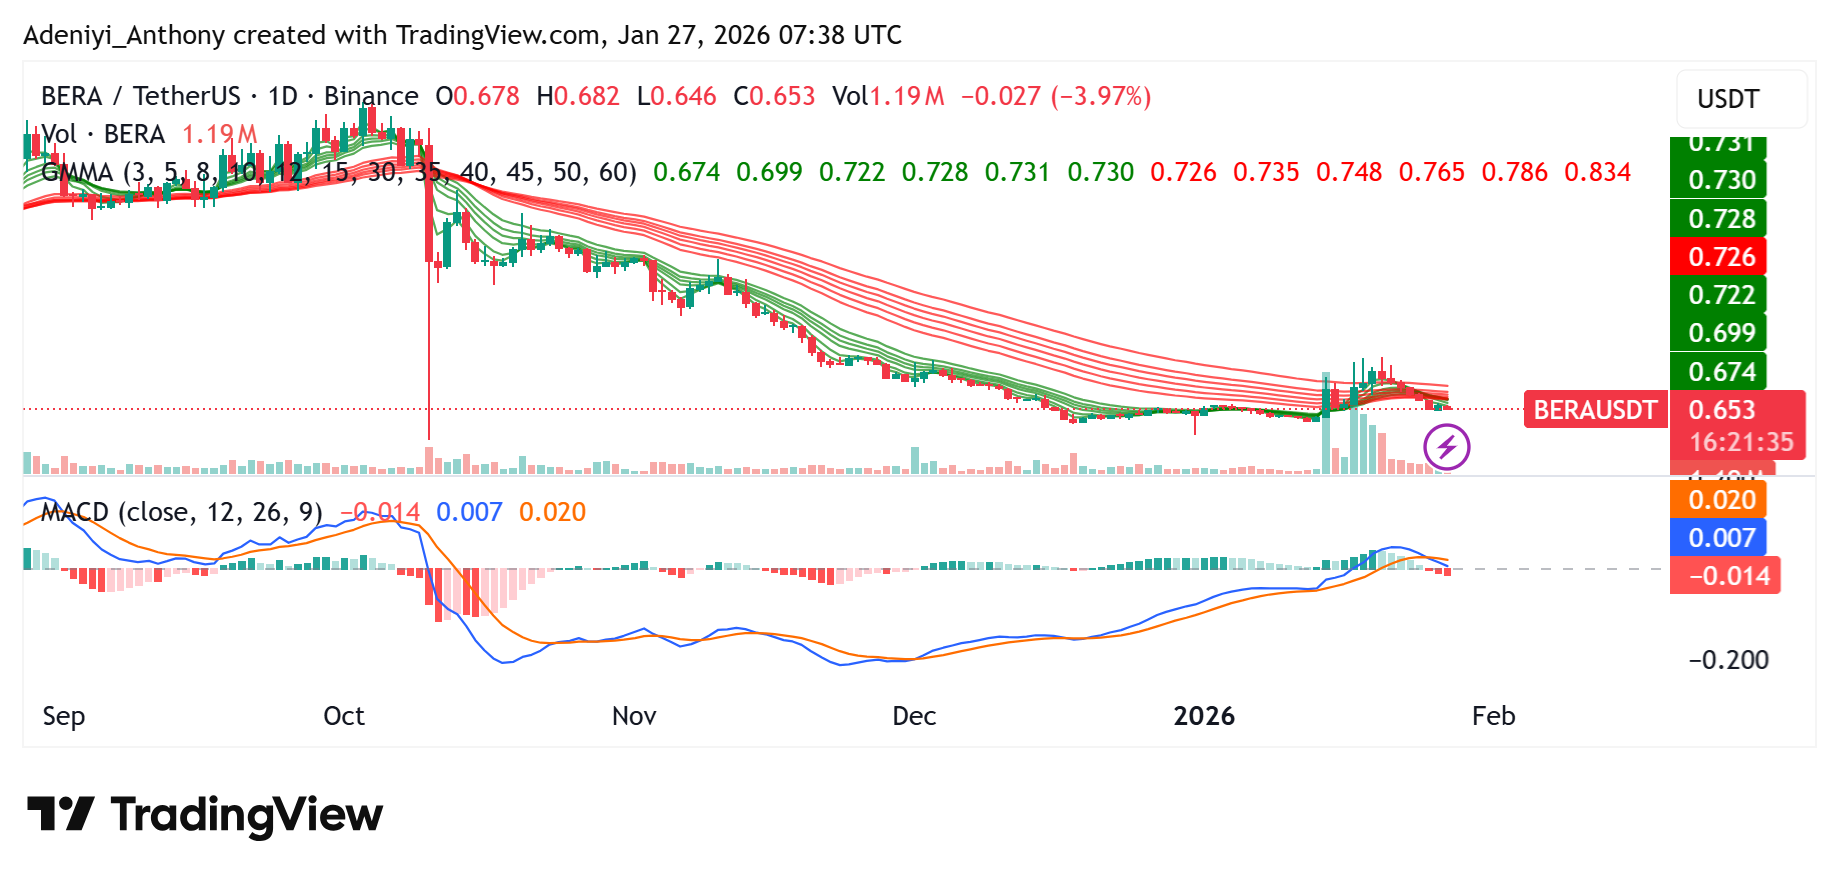
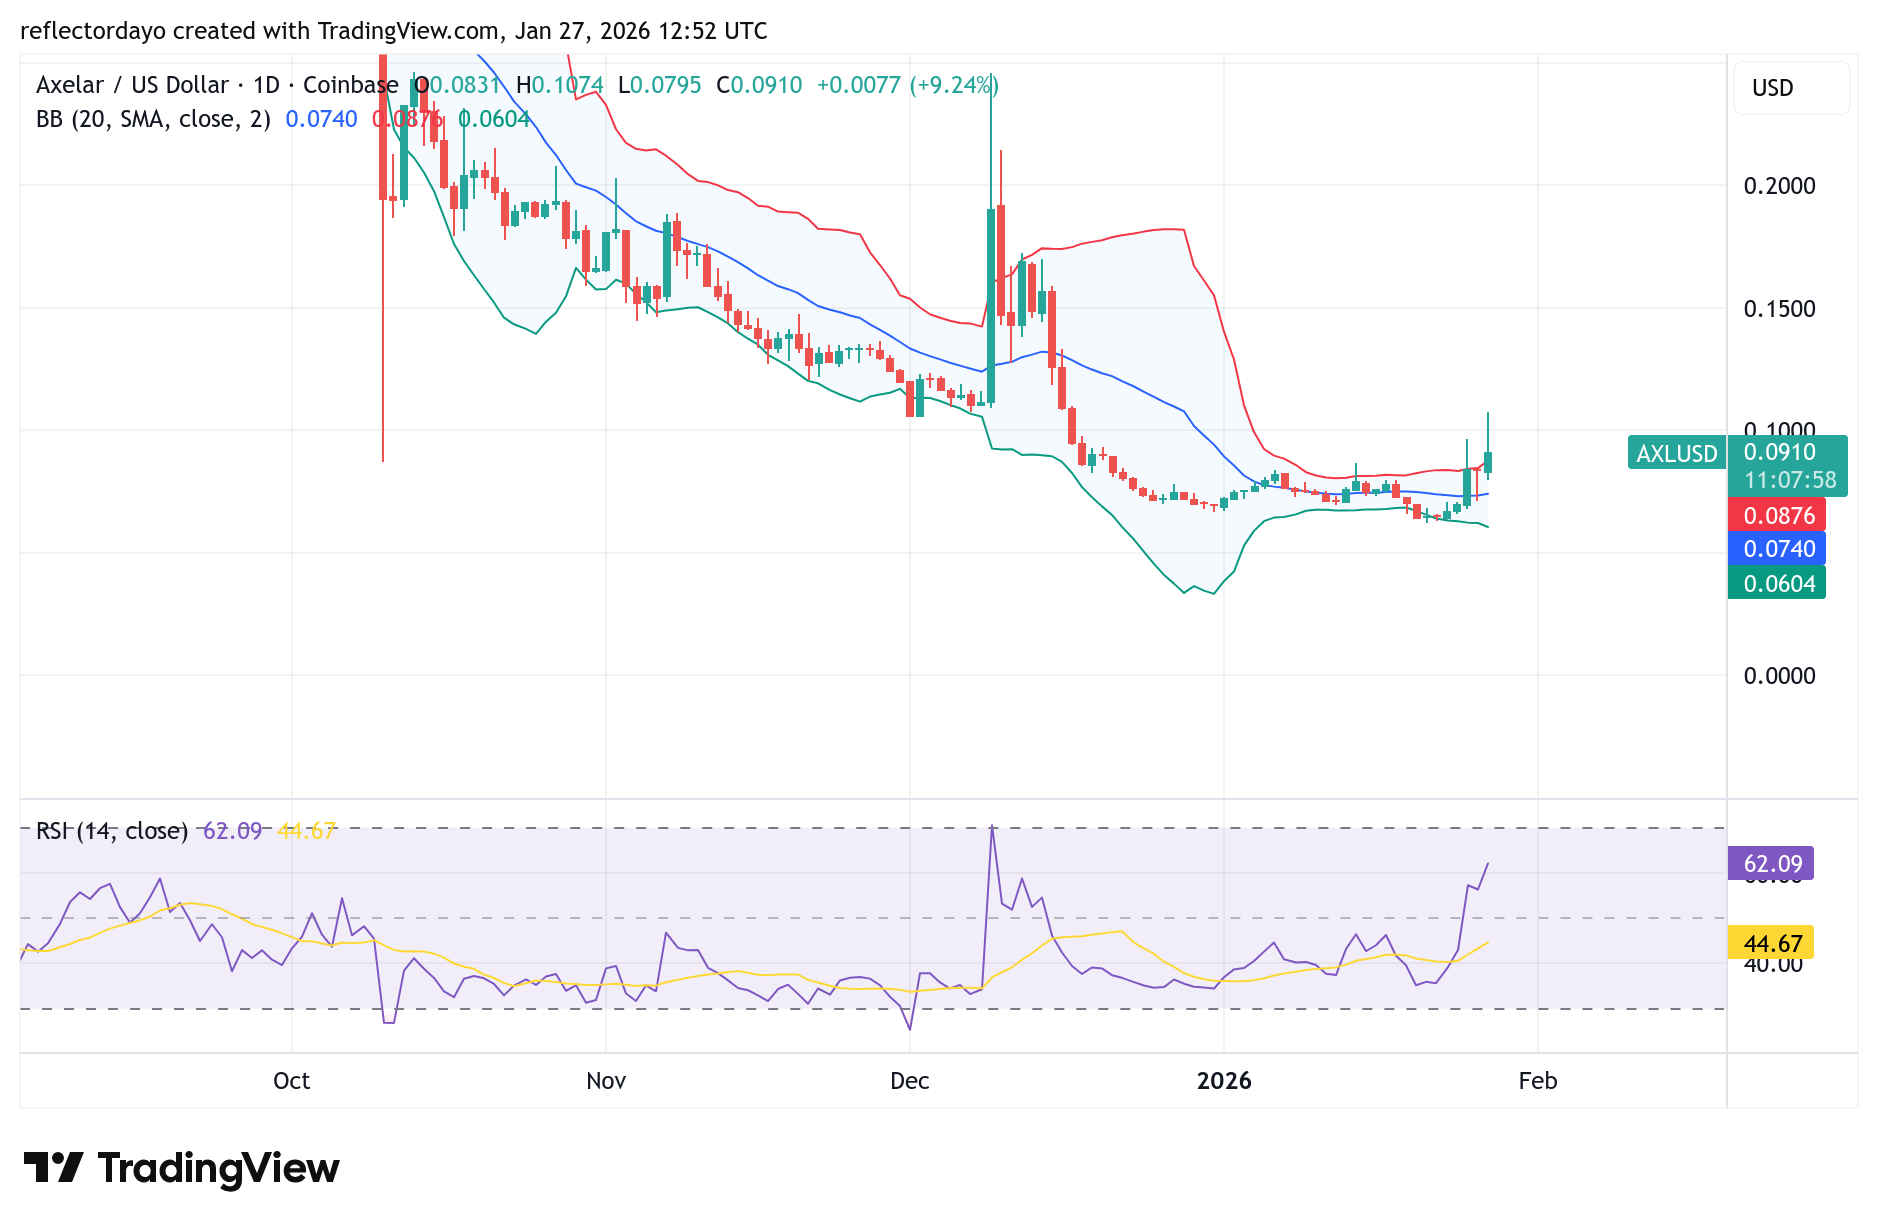
Axelar has been consolidating around the $0.0739 price level, which has also aligned closely with the 20-day moving average over the past few weeks. However, in today’s trading session, price action gained strong upward momentum and broke through the resistance zone near $0.088. This breakout has caused the moving average to begin tilting upward, signaling a potential shift in trend and strengthening bullish sentiment.

Axelar (AXL/USD) Market Data

  • AXL/USD Price Now: $0.0910
  • AXL/USD Market Capitalization: $96.4 million
  • AXL/USD Circulating Supply: 1.1 billion
  • AXL/USD Total Supply: 1.2 billion
  • AXL/USD CoinMarketCap Ranking: #273

Axelar (AXL) “Going to the Moon” as Bullish Momentum Accelerates

Axelar (AXL) has emerged as one of the standout performers in the altcoin market, posting a strong rally of around 25% within a single trading session and pushing price toward the $0.093 level. This sharp move reflects a clear shift in short-term market sentiment, with buying pressure beginning to outweigh selling activity as traders show greater willingness to buy into strength rather than wait for pullbacks. Rising trading volume has played a key role in supporting the advance, suggesting broader market participation and stronger conviction behind the move. Going forward, how AXL behaves around the $0.093 area will be critical—sustained consolidation or support above this level could signal that buyers are defending the breakout, potentially laying the groundwork for further upside. While some profit-taking is expected after such a rapid surge, the ability of bulls to absorb pullbacks near recent highs will offer important clues about the durability of the current momentum.

Key Levels to Monitor

  • Resistance: $0.10, $0.11, $0.12
  • Support: $0.075, $0.070, $0.065

Axelar (AXL/USD) Pushes Through Resistance; Coin Going to the Moon?

Axelar Market Analysis: Technical Viewpoint

The bullish market has pushed decisively through resistance, with the breakout above the $0.088 level attracting increased buying interest. At the same time, bearish sentiment is also emerging, as sellers begin to focus on the psychologically significant $0.10 price level. This clash between demand and supply has led to heightened market volatility, reflected in the widening of the Bollinger Bands.

Axelar Breakout Gains Traction as Market Absorbs Supply Pressure

Axelar ($AXL) has posted a fresh breakout, supported by rising retail interest tied to growing discussion around its expanding cross-chain role, including connectivity with the XRP Ledger (XRPL). Price action has reclaimed key short-term moving averages, while the RSI remains comfortably below overbought levels, suggesting room for further upside. Notably, the market appears to have absorbed the recent Upbit-related supply revision, helping stabilize momentum despite lingering weakness on higher timeframes.

Axelar Market Analysis: Technical Viewpoint (Continued)

If Axelar manages to break and sustain price action above the $0.10 level, a strong continuation to the upside could unfold. However, failure to hold above this area may result in consolidation around the critical $0.10 zone.

Axelar (AXL/USD) Pushes Through Resistance; Coin Going to the Moon?

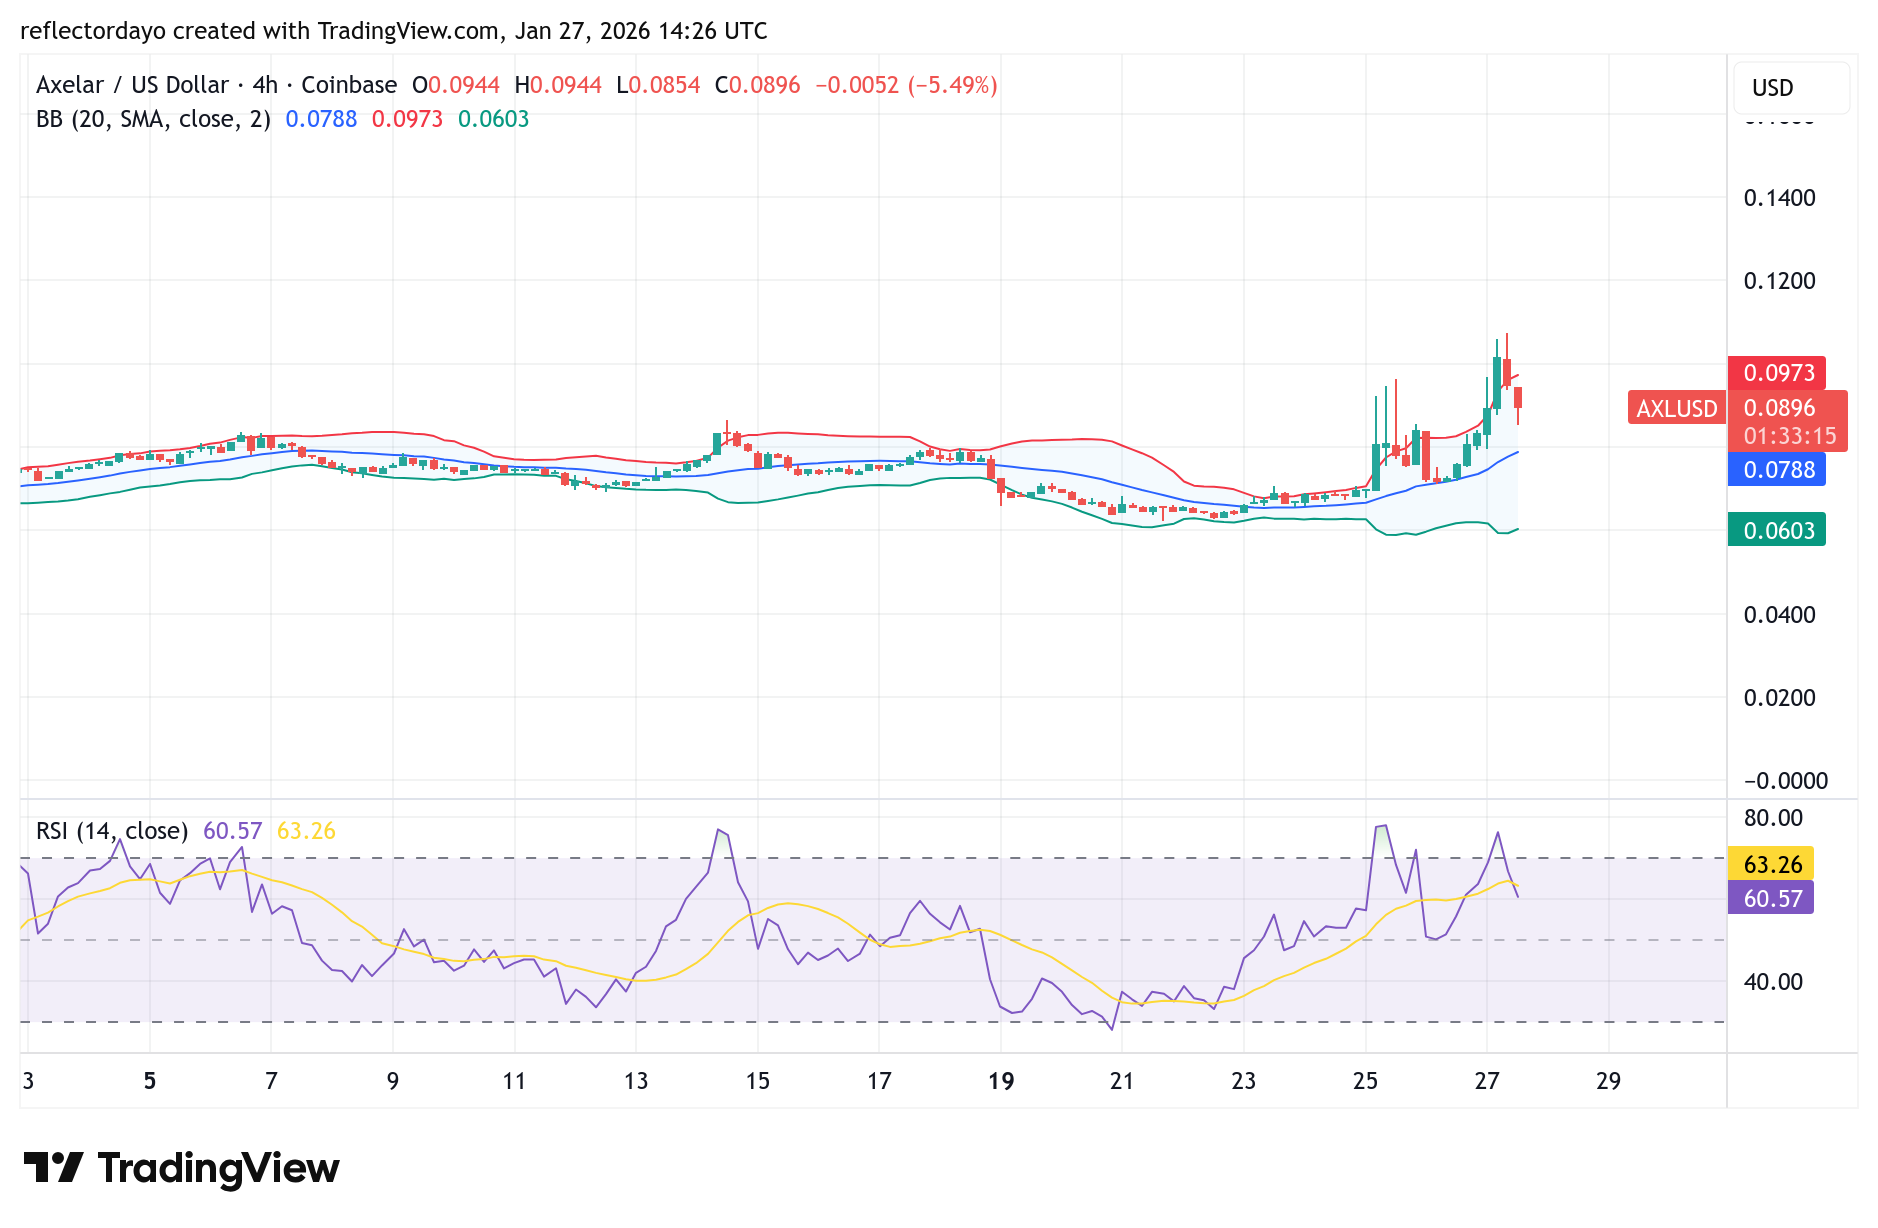
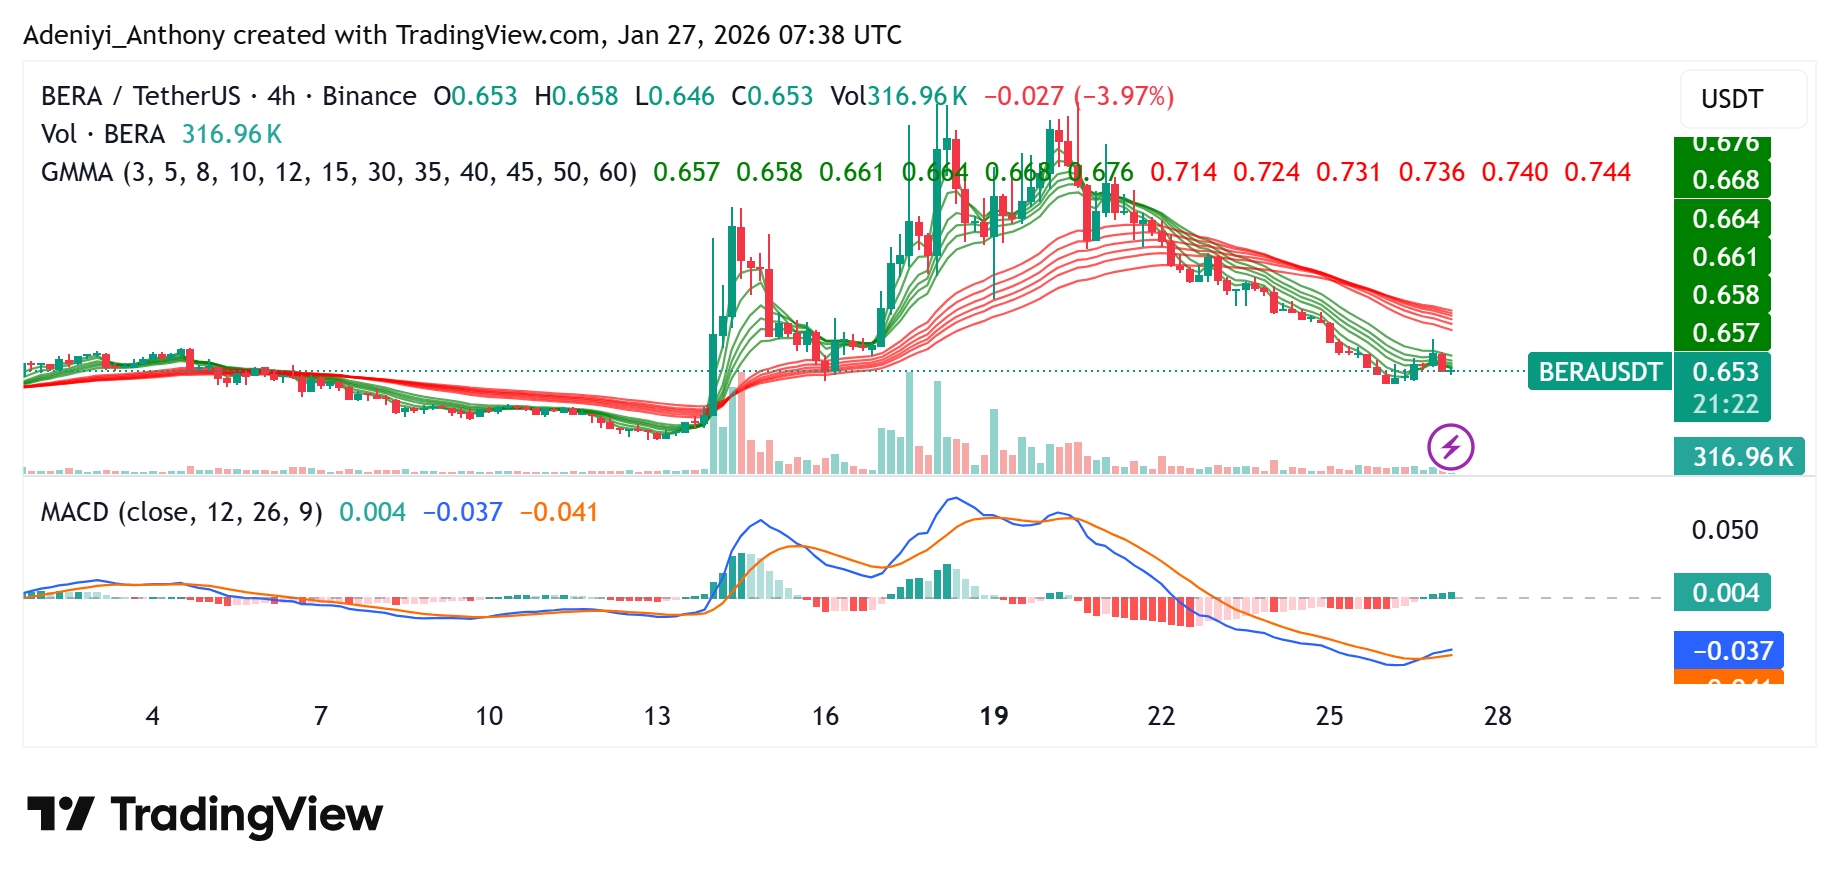
AXL/USD 4-Hour Chart Outlook

From the perspective of the 4-hour chart, recent trading sessions show that bullish attempts to break above the $0.10 price level have been repeatedly rejected, indicating the presence of strong selling pressure in this area. Despite these setbacks, the crypto signal has continued to edge closer to this resistance, suggesting that buyers are still attempting to capture the level. However, the most recent advance was again turned back. For a successful breakout to materialize, the market needs to establish a nearby support base from which bulls can regroup and renew their push higher. Failure to do so could weaken momentum and delay any potential breakout.

Trade crypto coins on BYBIT

Oversold Condition Signal Flashes as XRP Price Targets the $2.000 Level

Over the last 24 hours, it appears that XRP has risen by 1.60%, recovering after a major partnership event between Ripple and Riyadh Bank. As it stands, this collaboration focuses on Saudi Arabia’s blockchain infrastructure, specifically enhancing cross-border payments and asset tokenization, and this price action reflects such a move as utility improves.

Technically, XRP against Tether has successfully tested support at $1.82, suggesting a triggered bullish rebound that aligned with a broader 1.16% lift in the global crypto market. Right now, the $1.88 resistance level stands as immediate resistance, and a cross above this level will make XRP capitalize on improved risk sentiment to maintain its positive 30-day growth trajectory.

Currently, XRP trades at $1.8957 with over 14 million traded volumes on the daily timeframe.

Oversold Condition Signal Flashes as XRP Price Targets the $2.000 Level
XRPUSDT – Daily Chart

Technical Indicators

Major Resistance Levels: $1.9811, $2.1310, and $2.5441

Major Support Levels: $1.8952, $1.8000, and $1.7500

Technical Analysis

Technically, the XRP price seems to be consolidating under a tightening range between the SMA 50 ($1.8952) and the SMA 20 ($1.9811). Meanwhile, the Moving Average Ribbon showed a bearish alignment, with the SMAs pointing southeast. This indicates that the prevailing trend remained cautious.

However, the Stochastic RSI on the daily timeframe was positioned at 20.41 (K) and 15.27 (D), suggesting that the token seems to be bouncing off from the oversold territory. This technical setup suggests mean reversion or a relief bounce, provided the support at the SMA 20 holds on a closing basis.

XRP Price Update Before the Next Breakout Attempt

XRP against Tether seems to be in a complicated situation, correcting as the XRP price appears to be choppy within Elliot Wave structures. While a potential micro five-wave advance is forming on the 30-minute chart, the overall trend remains a downtrend. As it stands, the key resistance level is $1.96–$1.97; staying below this keeps the bearish yellow pathway valid.

However, a break above $1.96 would signal a more complex “WXY” corrective structure rather than a simple ABC decline. Meanwhile, a true bullish breakout requires clearing the $1.96–$2.83 range. Until then, price movement is considered noise within a year-long range.

XRP/USDT Analysis: Volatility Spikes as XRP Price Consolidates Near $2.000

The 4-hour chart analysis revealed that the XRP price was hovering within the SMA 20 ($1.8952) and the 50 SMA (1.9919), finding it to give a trend. However, unlike the daily chart, the Stochastic RSI on the 4-hour timeframe showed a different story, with values at 82.31 and 84.43, indicating that the short-term momentum is dropping.

This divergence suggested that while a bounce was possible from the daily oversold conditions, a minor rejection or consolidation might occur first on the 4-hour level before a sustained move toward the SMA 50 at $1.9199 could be achieved.

To this end, the volume remains relatively stable, indicating that a decisive breakout or breakdown would likely require a fresh fundamental catalyst.

Oversold Condition Signal Flashes as XRP Price Targets the $2.000 Level
XRPUSDT – 4H Chart


You can purchase crypto coins here. Buy Crypto

Litecoin (LTC) Price Prediction: LTC/USDT Trades Below $70

Date: January 27, 2026

After price action slumped below the $70 threshold, it has failed to move past key technical levels. Let’s see how this will play out subsequently.

LTC/USDT Long-Term Trend — Bearish (Daily Chart)

Key Price Levels

Resistance: $70, $75, $80

Support: $65, $60, $55

Litecoin (LTC) Price Prediction: LTC/USDT Trades Below $70

The ongoing session in the Litecoin daily market can be seen descending back below the 9-day Exponential Moving Average (EMA) line. As such, the corresponding price candle for the current session has appeared red. Meanwhile, the lines of the Stochastic Relative Strength Index (SRSI) indicator are poised upward from the oversold region. The indicator readings currently stand at 51 and 37, respectively.

Litecoin (LTC) Price Prediction: LTC/USDT Gets Resisted at the 9-Day EMA

The Litecoin market has been under strong headwinds for some time now. Price action has remained below the 9-day EMA curve for weeks as it slides to lower levels. More recently, price candles have stayed below the $70 threshold in a consolidation phase.

Although the market rebounded upward in the previous session, the ongoing session has failed to sustain that momentum. However, the SRSI indicator lines are still projected upward from the oversold region due to the prior session’s movement. Nevertheless, the market still appears capped below critical levels.

Litecoin (LTC) Price Prediction: LTC/USDT Sees a Weak Upward Rebound

On the 4-hour price chart, price action has risen above the 9-day EMA curve. The corresponding price candle for the latest 4-hour session is green and sits above the upward-tilted 9-day EMA.

Litecoin (LTC) Price Prediction: LTC/USDT Trades Below $70

Meanwhile, the lines of the SRSI indicator are hovering just above the 80 mark. The SRSI has delivered a crossover, though the lines are still in the early stages of emerging. Therefore, traders may watch for a bounce here, as it could signal a continued upward retracement toward the $75 level.

Get Litecoin (LTC) here. Buy LTC 

Berachain price Eyes Recovery Amid Strategic Infrastructure Expansion

Berachain against Tether in recent times has seen a modest 1.05% increase, nearly keeping pace with the broader market. As it stands, this recovery seems to be following a sharp 35% decline, with the Berachain price leaving the oversold territory with a weekly RSI of 40.1. From the fundamental side, it appears that the catalyst behind these changes remains investors’ optimism regarding the Bera Builds Businesses strategic pivot, which focuses on a sustainable revenue-generating model.

Right now, the immediate outlook hinges on a potential short squeeze. This technical setup, combined with the fundamental shift in its business model, suggests BERA is primed for a volatile rebound even as $96.2 million in open interest is clustered near the $1.05 resistance level.

Currently, Berachain trades at $0.653 with over 1.19 million traded volumes on the daily chart.

Berachain price Eyes Recovery Amid Strategic Infrastructure Expansion
BERAUSDT- Daily Chart

Technical Indicators

Major Resistance Levels: $0.740, $0.850, and $1.020

Major Support Levels: $0.600, $0.540, and $0.500

Technical Analysis

Technical indicators on the daily timeframe suggest that the Berachain price is currently in a consolidation phase. Its operation is obviously below the cluster of the Guppy Multiple Moving Averages (GMMA). Furthermore, the current position seems not to be dictating as the token gears towards the next resistance level with decreasing pressure.

However, a reducing bullish momentum seems to be spotted on the MACD histogram, suggesting that the downward momentum is just starting. To this end, as long as the price maintains its position above the $0.60 support, the probability of a test toward the $0.85 resistance remains high.

Meanwhile, @0xBlesd has suggested that investors may have to look beyond superficial noise and the false narrative. The analyst opined that Berachain ($BERA) is currently undervalued, and once the chart becomes clearer, the Berachain price action will become obvious.

Ultimately, the post predicts that price action will drive a total rebranding of Berachain within the crypto community rather than its current reputation, suggesting the platform is positioned to become the primary destination for significant financial gains and market leadership.

BERA/USDT Analysis: Berachain Price Pattern Hints at Local Breakout

On the 4-hour chart, it appears that BERA/USDT is currently breaking out of a falling wedge pattern. Additionally, the Berachain price was seen again testing the short-period Exponential Moving Average (EMA). A sustained close above these EMAs on the 4-hour candle could provide the necessary fuel to push the pair toward the immediate local target.

Meanwhile, the 4-hour MACD suggests that a bullish divergence is forming, and an increase in momentum would confirm a shift in momentum toward the $0.740 resistance level.

Berachain price Eyes Recovery Amid Strategic Infrastructure Expansion
BERAUSDT – 4H Chart


You can purchase crypto coins here. Buy Crypto

Algorand (ALGO/USD) May Be Preparing for an Upward Break

On December 18, Algorand broke out of its downward price movement around the $0.104 level. A strong support zone emerged in this area and has remained intact since then. However, a nearby resistance also formed around the $0.12 level, giving the impression that the market might consolidate at lower levels for some time.

As the new year began, market volatility picked up and bullish sentiment strengthened further. As a result, the resistance shifted higher to around the $0.14 price level, pointing to a growing upside bias.

Algorand (ALGO/USD) Market Data

  • ALGO/USD Price Now: $0.1238
  • ALGO/USD Market Capitalization: $67.8 million
  • ALGO/USD Circulating Supply: 8.86 billion ALGO
  • ALGO/USD Total Supply: 10 billion ALGO
  • ALGO/USD CoinMarketCap Ranking: #61

Algorand Price Outlook: Accumulation Phase Signals Potential Major Upside

This video breaks down Algorand’s current market structure, emphasizing that while price action may appear slow, the ongoing consolidation could be a key accumulation phase. Using Elliott Wave analysis, it explains a prolonged Wave 2 range and outlines a potential Wave 3 move with significant upside, supported by bullish shifts in Market Cipher B money flow, VWAP flipping bullish, and emerging divergences across multiple timeframes. Although short-term risks such as RSI bearish divergence remain, stronger bullish signals are developing on higher timeframes, reinforcing long-term conviction. The analysis also highlights Fibonacci-based targets, broader macro accumulation conditions, and limited retail participation—factors that often precede explosive moves. Overall, the video presents a cautiously optimistic outlook for ALGO, positioning the current market phase as a strategic opportunity for long-term accumulation rather than short-term speculation.

Key Levels to Monitor

  • Resistance: $0.14, $0.15, $0.16
  • Support: $0.10, $0.09, $0.08

Algorand (ALGO/USD) May Be Preparing for an Upward Break

Algorand Market Analysis: Technical Viewpoint

Signs of a potential upward break become clearer when examining the chart through price action analysis. A closer look at the structure of recent price movements reveals subtle shifts in the lows, forming slightly ascending lows. Although modest, this pattern suggests a growing possibility of a breakout above the $0.14 price level.

The nearest resistance at $0.12 has been breached in today’s session, with price action attempting to sustain above this level. Despite some profit-taking pressure that pushed the price to a high of $0.1268, the Algorand market has since stabilized around $0.1238, indicating continued bullish interest.

Algorand (ALGO/USD) May Be Preparing for an Upward Break

ALGOUSD 4-Hour Chart Outlook

As price action surges above the $0.12 level, it reflects an increase in market volatility. This heightened volatility may make it challenging for bulls to firmly maintain control around the $0.12 price area. However, for now, the market is sustaining above this critical level. If this holds, it could set the market on course for further upside price action, increasing the likelihood that a breakout toward the $0.14 price level may eventually materialize.

Trade crypto coins on BYBIT

TRXUSD Slides to $0.2930 Market Level as Sellers Tighten Control

TRXUSD Price Analysis – January 26, 2026

TRON (TRXUSD) is trading around $0.2930 market level, extending its decline after losing the critical $0.2976 pivot. Price action is now pressing into a near-term support zone, with momentum fading and distribution signals pointing to sustained selling pressure.

Daily Key Zones

Resistance Zones: $0.3080, $0.3220
Support Zones: $0.2800, $0.2690

TRXUSD Slides to $0.2930 Market Level as Sellers Tighten Control

TRXUSD Long-Term Trend – Bearish (Daily Chart)

On the daily timeframe, TRXUSD has clearly shifted into a bearish posture after failing to maintain acceptance above $0.2970 key zone. The breakdown has invalidated the prior consolidation range, with price now printing lower highs and weaker recovery attempts.

What is the market Outlook for TRXUSD?

The Momentum reading remains negative, signaling loss of upside drive, while the Accumulation/Distribution line continues to trend lower. This combination suggests capital is rotating out of TRX rather than accumulating at these levels.

If sellers maintain pressure, the next downside objective sits at $0.2800 market level, followed by the deeper structural support near $0.2694. Any meaningful bullish recovery would require a daily close back above $0.3080, which currently acts as the first major resistance and trend invalidation level.

Until price reclaims key resistance with volume and conviction, rallies are likely to be corrective rather than trend-reversing. Traders should remain cautious, allowing price action and confirmation to guide positioning rather than anticipation.

TRXUSD Slides to $0.2930 Market Level as Sellers Tighten Control

TRXUSD Short-Term Trend – Bearish (4-Hour Chart)

On the 4-hour chart, bearish control is more pronounced. Price continues to stall below prior support, now acting as resistance. This reflects repeated rejection attempts and limited buyer follow-through.

Short-term momentum remains negative, and Accumulation/Distribution data shows sellers dominating intraday flows. Liquidity is clustering around the $0.2920–$0.2950 region, making this zone critical for short-term direction.


TRON Market Statistics

Current Price: $0.2900
Market Capitalization: $26,000,000,000
24H Trading Volume: $600,000,000

You can purchase TRON here. Buy TRX

Compound (COMP/USD) Shows Downtrend Exhaustion

COMP/USD Price Analysis: COMP/USD Bearish Trend Loses Momentum

COMP/USD indicates that bearish pressure is weakening. Sellers previously pushed the market down by 48.99% following a bearish breakout in October., The market is gradually transitioning into a ranging phase around the $24.30 level. This development may signal a potential trend reversal in favor of the bulls, or alternatively, an extended consolidation phase.

COMP/USD Key Levels

Resistance Levels: $38.61, $60.26
Support Levels: $24.30, $24.10

Compound (COMP/USD) Shows Downtrend Exhaustion

On the daily timeframe, a symmetric wedge pattern formed and eventually broke to the downside. It led to a retest occurring on 13 September, confirming the prevailing downtrend. Price then completed a short bearish move of 48.99% before entering consolidation around the $24.30 level.

A clear confluence between the trendline and horizontal support at this level has limited further downside, as evidenced by repeated price bounce within this zone.

On the 4-hour timeframe, the 9-period moving average crossing above and below the 21-period moving average between 17 December and 22 January further confirms the ranging market structure observed on the daily timeframe.

Compound (COMP/USD) Shows Downtrend Exhaustion

Market Expectation

The sole strong momentum candle formed on 11 October was quickly rejected by bullish pressure. All of a sudden, Bears regained control of the market. On the 4-hour timeframe, the Relative Strength Index (RSI) enters oversold territory as price approaches the $24.30 support level, suggesting a potential shift in market.

You can purchase Lucky Block here.  Buy LBLOCK

Note: Cryptosignals.org is not a financial advisor. Do your research before investing your funds in any financial asset or presented product or event. We are not responsible for your investing result.

XLMUSD Fails to Reclaim Key Pivot as Price Compresses Below Resistance

XLMUSD Price Prediction — January 23

Stellar Lumens (XLMUSD) is trading around the $0.210 region after failing to break back above the $0.22 pivot. Recent price action shows the market compressing just below resistance, with momentum diverging across timeframes. Buyers have not shown enough follow-through to reclaim higher ground, and sellers remain in control of short-term structure. This suggests the market is still in a neutral-to-bearish consolidation, with volatility compressing before the next directional resolution.

XLMUSD Market Key Levels

Resistance levels: $0.220, $0.260
Support levels: $0.200, $0.190

XLMUSD Fails to Reclaim Key Pivot as Price Compresses Below Resistance

XLMUSD Long-Term Trend — Neutral (Daily Chart)

On the daily chart, XLMUSD remains within a broad range after being rejected from the $0.260 resistance zone. Price continues to hover near the lower portion of the range, indicating that upside momentum is weak and sellers are still exerting control whenever rallies attempt to build.

What is the market outlook for XLMUSD?

The Chande Momentum Oscillator is mildly positive, suggesting some short-term bounce potential, but the MACD histogram remains negative and the MACD line trades below its signal line. This combination reflects mixed signals meaning there is some short-term demand, but overall momentum is still tilted toward sellers.

The market is in a compression phase rather than trending decisively. XLMUSD is currently boxed between $0.190 support and $0.220 resistance, creating a clear equilibrium range. As long as price remains below $0.220, the short-term bias favors sideways behavior or continuation lower.

A daily breakout above $0.220 price level with conviction would signal improving buying pressure and could open the door toward $0.260 and then $0.350 if trend continuation builds. Conversely, a breakdown below $0.190 price level would confirm bearish continuation and increase the likelihood of lower re-tests toward the $0.180 zone or deeper.

XLMUSD Fails to Reclaim Key Pivot as Price Compresses Below Resistance

XLMUSD Short-Term Trend — Bearish (4-Hour Chart)

On the 4-hour chart, XLMUSD is showing clear signs of intraday weakness. Price action is printing shallow bodies and lower highs near the current pivot, reflecting a lack of bullish follow-through. The Chande Momentum Oscillator is in negative territory. It reaffirms short-term bearish pressure, while the MACD histogram remains negative despite a shallow bullish crossover attempt. This indicates that any upside moves lack strength.

Stellar Market Statistics

Current Price: $0.210
Market Capitalization: $5.80B
24H Trading Volume: $150.00M

You can purchase Stellar here. Buy XLM

BNB Price Faces Challenges as Bears Move to Stop Uptrend

In the last 24 hours, the BNB price dipped to $871, marking a 5.7% weekly decline. As it stands, the fears of a U.S. shutdown have triggered a broad crypto sell-off, leaving BNB price struggles alongside other crypto assets.

Technically, BNB is showing significant weakness and is operating below key moving averages, with the 7-day Relative Strength Index (RSI) standing below 20. Though this market position often precedes a bounce. Still, the market is gripped by extreme fear, even as some accumulation is noticed against further falls.

Currently, BNB trades at $871.42 with over 44.5k traded volumes at the beginning of the week.

BNB Price Faces Challenges as Bears Move to Stop Uptrend
BNBUSDT – Weekly Chart

Technical Indicators

Major Resistance Levels: $925.97, $1,000.00, and $1,150.00

Major Support Levels: $850.00, $802.90, and $701.61

BNB Price Stalled; Could Grayscale’s ETF Filling Be the $1,000 Catalyst?

In a post by @pepeisfriend on X, it was highlighted that the BNB price is consolidating near the $890 mark, maintaining a stable appearance despite underlying market activities. It was mentioned in the post that price action remains sideways, with the ecosystem experiencing significant internal momentum, which could push the price from its recent quiet phase.

Additionally, the analyst hopes to see a positive change as Grayscale files for a spot BNB ETF. The analyst is of the opinion that if the move is approved, the BNB price could assume its usual top position again.

Technical Analysis

On the weekly chart, BNB against Tether is trading above its core moving averages. BNB against Tether appears to be extending upwards towards $972 despite a recent dip. However, it appears that the bears are already in the way of such progress, though the bullish structure is still intact, but it looks like $802.90 beckons. Meanwhile, activities on the Stochastic RSI show that momentum seems to be rising again, but the direction of the lines is not clear as the BNB price consolidates further.

To this end, the volume profile appears too low for an upward move as the price approached the $925.97 resistance. Meanwhile, the 20-week and 50-week moving averages are currently sloping upwards. However, the widening gap between the price and these averages suggests a potential mean reversion move could be on the horizon.

BNB/USDT Analysis: Stochastic RSI Reaches Oversold Extreme

On the daily timeframe, the BNB price appears to be operating below the cluster of the simple moving averages, testing the $871-$890 price range. However, the momentum oscillator suggests BNB/USDT is deeply oversold at 4.30. In technical terms, this often signals that selling momentum is reaching an exhaustion point.

To this end, while price remains pinned against the $871.38. If the daily candle fails to close above this mark, the technical outlook suggests a deeper slide toward $802.90. Conversely, a successful defense of this level, could lead to a retest of the $925.97 resistance.

BNB Price Faces Challenges as Bears Move to Stop Uptrend
BNBUSDT – Daily Chart


You can purchase crypto coins here. Buy Crypto