Chainlink Attempts the $8.32 High as It Regains Bullish Vigor
Estimated Reading Time: 2 minutes
Don’t invest unless you’re prepared to lose all the money you invest. This is a high-risk investment and you are unlikely to be protected if something goes wrong. Take 2 minutes to learn more
Chainlink (LINK) Long-Term Analysis: Bullish
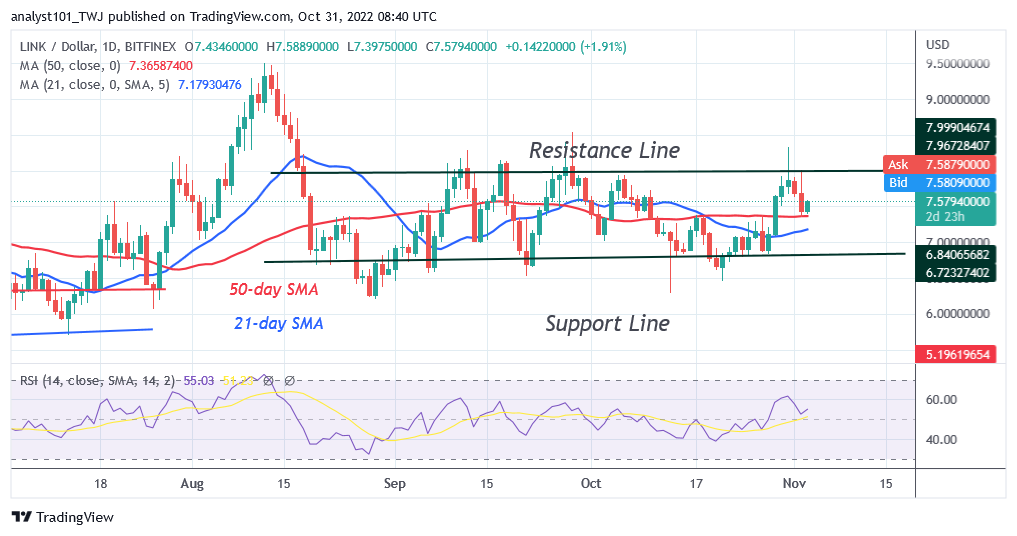
Chainlink (LINK) is in an upward correction as it regains bullish vigor. Although they were halted around the $8.32 barrier, buyers managed to keep the price above the moving average lines. The alternative currency has moved back above the moving average lines. To resume an uptrend, LINK has regained a bullish impetus today. On the upside, the coin will break over the $8.00 high if it recovers above the moving average lines. The bullish trend will continue and test the $9.50 high once more. In contrast, Chainlink will maintain its range-bound movement between levels $6.60 and $8.00 if the LINK price is unable to break the $8 high.
Chainlink (LINK) Indicator Analysis
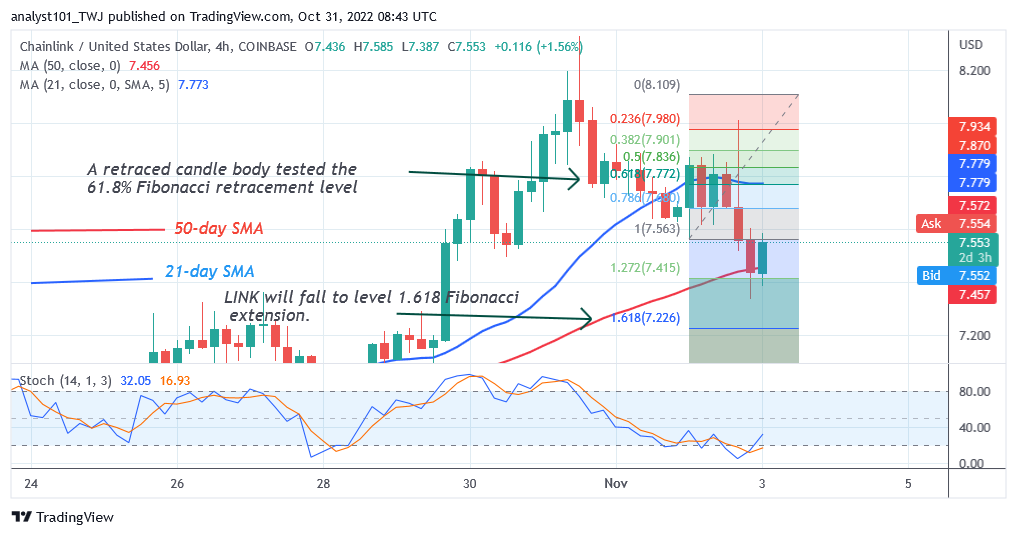
For period 14, Chainlink is at level 55 of the Relative Strength Index. It may climb as it is trading in the bullish area. The daily stochastic 25% region is above LINK. It is moving in a bullish direction and might go back to the $8 high. LINK prices are rising as price bars are above moving average lines. The horizontal flatness of the moving average lines.
Technical indicators:
Major Resistance Levels – $18.00, $20.00, $22.00
Major Support Levels – $8.00, $6.00, $4.00
What Is the Next Direction for Chainlink (LINK)?
As it battles to stay below the $8.00 high, Chainlink regains bullish vigor. If Chainlink overcomes the resistance at level $8.00, the positive trend will resume. The oversold resistance will be reached by the market at $9.50.
You can purchase crypto coins here. Buy LBLOCK
Note: Cryptosignals.org is not a financial advisor. Do your research before investing your funds in any financial asset or presented product or event. We are not responsible for your investing results