BANDUSD Continues to Break Price Levels
Estimated Reading Time: 3 minutes
Don’t invest unless you’re prepared to lose all the money you invest. This is a high-risk investment and you are unlikely to be protected if something goes wrong. Take 2 minutes to learn more
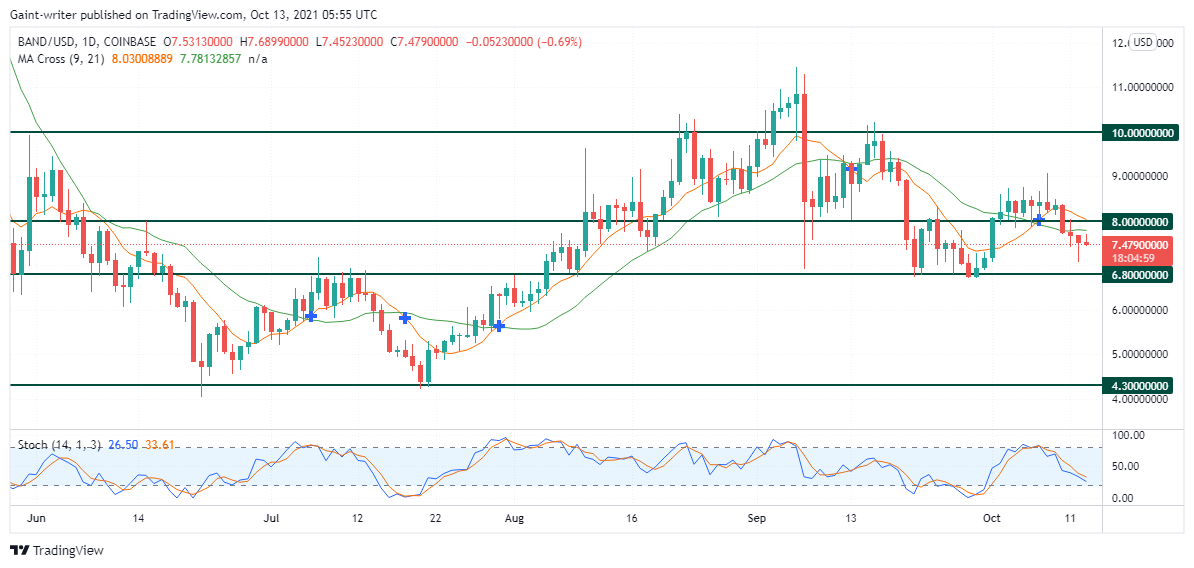
BANDUSD Analysis – Price Continues to Break Lower Below $8.000
BANDUSD continues to break significant price levels in a bearish trend. The market keeps pushing prices lower, creating short-term lows. However, as the bears push the price lower, the buyers also try to add little pressure to the market, creating a pullback or retest. After a bearish ride from $10.000 significant price level to $6.800 significant price level, the buyers also held their position by pushing the price above $8.00.
Significant Key Levels:
Resistance Levels: $10.000, $8.000
Support Levels: $6.800, $4.300
Price action is seen above the $8.000 significant price level, the candlesticks consisting of wicks. This indicates that there is a bullish rejection as the price failed to move higher than that. The bears then take control of the situation, thereby bringing prices downward. This is due to the seller’s momentum in the market. The market is, however, expected to fall, breaking through the $6.800 significant price level and beyond.
The market was first considered to be in a bullish trend because of its advance from the $4.300 significant price level to the $10.000 significant price level. The bears are likewise motivated to return the price to $4.300, breaking through prior price levels. The MA (Moving Average) crossover is above the price activity on the daily chart, and the price is reacting to it. As the market remains in a downtrend, the price will fall.

Market Predictions
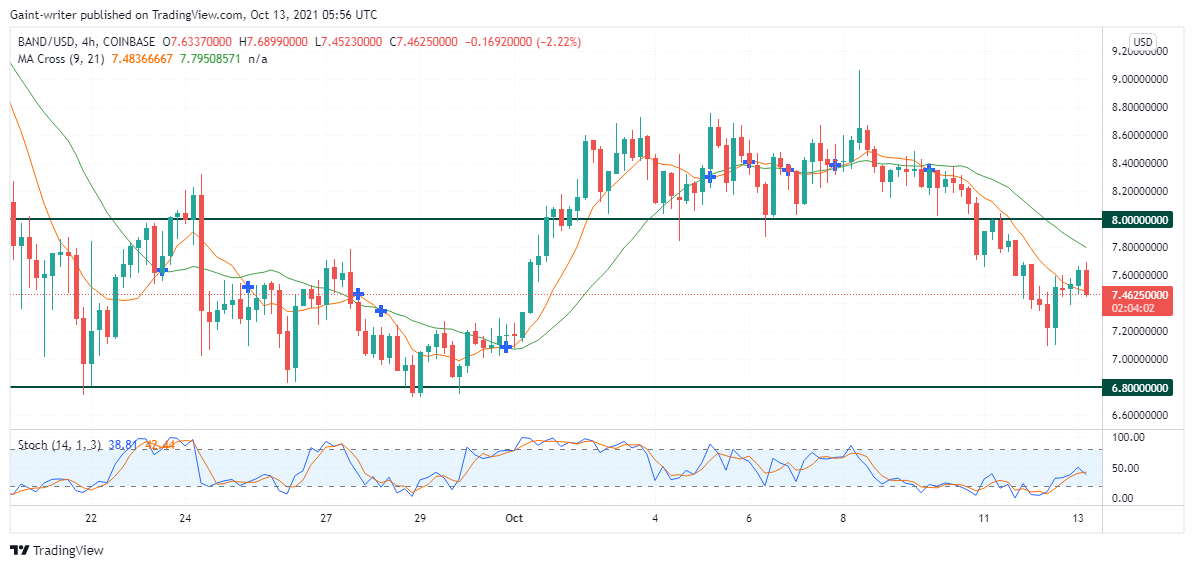
On the 4hour chart, BANDUSD was first in consolidation. After long-ranging in this zone, the price finally breaks through. The market then continues to accumulate above the $8.000 significant price level before breaking downward. The Stochastic Oscillator shows price movement dropping as the market continues to trend downward. The Moving Average is also following a downtrend. The market, therefore, is expected to break below significant price levels as they trend lower.
You can purchase crypto coins here: Buy Tokens
Note: Cryptosignals.org is not a financial advisor. Do your research before investing your funds in any financial asset or presented product or event. We are not responsible for your investing results.