Chainlink (LINK) Fluctuates Above $18.50 Support, Unable to Breach $24 High
Estimated Reading Time: 3 minutes
Don’t invest unless you’re prepared to lose all the money you invest. This is a high-risk investment and you are unlikely to be protected if something goes wrong. Take 2 minutes to learn more
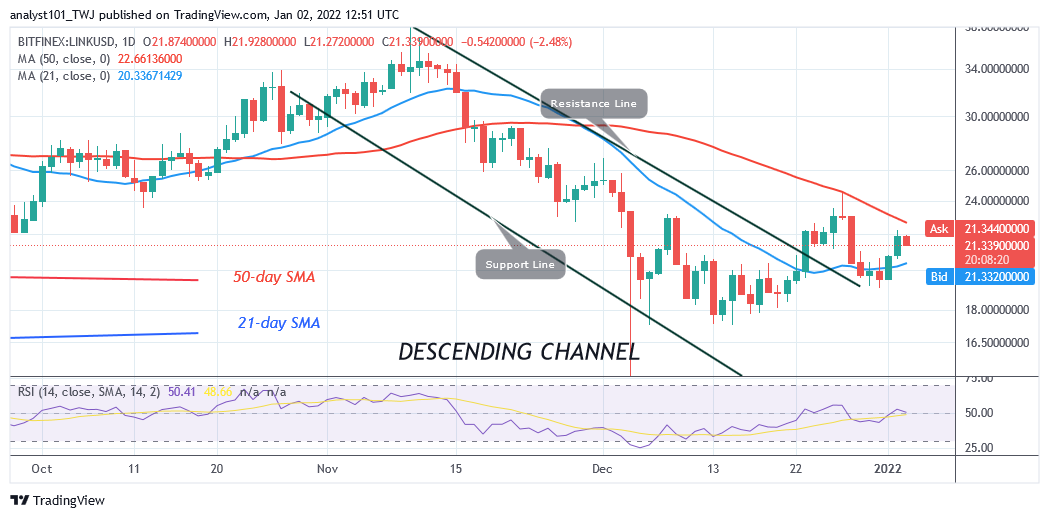
Chainlink (LINK) Long-Term Analysis: Bearish
Chainlink’s (LINK) price is in a downward correction but unable to breach $24 high . The selling pressure has reached bearish exhaustion. On December 27 uptrend; buyers broke above the 21-day line SMA but fail to break the 50-day line SMA twice. Consequently, Chainlink is falling to the downside. On the upside, if the bulls break above the 50-day line SMA, the altcoin will resume up trending. The cryptocurrency will be out of downward correction. However, if the bulls fail to break above the 50-day line SMA or the $27 resistance, the downward correction will continue. Chainlink is trading at $21 at press time.
Chainlink (LINK) Indicator Analysis
Presently, the Chainlink price is above the 21-day line SMA but below the 50-day line SMA. This implies that the altcoin will be compelled to a range-bound move between moving averages. LINK price is at level 50 of the Relative Strength Index period 14. It indicates that there is a balance between supply and demand. The 21-day SMA and the 50-day SMA are sloping downward indicating the downtrend. The altcoin is below the 50% range of the daily stochastic. It indicates that the market is in a bearish momentum.
Technical indicators:
Major Resistance Levels – $40.00, $42.00, $44.00
Major Support Levels – $26.00, $24.00, $22.00
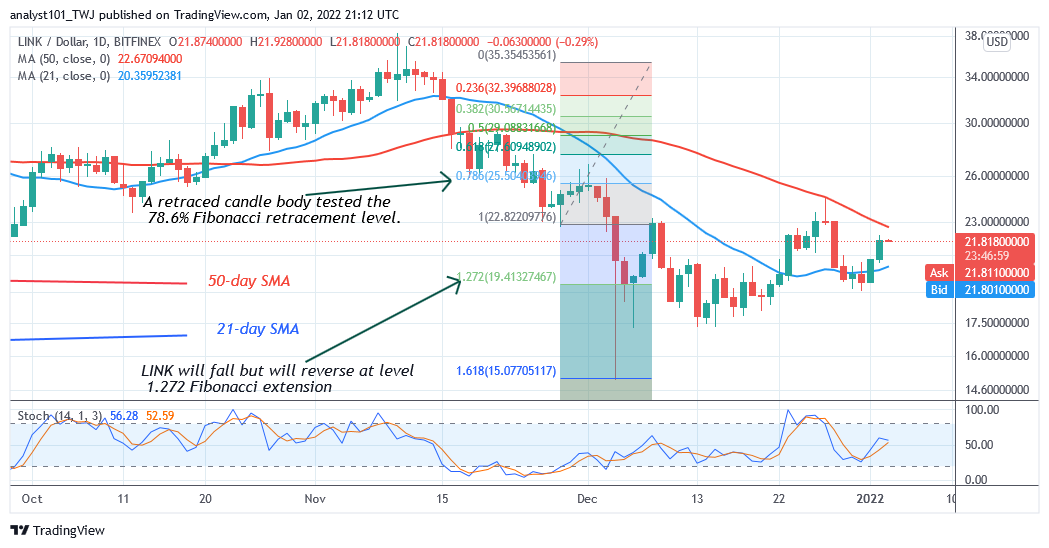
What Is the Next Direction for Chainlink (LINK)?
Chainlink price is recovering from the earlier downtrend but unable to breach $24 high. The cryptocurrency consolidated abovethe $17 support to resume an uptrend. The uptrend is facing rejection at the $24 high. Meanwhile, on November 28 downtrend, a retraced candle tested the 78.6% Fibonacci retracement level. It indicates that LINK will fall to level 1.272 Fibonacci extension or level $19.41.
You can purchase crypto coins here. Buy Token
Note: Cryptosignals.org is not a financial advisor. Do your research before investing your funds in any financial asset or presented product or event. We are not responsible for your investing results