Crypto Liquidity Dries Up as Spot Volume Hits 2023 Levels
Estimated Reading Time: 4 minutes
Don’t invest unless you’re prepared to lose all the money you invest. This is a high-risk investment and you are unlikely to be protected if something goes wrong. Take 2 minutes to learn more

KEY TAKEAWAYS:
- Crypto spot volume is down 67%, back to 2023 levels.
- Thin liquidity can amplify price swings up or down.
- Similar conditions previously preceded major market recoveries.
The chart that should concern every crypto participant right now is not a price chart. It is a volume chart — and what it is showing is a liquidity environment that has quietly deteriorated to levels not seen since the pre-bull market conditions of 2023.
CryptoQuant data tracking total spot trading volume across all major exchanges shows a 67% collapse from the $2.0 trillion monthly peak recorded in October 2025 to approximately $0.7 trillion in the most recent monthly reading. When liquidity drains this fast and this far, price movements in either direction become structurally amplified — and the risk of disorderly moves, both down and up, rises significantly.
What the Volume Chart Is Actually Showing
The CryptoQuant total spot trading volume chart covering January 2024 through early 2026 tells a story of a market that peaked with extraordinary force and has since exhausted itself methodically. The cycle high of $2.6 trillion in January 2025 represented the full frenzy of the Bitcoin all-time high period — every exchange, every retail participant, and every institutional desk simultaneously active in the same market.
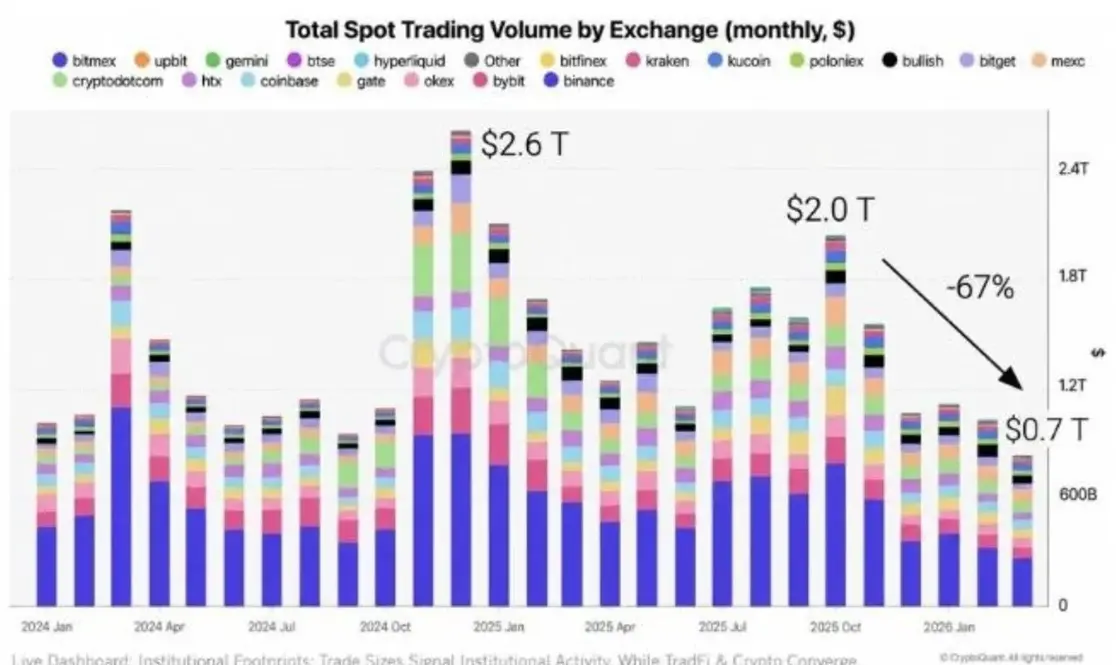
Binance dominated the stack throughout, with Bybit, OKX, Coinbase, and Hyperliquid contributing meaningfully to the aggregate. The subsequent contraction was gradual through mid-2025, then accelerated sharply. By the time volume reached the $2.0 trillion level in October 2025, the 67% decline arrow was already drawing itself. The current $0.7 trillion monthly reading puts aggregate spot volume back at the baseline range that characterised the accumulation phase of 2023 — before the ETF approval, before the all-time high, before the institutional narrative took hold.
“Low volume markets do not just fall harder — they also recover faster. Thin liquidity is the condition that makes both the worst and best moves possible.”
Why This Number Matters More Than Price
Volume is the market’s confession about conviction. When spot trading volume is $2.6 trillion monthly, participants across the full spectrum — retail, institutional, algorithmic — are engaged and active. When it contracts to $0.7 trillion, the market is telling you that the majority of potential participants have either exited, lost interest, or are waiting on the sidelines for a catalyst that has not yet arrived. The practical consequence is a market that becomes increasingly sensitive to relatively small flows.
Strategy’s Bitcoin purchases, BlackRock’s IBIT inflows or outflows, a single macro headline — all of these carry disproportionate price impact in a thin market that would have absorbed them without incident at $2.0 trillion monthly volume. Bitcoin’s 21.6% decline over thirty days and 15.1% weekly loss were not just sentiment events. They were the predictable output of large sell-side flows hitting a market with insufficient bid-side depth to cushion them.
The Historical Pattern at This Volume Level
The 2023 baseline — the period this volume reading now mirrors — was not a period of continued decline. It was the period that immediately preceded one of crypto’s most significant accumulation phases, culminating in the ETF approval rally and the eventual $126,000 all-time high. Volume compression of this kind has historically marked the late stage of distribution cycles rather than the early stage — the point at which sellers have largely finished and the float is gradually moving into stronger hands.
Santiment’s 2.23 to 1 bullish sentiment reading last week, Ethereum whale wallets at 9-week highs, and five altcoins recording their fastest new wallet creation in months all point toward the same conclusion the volume chart implies: participation has collapsed, but conviction among those who remain is quietly building. Thin markets punish the impatient and reward those who understand that the absence of volume is not the absence of a future. It is the condition that makes the next move, when it arrives, disproportionately large.