DeFi Coin Price Prediction: DEFC/USD Trades at $0.30 as Price Heads to the Upside
Estimated Reading Time: 2 minutes
Don’t invest unless you’re prepared to lose all the money you invest. This is a high-risk investment and you are unlikely to be protected if something goes wrong. Take 2 minutes to learn more

Free Crypto Signals Channel
 Free Telegram Channel
The DeFi Coin price prediction shows a remarkable improvement today as the coin begins a new bullish movement.
DEFC/USD Medium-term Trend: Ranging (4H Chart)
Key Levels:
Resistance levels: $0.36, $0.38, $0.40
Support levels: $0.26, $0.24, $0.22
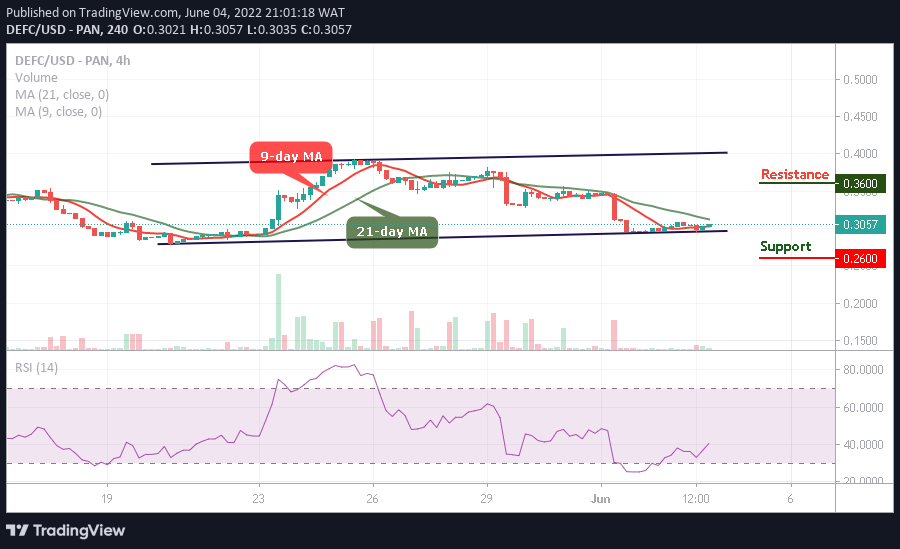
According to the 4-hour chart, DEFC/USD is moving towards an upward formation after having a bullish session a few hours ago. The DEFC price is currently above the 9-day moving average as the signal line of the technical indicator Relative Strength Index (14) moves to cross above 40-level, which indicates bullish movement.
DeFi Coin Price Prediction: DEFC Bulls Will Spike to the Upside
The DeFi Coin price is currently above the 9-day moving average as the coin prepares to cross above the 21-day moving average. However, if the coin maintains the bullish trend, the bulls would push the price towards the resistance levels of $0.36, $0.38, and $0.40. On the contrary, if DEFC/USD drops below the lower boundary of the channel, the price could touch the support levels at $0.26, $0.24, and $0.22 respectively.
DEFC/USD Medium-term Trend: Bearish (2H Chart)
DEFC/USD is trading above the 9-day and 21-day moving averages as the technical indicator Relative Strength Index (14) moves to cross above the 50-level which could increase the bullish movement. However, a possible drop below the moving averages may surface if the price head to the south, any further bearish movement may bring the coin to the critical support level of $0.28 and below.
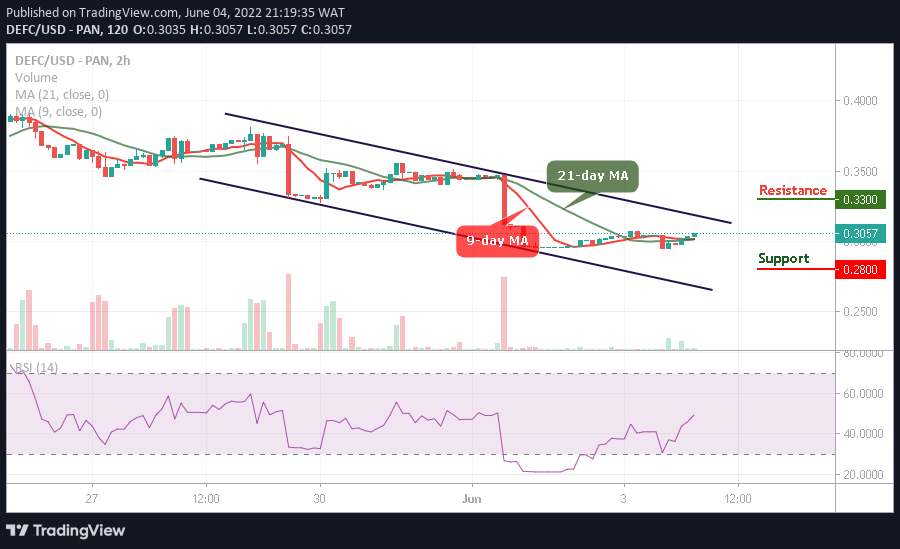
However, as the bulls push the coin higher, the DEFC price will cross above the upper boundary of the channel. Once this comes to focus, the price would hit the resistance level of $0.33 and above. More so, the trading volume is coming up slowly and will begin to climb higher as much if the technical indicator moves to the positive side.
You can purchase DeFi Coin here. Buy DEFC