DeFi Coin Price Prediction: DEFC/USD Trades Near $0.13 Level
Estimated Reading Time: 2 minutes
Don’t invest unless you’re prepared to lose all the money you invest. This is a high-risk investment and you are unlikely to be protected if something goes wrong. Take 2 minutes to learn more

Free Crypto Signals Channel
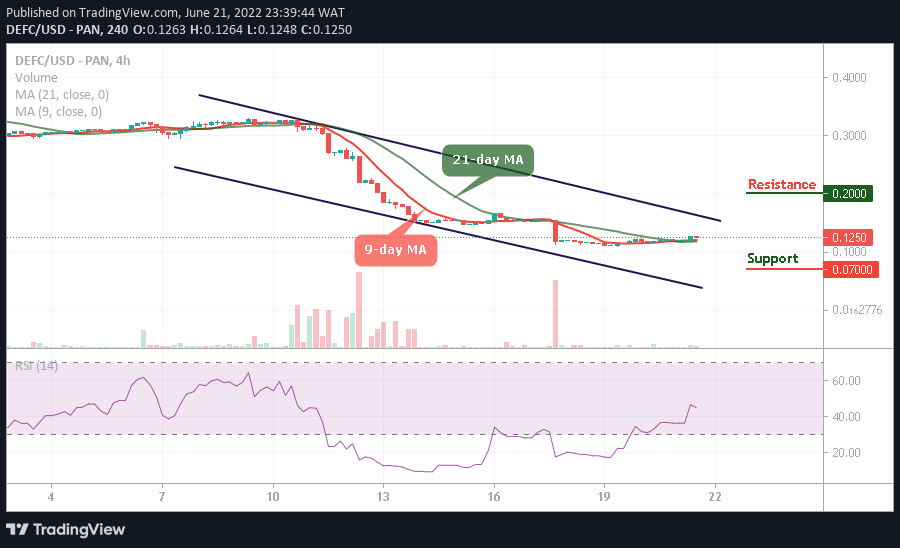
The 4-hour chart reveals that the DeFi Coin price prediction is getting ready for a cross towards the upper boundary of the channel.
DEFC/USD Medium-term Trend: Bearish (4H Chart)
Key Levels:
Resistance levels: $0.20, $0.22, $0.24
Support levels: $0.07, $0.05, $0.03
At the time of writing, DEFC/USD is trading above the 9-day and 21-day moving averages. Meanwhile, as the coin moves within the channel, the bullish momentum would push the coin towards the resistance level of $0.13. However, should the bulls fail to push the price upward; the DeFi Coin price will retreat below the moving averages to allow more buyers to come into the market.
DeFi Coin Price Prediction: DEFC/USD Prepares for the Upside Movement
The DeFi Coin price is hovering at $0.12 as it keeps moving above the 9-day and 21-day moving averages. However, if the coin spikes to the north, it would locate the potential resistance levels at $0.20, $0.22, and $0.24 but any bearish movement towards the lower boundary of the channel could hit the support levels at $0.07, $0.05, and $0.03 respectively. Meanwhile, the technical indicator Relative Strength Index (14) remains below the 45-level, which could increase the bearish momentum.
DEFC/USD Medium-term Trend: Bearish (2H Chart)
On the 2-hour chart, DEFC/USD remains above the 9-day and 21-day moving averages as the technical indicator Relative Strength Index (14) moves above the 60-level to push the coin to the upside. Moreover, any bullish movement above the current market value at $0.12 could hit the potential resistance level at $0.16 and above.
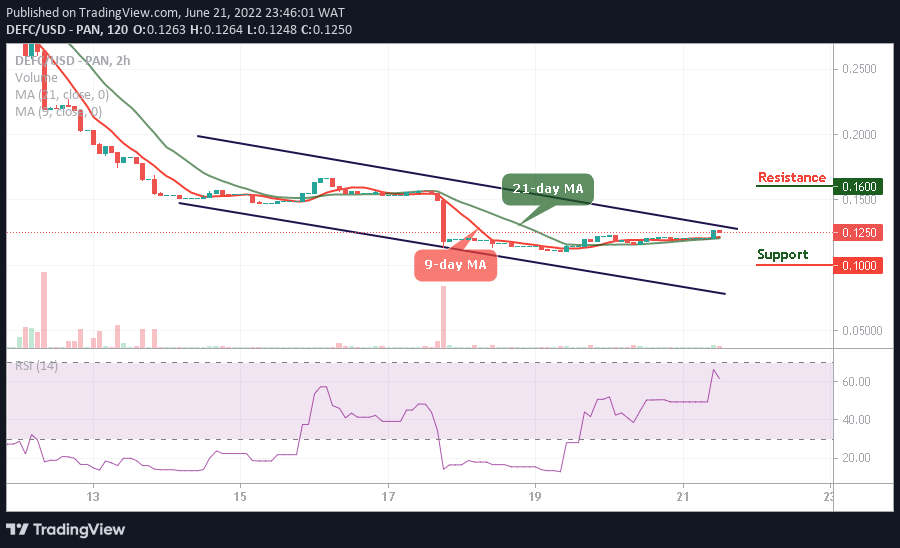
Nevertheless, to allow more investors to come into the market, DEFC/USD may retreat below the moving averages a little bit, once this comes to focus; it could touch the critical support at $0.10 and below as the existing buyers are expected to buy the dip.
You can purchase DeFi Coin here. Buy DEFC