It’s Sink or Swim for Band Protocol (BANDUSD) At $7.300 Resistance?
Estimated Reading Time: 3 minutes
Don’t invest unless you’re prepared to lose all the money you invest. This is a high-risk investment and you are unlikely to be protected if something goes wrong. Take 2 minutes to learn more
Band Market Analysis – BANDUSD Will either Sink or Swim At the $7.300 Resistance
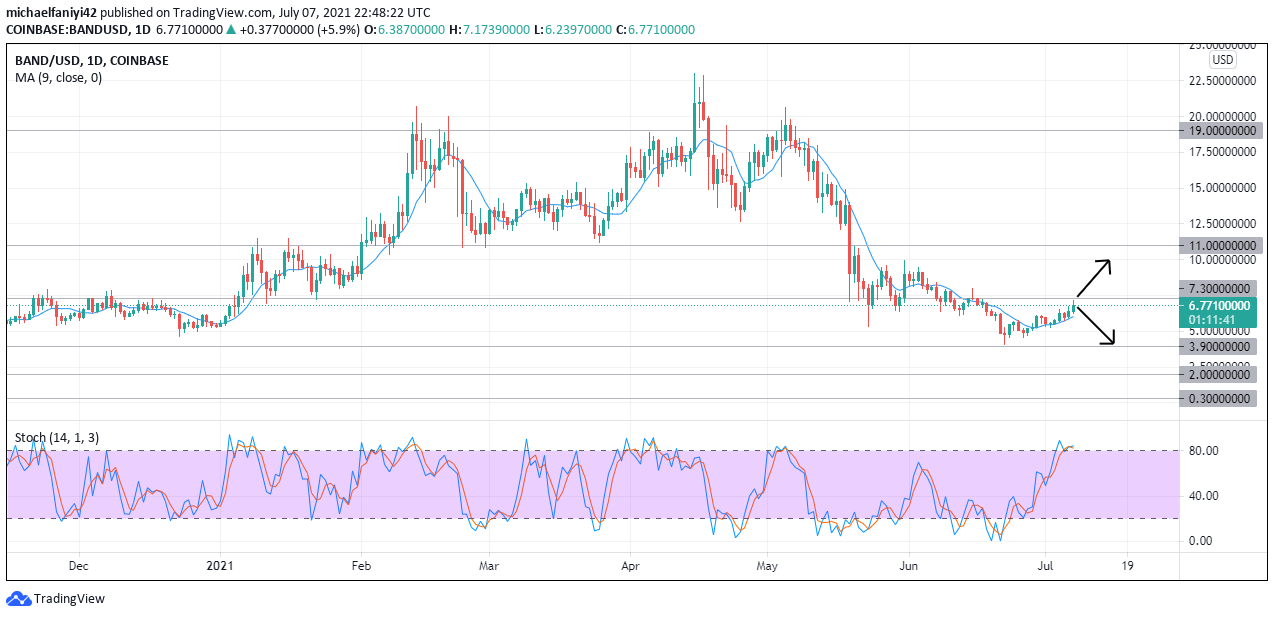
It’s sink or swim for BANDUSD at the $7.300 Resistance, and this will see it either breakout or be knocked back. The market entered the year cranking between the $7.300 and the $3.900 key levels. Then on the 6th of January 2021, there was a swim by the bulls to move above $7.300 as support to range between the $11.300 resistance.
It repeated this cycle when it swam above $11.300 as support to start ranging with the $19.000 key level. At this level, there was increased market volatility during the consolidation period. This can be seen in longer and bigger candlesticks. The bears then took control of the market, which made the price sink on the 19th of May 2021 back to the $7.300 support. The support defended the price till the 11th of June when it sank again below the key level, till it gradually landed on the $3.900 support.
The market is now taking off once again and it has to first confront the $7.300 key level to move higher. Failure to overcome the level will see it sink back to the $3.900 support, while it could yet swim above the level to get to the $11.000 key level. The 9MA (Moving Average) is supporting the market to swim above the barrier. It has aligned itself below the daily candle to support it going up. The Stochastic oscillator, however, has its signal lines now in the overbought region, meaning a price sink is imminent.
BANDUSD Key Levels
Resistance Levels: $19.000, $11.000, $7.300
Support Levels: $3.900, $2.000, $0.300
Market Anticipation
A bearish candle is the latest candle formed on the 4-hour chart. This is a result of the market sinking from $7.300 resistance. This could yet be a retracement for the price to swim up higher.
The 9MA is now slightly bent and, despite showing a general bullish trend, it signifies that a change in direction might be on the cards. The Stochastic oscillator already has its signal lines plunging from the overbought region, thereby showing that a bearish run has started.
The market will likely bounce down and sink from the $7.300 resistance to the next resistance at $3.900.
You can purchase crypto coins here. Buy Tokens
Note: Cryptosignal.org is not a financial advisor. Do your research before investing your funds in any financial asset or presented product or event. We are not responsible for your investing results.


