Litecoin (LTC/USD) Market Appears, Hitting a Resistance at $60
Estimated Reading Time: 3 minutes
Don’t invest unless you’re prepared to lose all the money you invest. This is a high-risk investment and you are unlikely to be protected if something goes wrong. Take 2 minutes to learn more

Free Crypto Signals Channel
Litecoin Price Prediction – July 19
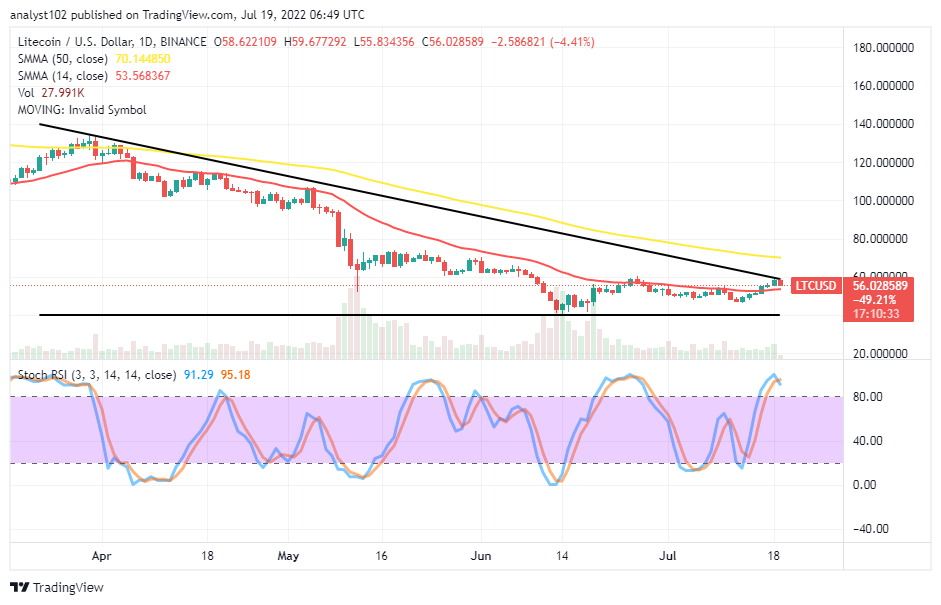
The LTC/USD market appears, hitting resistance at $60 after it put up with a less-active rallying motion toward the value line. The crypto’s price percentage rate of trading is at 4.41 negatives as it trades around $56 point as of writing.
LTC/USD Market
Key Levels:
Resistance levels: $60, $70, $80
Support levels: $40, $35, $30
LTC/USD – Daily Chart
The LTC/USD daily chart showcases the crypto economic market appears, hitting resistance at $60 after briefly breaching past the smaller SMA during the 16th session. The 50-day SMA trend line is above the 14-day SMA trend line. The horizontal line drew at the $40 support level to indicate the baseline from where some upswings have spanned. Currently, the Stochastic Oscillators are in the overbought region, trying to cross the lines southbound.
Which direction is the LTC/USD trade likely to turn into soon?
Based on the present technical reading outlook, the LTC/USD trade operation is likely to turn into a downward move as the crypto market appears, hitting resistance at $60. Bulls tend to lose momentum until another formation occurs when a bullish candlestick will have to emerge at a lower-trading spot close to or around the support level at $40 before re-considering launching new buying orders afterward.
On the downside of the technical analysis, the LTC/USD market bears have to intensify efforts to push down the crypto’s valuation from or around the $60 resistance level. A bearish candlestick is in the making, trying to signify the beginning of a falling process from the value line. It may not be easy for the market swings northward for a breakout of the point. If that sentiment has to invalidate in the run at that strength-trading capacity, the price will most likely cage between the point and the $70 resistance so that sellers may have a better chance to get a re-launch.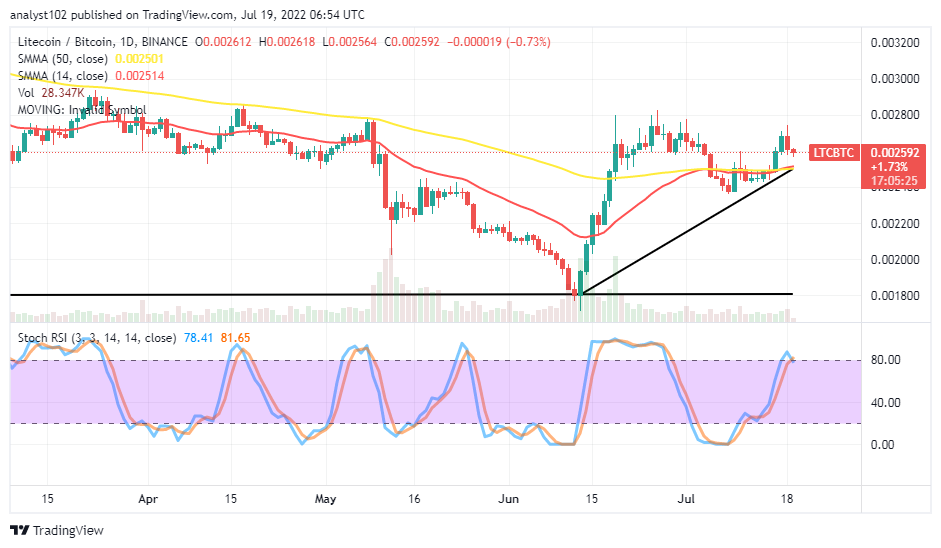
LTC/BTC Price Analysis
Litecoin, in comparison to the trending worth of Bitcoin, has been building a path to the moon. The cryptocurrency pair price appears, hitting a resistance above the trend line of the SMAs. The 14-day SMA indicator has moved northward to conjoin with the 50-day SMA indicator. The bullish trend line drew to touch the bottoms of candlesticks around the conjoined area of the SMAs. The Stochastic Oscillators are around the 80 range, trying to cross the lines southbound to indicate the base crypto may be debasing soon, pairing with the counter crypto.
Note: Cryptosignals.org is not a financial advisor. Do your research before investing your funds in any financial asset or presented product or event. We are not responsible for your investing results.
“Lucky is up more than 50% today but still more than 430% from All Time Highs!
The opportunity to bank BIG is now!
You can purchase Lucky Block here. Buy LBlock