Litecoin (LTC/USD) Market Slips, Finding Support at $200
Estimated Reading Time: 3 minutes
Don’t invest unless you’re prepared to lose all the money you invest. This is a high-risk investment and you are unlikely to be protected if something goes wrong. Take 2 minutes to learn more
Litecoin Price Prediction – November 23
It still recorded that the LTC/USD market slips, finding support at a $200 trading line. As of writing, the crypto-economic price trades around $212 at a percentage rate of about 1.46 positive. That gives a brighter rise in the expectation that the market will still potentially experience some upward pressures in no time from the value line mentioned earlier.
LTC/USD Market
Key Levels:
Resistance levels: $225, $250, $275
Support levels: $175, $150, $125
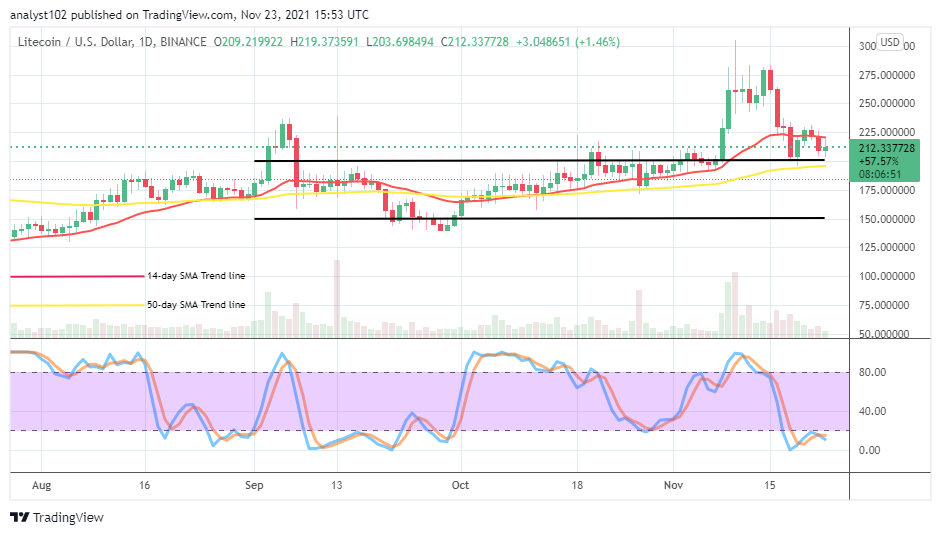
LTC/USD – Daily Chart
The LTC/USD daily chart showcases that the crypto-economic market slips, finding support at a $200 business operating level. On November 18th day session, a bearish candlestick emerged, bottoming closely to the value line to mark the recent last down-turning motions. On the following day of business activity, the 19th, a bullish candlestick surfaced to signify a return of an upward movement. But, the moves got resisted at around $225 level on the third trading time. The 50-day SMA indicator is closely underneath the value line mentioned earlier as the 14-day SMA indicator is above it, located close beneath the near-stated resistance level. The Stochastic Oscillators are in the oversold region, moving in a consolidation style. That denotes that indecision is ongoing presently.
Can further downward pushes be overruled as the LTC/USD market slips, finding support at $200?
As it observed that the LTC/USD price now somewhat moves in a consolidation manner as the market slips, finding support at $200 level, further downward pushes cannot overrule against the value line. However, the same value line appears promising to serve as the fresh-solid support baseline that price can rely upon for making subsequent re-bounding motions.
On the contrary to the upside technical price analysis, the LTC/USD market sellers needed to hold their positions firm against any motion appearing to move past the $225 level in the long run. In the process of heightening the pressure in the current consolidation-moving manner, the support level at $200 may get exposed to breach southward in a consequential order afterward. But, it may not be forthcoming in the near time.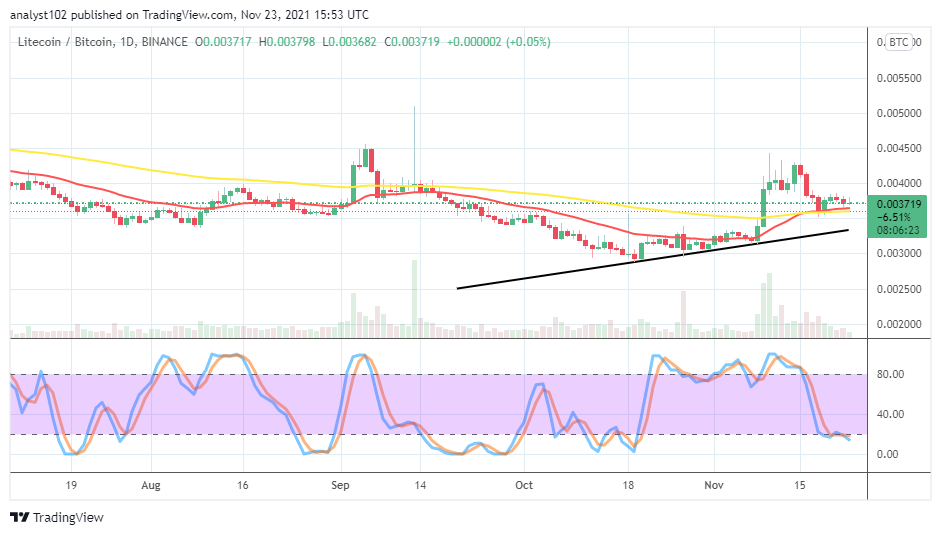
LTC/BTC Price Analysis
In comparison, Litecoin’s trending catalyst appears, losing momentum to Bitcoin. The cryptocurrency pair market slips, finding support closely above the SMA trend lines. The 14-day SMA indicator is tightly-positioned above the 50-day SMA indicator. The bullish trend line drew underneath the SMA trend lines to indicate that the duo cryptocurrency’s price trades around a higher zone despite the slippages. The Stochastic Oscillators are at a range of 20, moving in a consolidation. They are seemingly trying to open the lines southbound against the range line mentioned. That indicates that the base crypto may still experience some more degrees of down-turnings.
Note: Cryptosignals.org is not a financial advisor. Do your research before investing your funds in any financial asset or presented product or event. We are not responsible for your investing results.
You can purchase crypto coins here. Buy Tokens