Lucky Block (LBLOCK/USD) Market Shows Strong Bullish Momentum And Upward Breakout Potential
Estimated Reading Time: 3 minutes
Don’t invest unless you’re prepared to lose all the money you invest. This is a high-risk investment and you are unlikely to be protected if something goes wrong. Take 2 minutes to learn more

Lucky Block Price Forecast – April 28
LBLOCK/USD market shows strong bullish momentum and upward breakout potential. The bullish momentum is likely to continue as price stays above the $0.00001400 support.
The technical indicators confirm a strong bullish trend on the LBLOCKUSD daily chart. The 9-day Simple Moving Average (SMA) at $0.00001450 is trending upward and acting as a dynamic support level. Price is consistently trading above the SMA, signaling buyer control. Additionally, the Moving Average Convergence Divergence (MACD) is bullish, with the MACD line above the signal line and both trending above zero. This configuration reinforces that positive momentum is building, increasing the likelihood of further upward price movements.
LBLOCK/USD Market Key Levels:
Resistance levels: $0.00001880, $0.00002490, $0.00002990
Support levels: $0.00001400, $0.00001000, $0.00000800

LBLOCK/USD – Daily Chart
The daily chart of LBLOCKUSD shows that the market is strongly bullish.
The price action also validates the bullish outlook. After forming a strong base above $0.00000960, LBLOCKUSD began a steady climb, breaking minor resistances like $0.00001260 and $0.00001400.
It is now holding above the $0.00001500 zone, forming higher highs and higher lows along a clear ascending trendline. The recent bullish engulfing candle shows strong buyer interest after minor dips, suggesting that dips are being bought aggressively.

What is the market outlook of LBLOCK/USD?
Looking ahead, LBLOCKUSD could aim for the next major resistance at $0.00001880. If bullish pressure continues, a breakout above $0.00001880 could open the way for a rally towards $0.00002490.
Beyond that, the longer-term target would be around $0.00002990 if momentum remains strong. On the downside, $0.00001000 serves as a critical support zone to protect against deeper pullback. The bias remains bullish as long as the price stays above the ascending trendline and key moving average support.
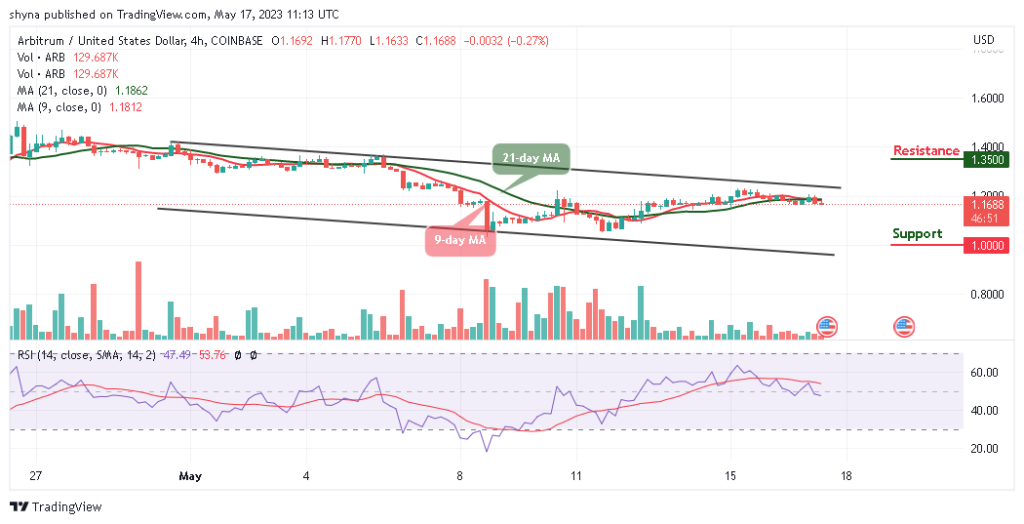
LBLOCK/USD – Four-Hour Chart
LBLOCKUSD is showing bullish momentum on the 4-hour chart with price holding above the 9-SMA. The recent pullback into the 4H order block around $0.00001400 was quickly rejected, confirming strong buyer interest.
MACD remains above the zero line, supporting continued upward pressure. A breakout above $0.00001510 could trigger a rally toward the next resistance at $0.00001880.
Lucky Block (LBLOCK) Current Statistics
The current price: $0.00001510
Market Capitalization: $1,160,000
Trading Volume: $19,360
Do you need a coin that will 100X soon? Get LBLOCK here