Polkadot Declines to $16 as the Altcoin Resumes Consolidation above It
Estimated Reading Time: 2 minutes
Don’t invest unless you’re prepared to lose all the money you invest. This is a high-risk investment and you are unlikely to be protected if something goes wrong. Take 2 minutes to learn more

Free Crypto Signals Channel

Polkadot (DOT) Long-Term Analysis: Bearish
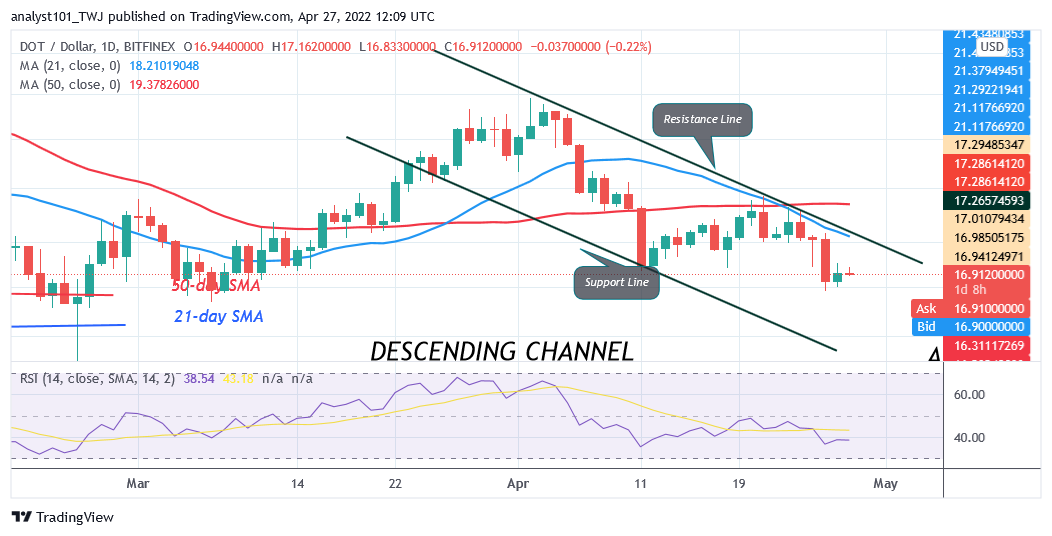
Polkadot’s (DOT) price is in a downtrend as the altcoin resumes consolidation above it. DOT price has broken below the moving averages and revisited the previous low at $17. On April 26, DOT price fell to the low of $16 as bulls bought the dips. The altcoin is resuming above the current support. Polkadot will be compelled to a range bound move between $16 and $19 price levels if the current support holds. However, if the bears break below the $17 support, the market will further decline to the low of $14. In the meantime, the altcoin is rising upward after the recent price slump.
Polkadot (DOT) Indicator Analysis
DOT price is at level 38 of the Relative Strength Index for period 14. The altcoin is in the downtrend zone and it is approaching the oversold region of the market. The crypto’s price is below the moving averages which are responsible for the current price fall. The altcoin is above the 25% range of the daily stochastic. It indicates that the market is in a bullish momentum. The 50-day line SMA and the 21-day line SMA are sloping downward indicating the downtrend.
Technical indicators:
Major Resistance Levels – $48, $52, $56
Major Support Levels – $32, $28, $24
What Is the Next Direction for Polkadot (DOT)?
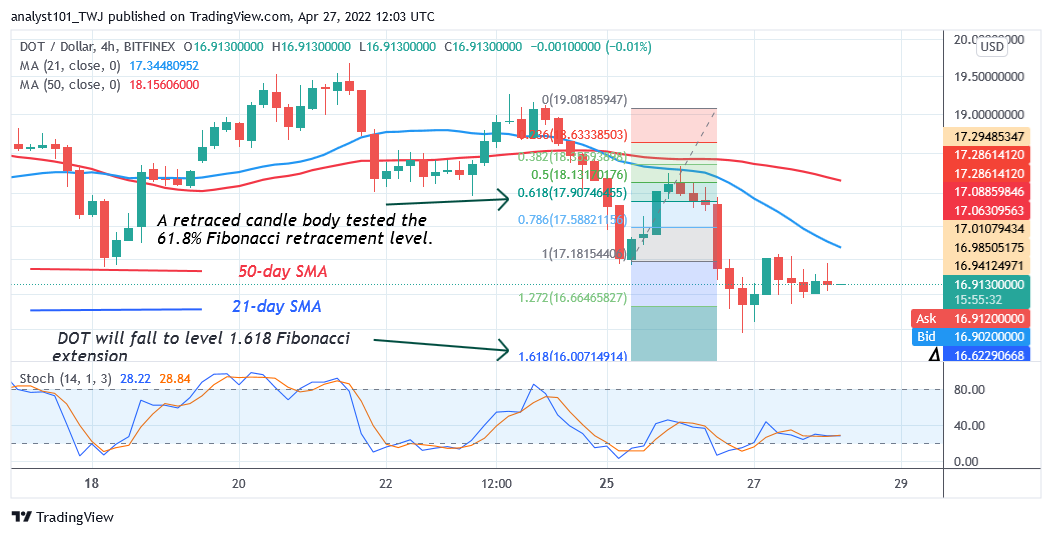
DOT/USD is in a downtrend as altcoin resumes consolidation above it. Meanwhile, on April 25 downtrend; a retraced candle body tested the 61.8% Fibonacci retracement level. The retracement suggests that DOT price will fall to level 1.618 Fibonacci extension or level $16.
You can purchase crypto coins here. Buy LBlock
Note: Cryptosignals.org is not a 1a financial advisor. Do your research before investing your funds in any financial asset or presented product or event. We are not responsible for your investing results


