Polygon (MATIC/USD) Trade Musters Up, Faces $60 Resistance
Estimated Reading Time: 4 minutes
Don’t invest unless you’re prepared to lose all the money you invest. This is a high-risk investment and you are unlikely to be protected if something goes wrong. Take 2 minutes to learn more
Polygon Price Prediction – October 22
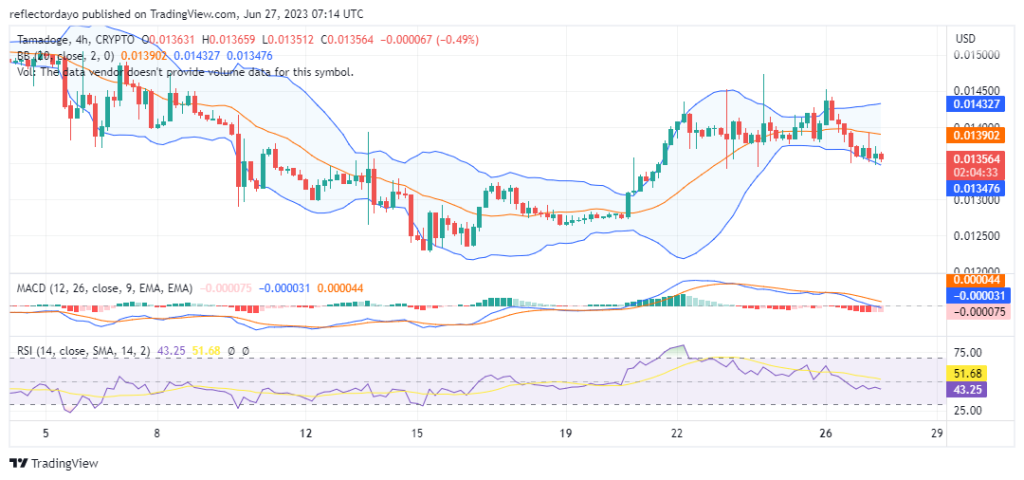
Some chains of transactions have cropped up between buyer and seller in the TAMA/USD market, showcasing the crypto trade mustering up momentum from around the line of $0.50 and facing the $60 resistance level.
As of the writing of this article, a sign of reverse movement mode has appeared, which may indicate that some range productions are likely to include between $60 and $0.50 in value. Long-position takers will need to be patient while waiting for that assumption to come true because it seems like the price forces are moving slowly. However, by keeping views on a long-term running arrangement, investors are in a stronger position.
MATIC/USD Market
Key Levels:
Resistance levels: $0.65, $0.70, $0.75
Support levels: $0.50, $0.45, $0.40
MATIC/USD – Daily Chart
The MATIC/USD daily chart reveals the crypto trade musters up catalysts and faces the $60 resistance bargain line as the price is trading around $0.564 at an average negative percentage rate of 1.57.
The Bollinger Band trend lines have been placed at different strategic positional points of $0.582, $0.537, and $0.492, respectively. The stochastic oscillators have been placed on the north side, from 58.797 to 85.776. The featuring of a smaller bearish candlestick signifies that bulls are again beginning to enfeeble their presences closely around the upper range line drawn.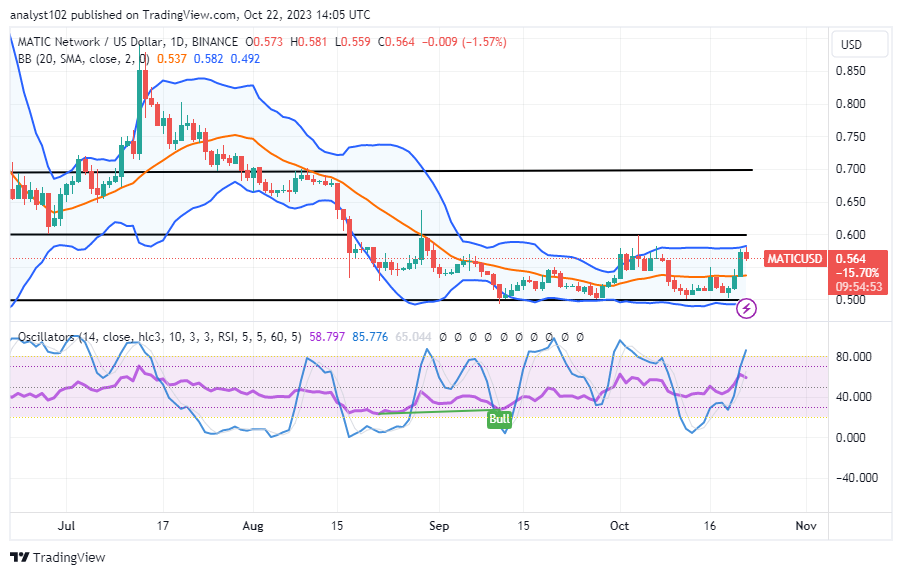
Should long-term investors be wary of maintaining their positions in the current range-bound spots that the MATIC/USD market is trading presently?
We recommend that buyers of the MATIC/USD market between the points of $0.50 and $0.60 should not entertain fears of losing their funds to the downside, given that the crypto trade musters up energy and faces the $60 resistance line.
A limited number of shorting window opportunities have been made available so that those who wish to take short positions will be informed when prices begin to sharply reverse from the $60 mark and will be able to place an immediate sell order. A sudden breakout against the point that could move northward motions into a risky situation that bears won’t be able to contend.
Long-position placers have been gradually discovered to have a habit of missing out on the pressures to the topside beyond the resistance level of $60, as has currently been proven. The upper Bollinger Band trend line might conceivably extend to the moon due to an intense gravitational impulse upward. It is wise for investors to continue to move on an upward path.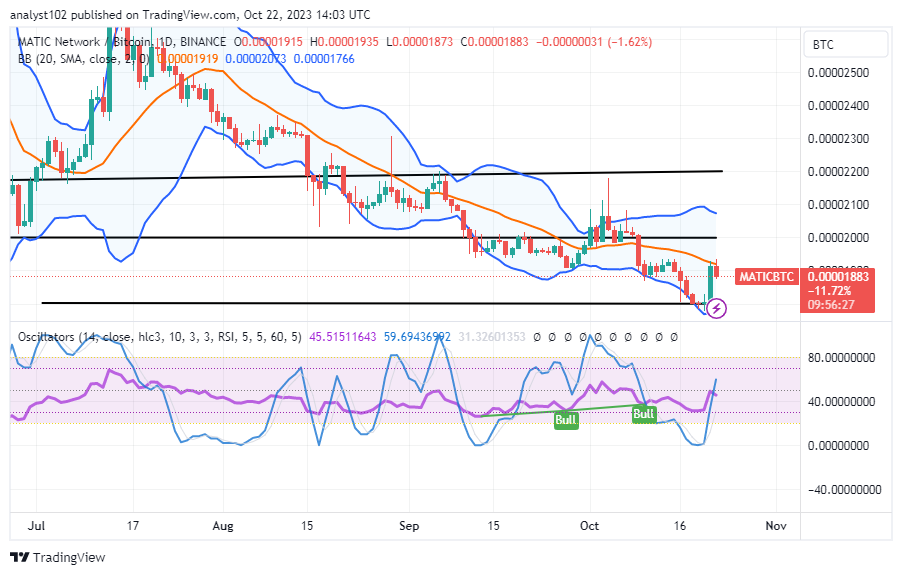
MATIC/BTC Price Analysis
In comparison, Polygon musters up strength versus the trending capability of Bitcoin and faces the resistance line of the middle Bollinger Band trend line.
The stochastic oscillators are maintaining values between 445.51511643 and 59.69436992 points, pointing north. During yesterday’s activities, a bullish candlestick tested the lower portion of the middle section of the Bollinger Band trend lines. The base cryptocurrency instrument is currenly moving, perhaps under the influence of the countertrading crypto economy. That suggests that the customer is just about to start over with new stances from a lower starting point.
Note: Cryptosignals.org is not a financial advisor. Do your research before investing your funds in any financial asset or presented product or event. We are not responsible for your investing results.
You can purchase Lucky Block here. Buy LBLOCK