Ripple Is in Range-Bound Move, Unable to Break above $0.63 High
Estimated Reading Time: 2 minutes
Don’t invest unless you’re prepared to lose all the money you invest. This is a high-risk investment and you are unlikely to be protected if something goes wrong. Take 2 minutes to learn more

Free Crypto Signals Channel
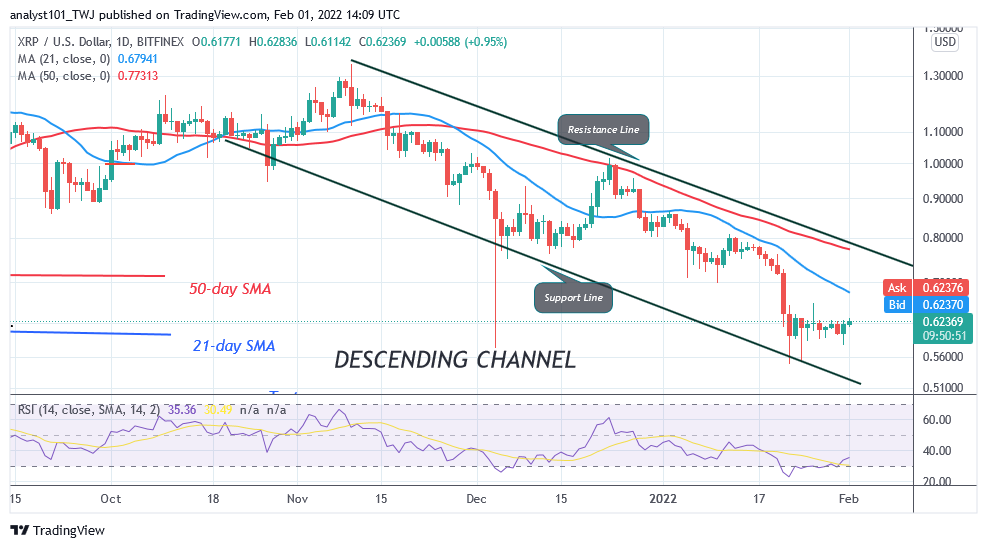
Ripple (XRP) Long-Term Analysis: Bearish
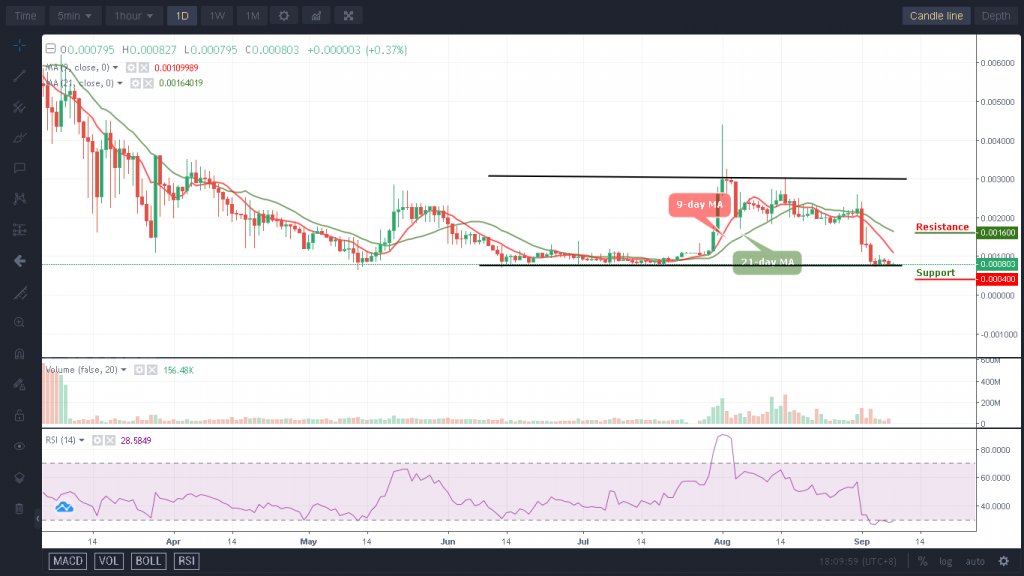
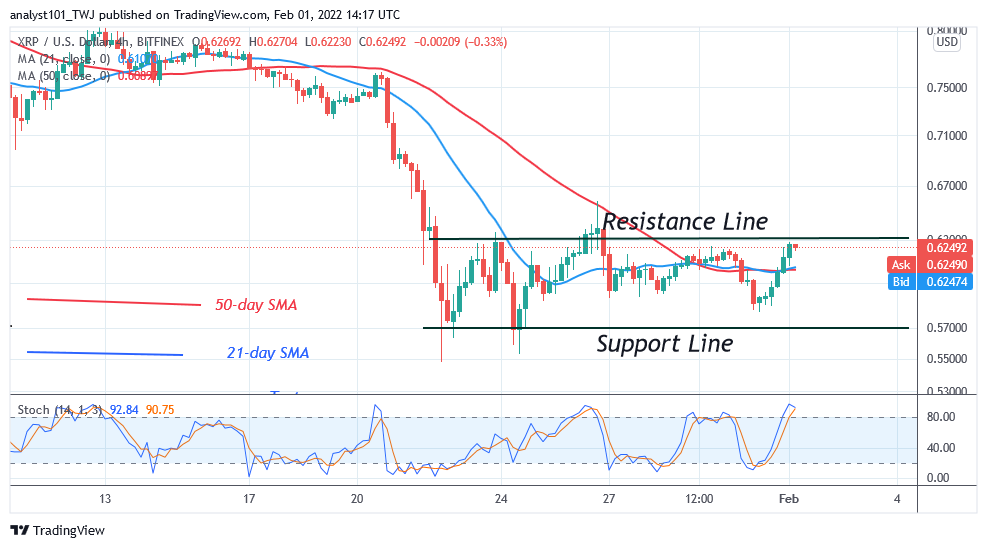
Ripple’s (XRP) price has resumed a sideways trend but unable to break above $0.63 high. Following the bearish trend of January 22, XRP has been fluctuating between $0.57 and 0.63 price levels. The bulls failed to break the recent high after several retests. Ripple may decline to $0.57 low if it faces rejection at the recent high. However, if the bulls eventually break the $0.63 resistance, the market will rally to $0.75 high. Meanwhile, XRP/USD is trading at $0.63 at the time of writing.
Ripple (XRP) Indicator Analysis
Ripple is at level 35 of the Relative Strength Index for period 14. XRP is still in the bearish trend zone and below the centerline 50. The cryptocurrency is trading in the downtrend zone and below the centerline 50. Presently, Ripple is above the 80% range of the daily stochastic. Ripple is in the overbought region of the market and may likely to decline to the downside.
Technical indicators:
Major Resistance Levels – $2.00, $2.50, $3.00
Major Support Levels – $1.50, $1.00, $0.50
What Is the Next Direction for Ripple (XRP)?
XRP/USD is in a sideways trend but unable to break above $0.63 high. The altcoin is likely to decline as it is trading in the overbought region of the market. The cryptocurrency may decline and find support above the moving averages or the low of $0.57.
You can purchase crypto coins here. Buy Tokens
Note: Cryptosignals.org is not a financial advisor. Do your research before investing your funds in any financial asset or presented product or event. We are not responsible for your investing results