Solana (SOL/USD) Market Is on a Bullish Path, Resetting a Base at SMA
Estimated Reading Time: 3 minutes
Don’t invest unless you’re prepared to lose all the money you invest. This is a high-risk investment and you are unlikely to be protected if something goes wrong. Take 2 minutes to learn more
Solana Price Prediction – July 28
The present technical trading angle has produced the result that the SOL/USD market is on a bullish path, resetting a bases around the trend line of the smaller Moving Average.
After establishing support during a necessary retracement phase, buying sprees have been out in the open, pushing farther north. It looks like there may be a series of setbacks to allow the price to recover from a predetermined lower point before turning higher again.
SOL/USD Market
Key Levels:.
Resistance levels:$28, $30, $32
Support levels: $20, $18, $16
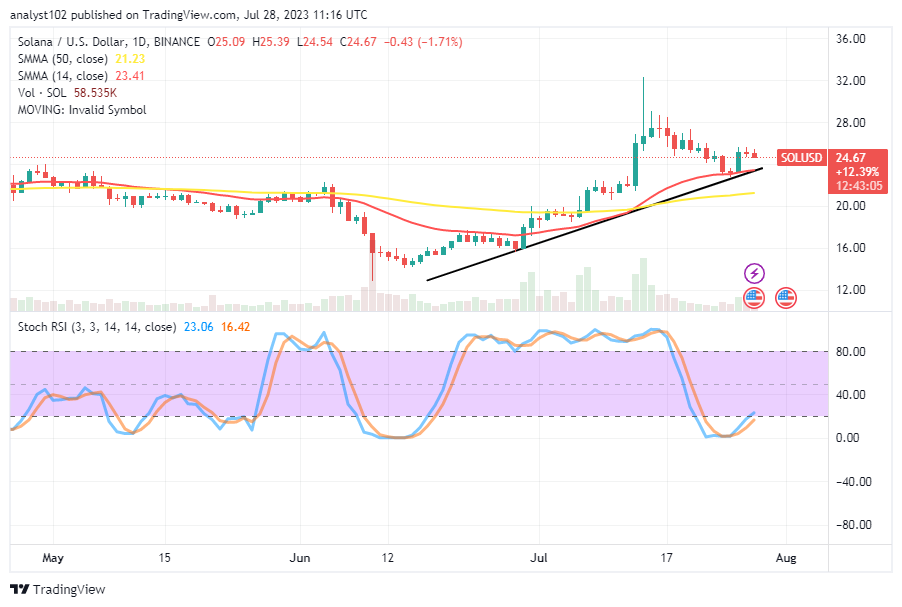
SOL/USD – Daily Chart
The SOL/USD daily chart showcases that the crypto-economic market is on a bullish path, resetting a base around the smaller SMA trend line.
The $23.41 level of the 14-day SMA trend line is higher than the $21.23 level of the 50-day SMA trend line. The bullish trend line has re-entered the market, indicating that the crypto economy has somewhat recovered. The Stochastic Oscillators have crossed northbound from the oversold region to positions between 16.42 and 23.06 values.
What is the SOL/USD market’s depicted trade status at the time of this technical piece?
A slight correction is tending to surface, possibly to recoup its basis from around the trend axis of the bullish trend line dawn in the SOL/USD market operation, as the crypto-economic price is on a bullish path, resetting a base at the smaller SMA.
The following buying pressures are likely to potentially surface a line of variant-ranging moves on the buying side of the SMA trend lines if they are intending to relax their effects on the market for a period of time. There are close underlying supports from $23 down to a critical low of $20 that bulls should be wary of.
During the 26th day of trading, a bullish candlestick emerged to set a lower value that bears needed to breach if their signs of raising corrections would be brightened soon. The bottom point was staged on the path of the smaller Moving Average indicator.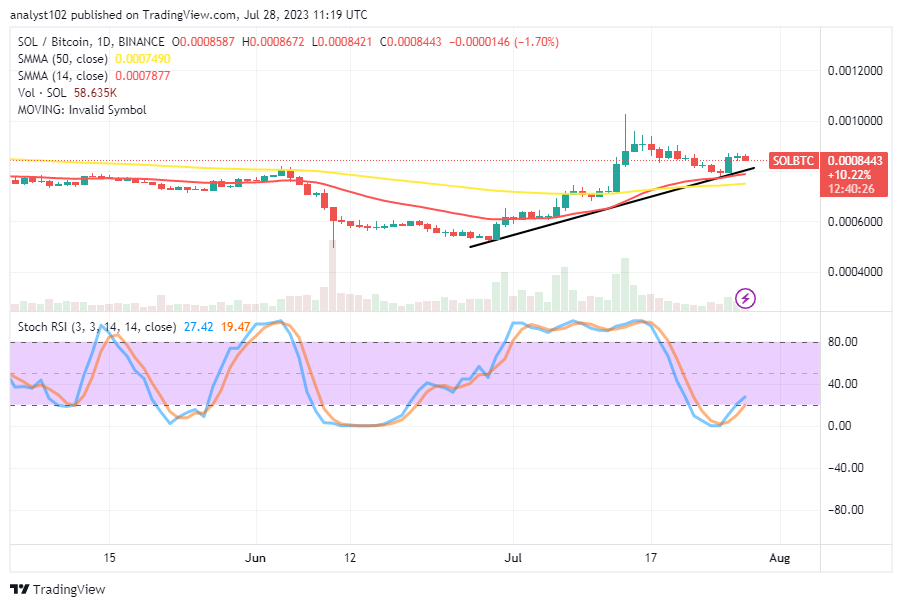
SOL/BTC Price Analysis
In contrast, the Solana market is on a bullish path, resetting a base toward the trend lines of the SMAs against the purchasing trend capacity of Bitcoin.
The 50-day SMA trend line has allowed the 14-day SMA trend line to closely curve northward. Additionally, the candlestick pattern has been designed to create a positive trend line to confirm the lower levels that the paired cryptocurrency trade has been holding up. The stochastic oscillators have moved from the oversold area to a position between 19.47 and 27.42 in a northward direction. There are now signs that the base cryptocurrency has been anticipating some swing highs in relation to the counter-trading cryptocurrency.
Note: Cryptosignals.org is not a financial advisor. Do your research before investing your funds in any financial asset or presented product or event. We are not responsible for your investing results.
You can purchase Lucky Block here. Buy LBLOCK